Lesson 7: Identifying and Trading Elliott Zigzag Waves (5-3-5)
The zigzag is one of the most common corrective patterns in Elliott Wave Theory, consisting of 3 corrective waves A-B-C. This article helps you identify the zigzag wave and understand how to trade wave C exactly according to the method in the original book.
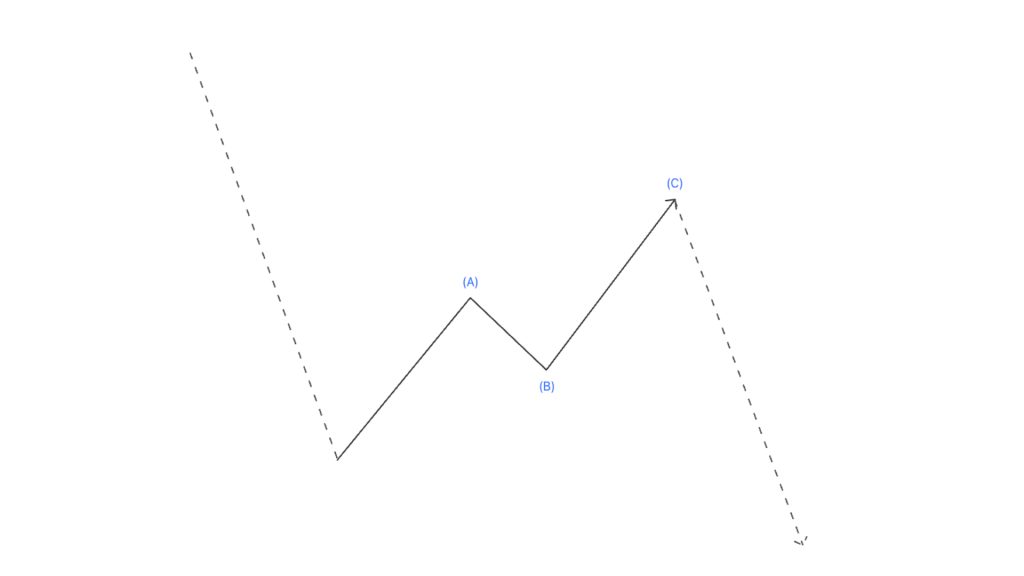 Figure 1: Zigzag corrective wave A-B-C
Before going deeper, you should place the zigzag on the overall map of corrective waves. Elliott divides corrective waves into four main groups:
- Zigzag (5-3-5): a sharp corrective form, including single, double and triple.
- Flat (3-3-5): a sideways corrective form, including regular, expanded and running.
- Triangle (3-3-3-3-3): a contracting or expanding consolidation form.
- Complex (Double three and triple three): structures combining multiple simple patterns.
The zigzag opens this group because it is the simplest and most direct form. Understanding the zigzag first creates the foundation for reading more complex patterns.
What is an Elliott zigzag wave?
The zigzag wave pattern is a three-wave corrective pattern with a 5-3-5 structure, labelled A-B-C, moving against the direction of the larger-degree trend. In a bull market, a zigzag is a three-wave decline, with the top of wave B clearly lower than the starting point of wave A. This characteristic helps you distinguish a zigzag from sideways corrective patterns at first glance.
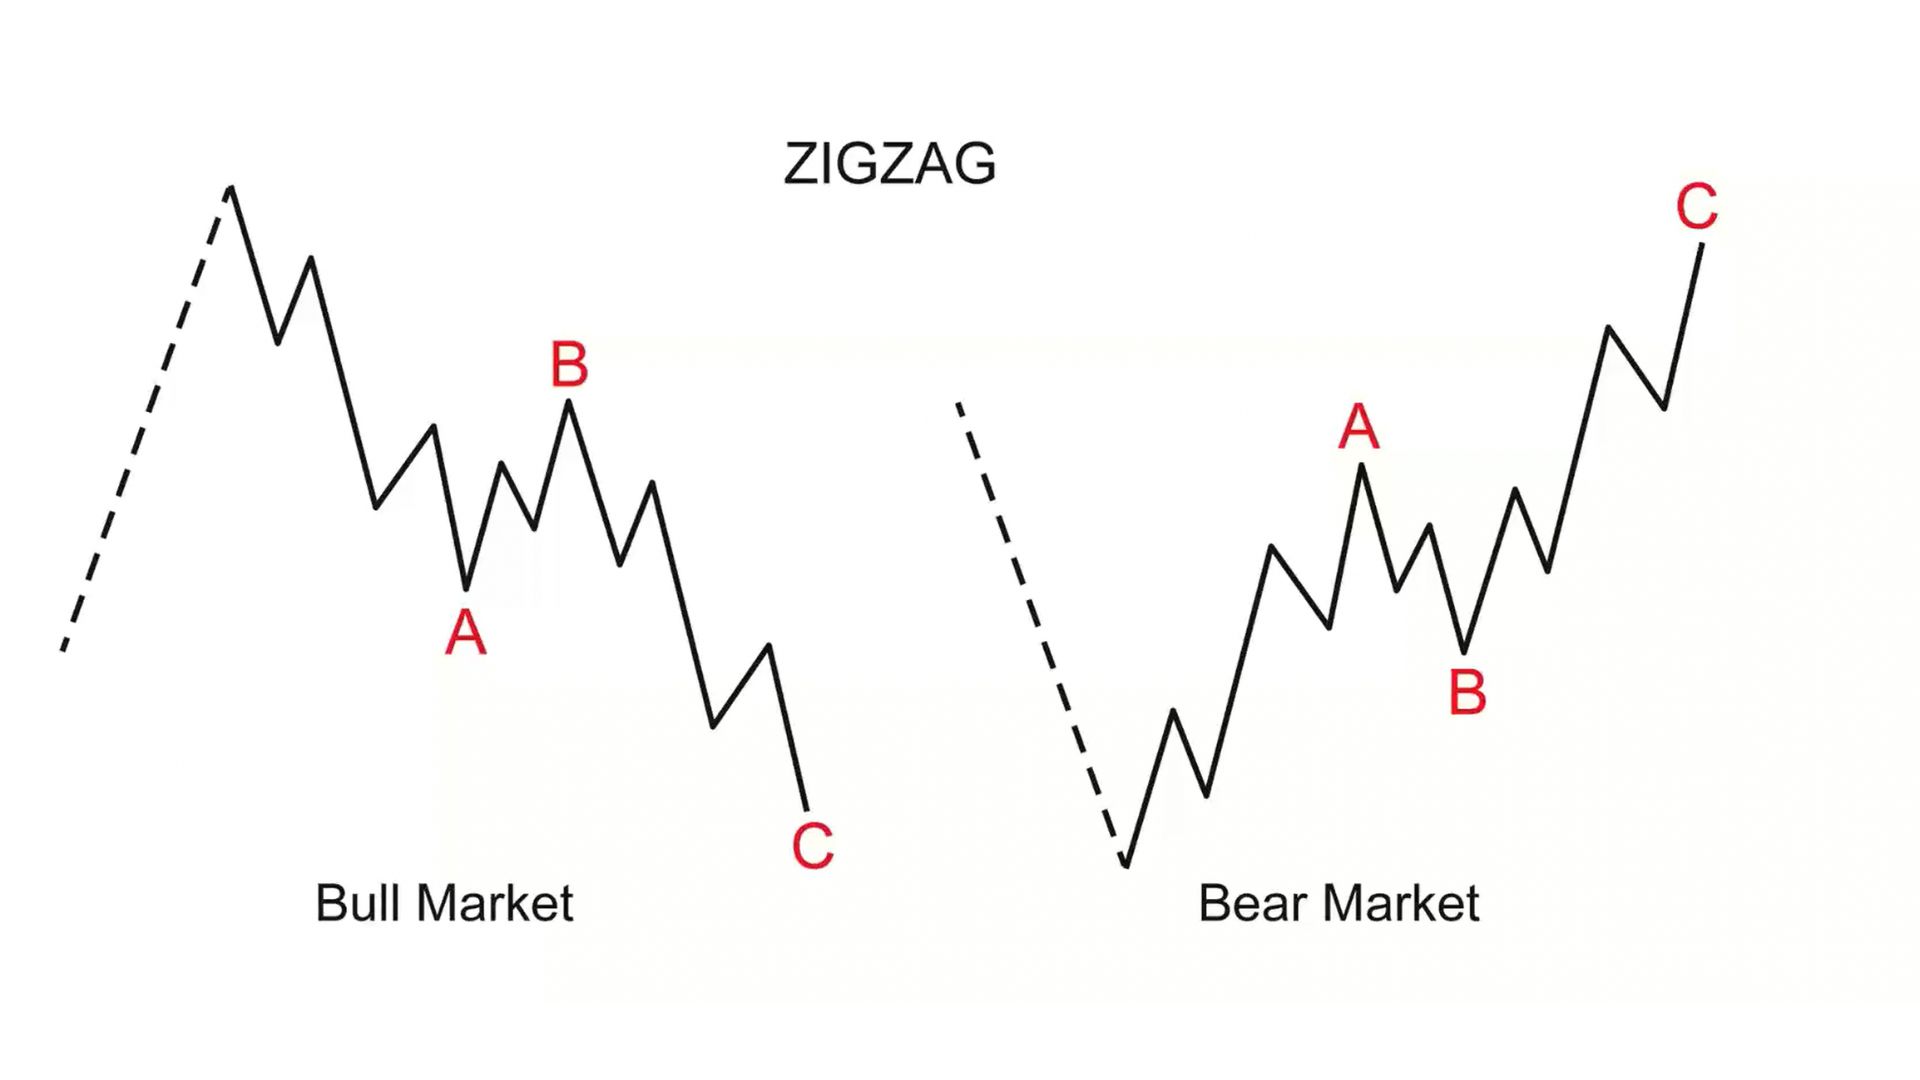 Figure 2: Zigzag pattern in Elliott consisting of 3 waves A-B-C
In a bear market, the zigzag wave unfolds in the opposite direction, i.e. a three-wave rally upward. For this reason, analysts call the zigzag pattern in a bear market an inverted zigzag. The structural nature does not change, only the direction of movement is reversed, so you apply the same set of identification rules to both cases.
Analyzing the 5-3-5 zigzag wave structure
The notation 5-3-5 describes the number of sub-waves inside each component wave of the zigzag:
- Wave A consists of 5 sub-waves: an impulse wave or a leading diagonal.
- Wave C consists of 5 sub-waves: an impulse wave or an ending diagonal. The length of wave C is usually equivalent to wave A.
- Wave B consists of 3 sub-waves: taking any corrective form including zigzag, flat, triangle, or a combination form.
This structure originates from the original principle of the theory: waves A and C are motive waves that subdivide into 5 waves, while wave B is a reactive wave so it subdivides into 3.
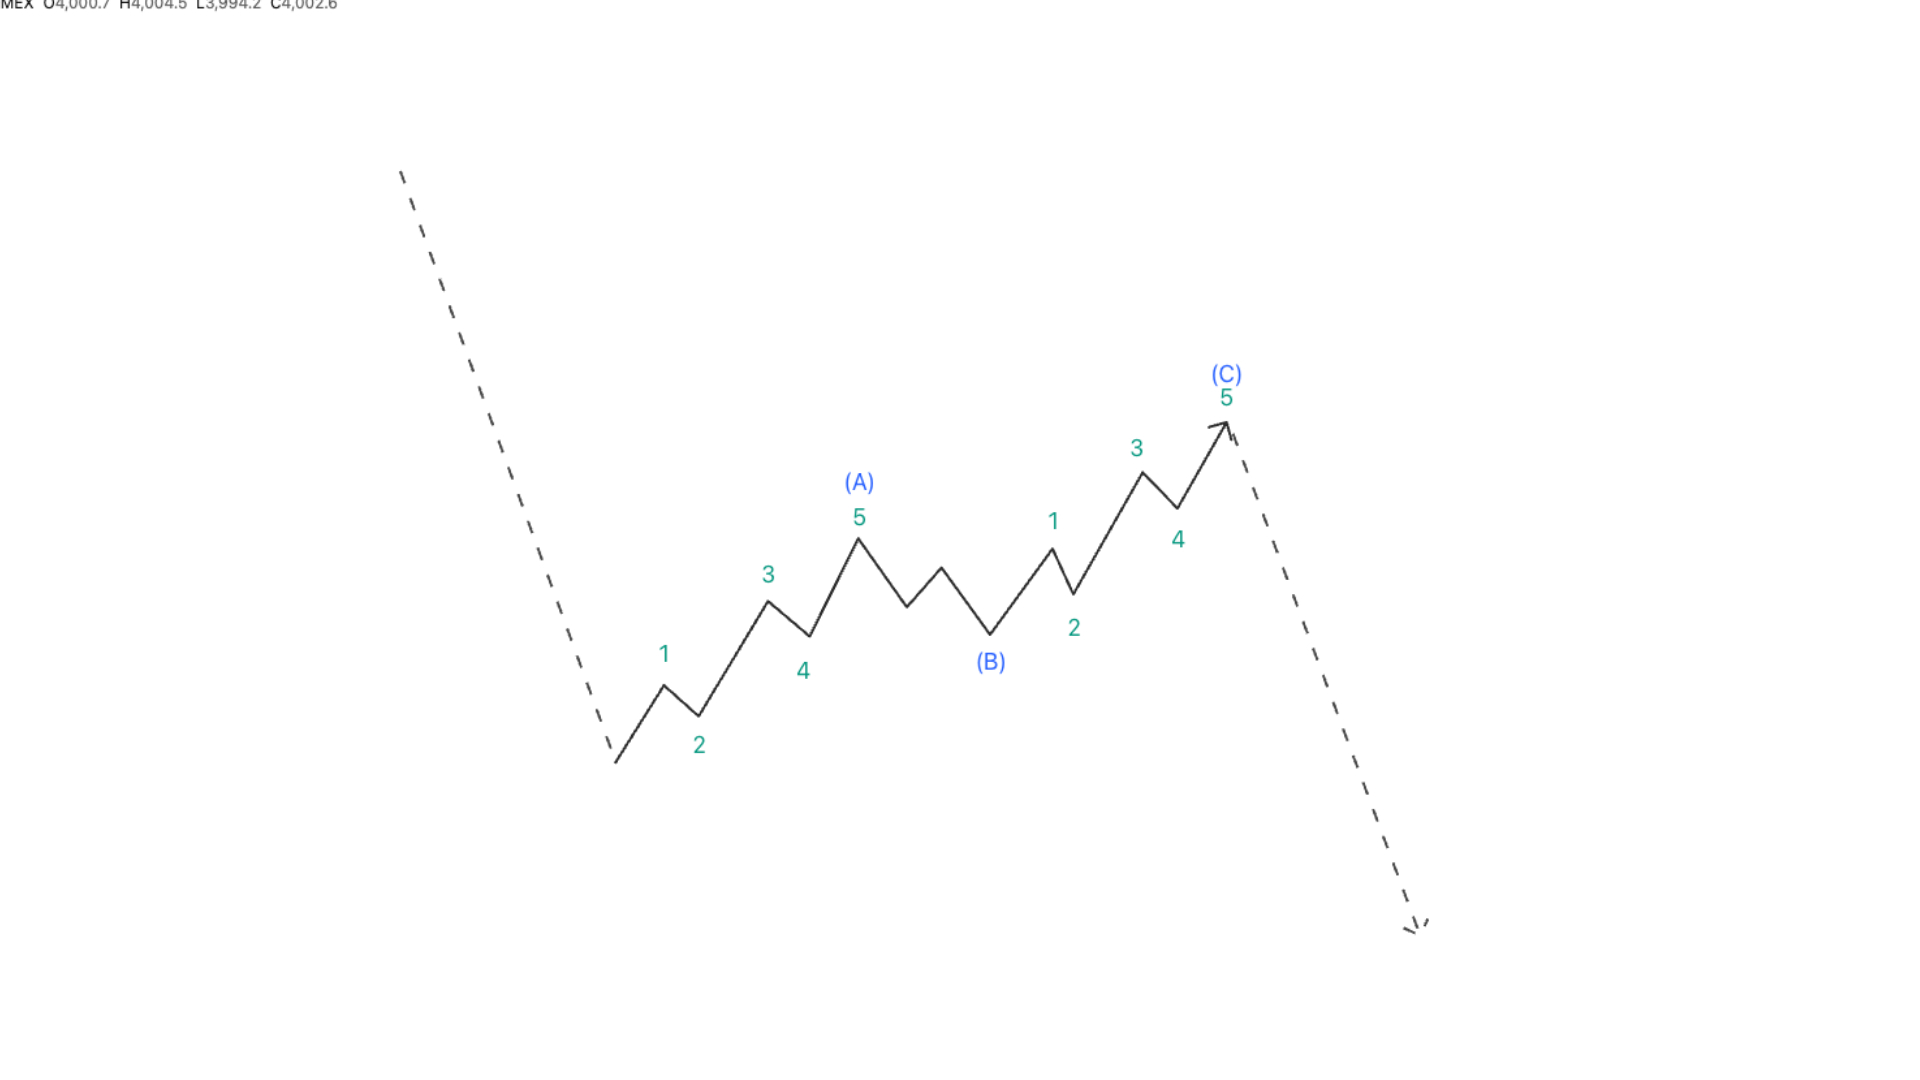 Figure 3: Structure of the 5-3-5 zigzag pattern
In terms of slope, the zigzag wave cuts back against the old trend at a steep angle, but does not push price back into the top or bottom area of the preceding motive wave.
Precisely because of the high slope of the zigzag, it is also called a "Sharp correction."
This steep characteristic contrasts with a sideways correction, i.e. the sideways corrective group such as flat and triangle. The distinction between sharp and sideways is not only descriptive. It is the basis for the rule of alternation that you will use to forecast the shape of the next corrective wave within the same impulse wave.
Rules for identifying waves A, B, C in a zigzag
To confirm a pattern is a zigzag, you check three conditions regarding price position:
- Wave A: begins with 5 waves against the direction of the larger trend (impulse or leading diagonal).
- Wave B: retraces part of wave A but does not exceed the starting point of A (flat or triangle or sub-zigzag).
- Wave C: extends by another 5 waves, usually going beyond the end point of wave A (impulse or ending diagonal).
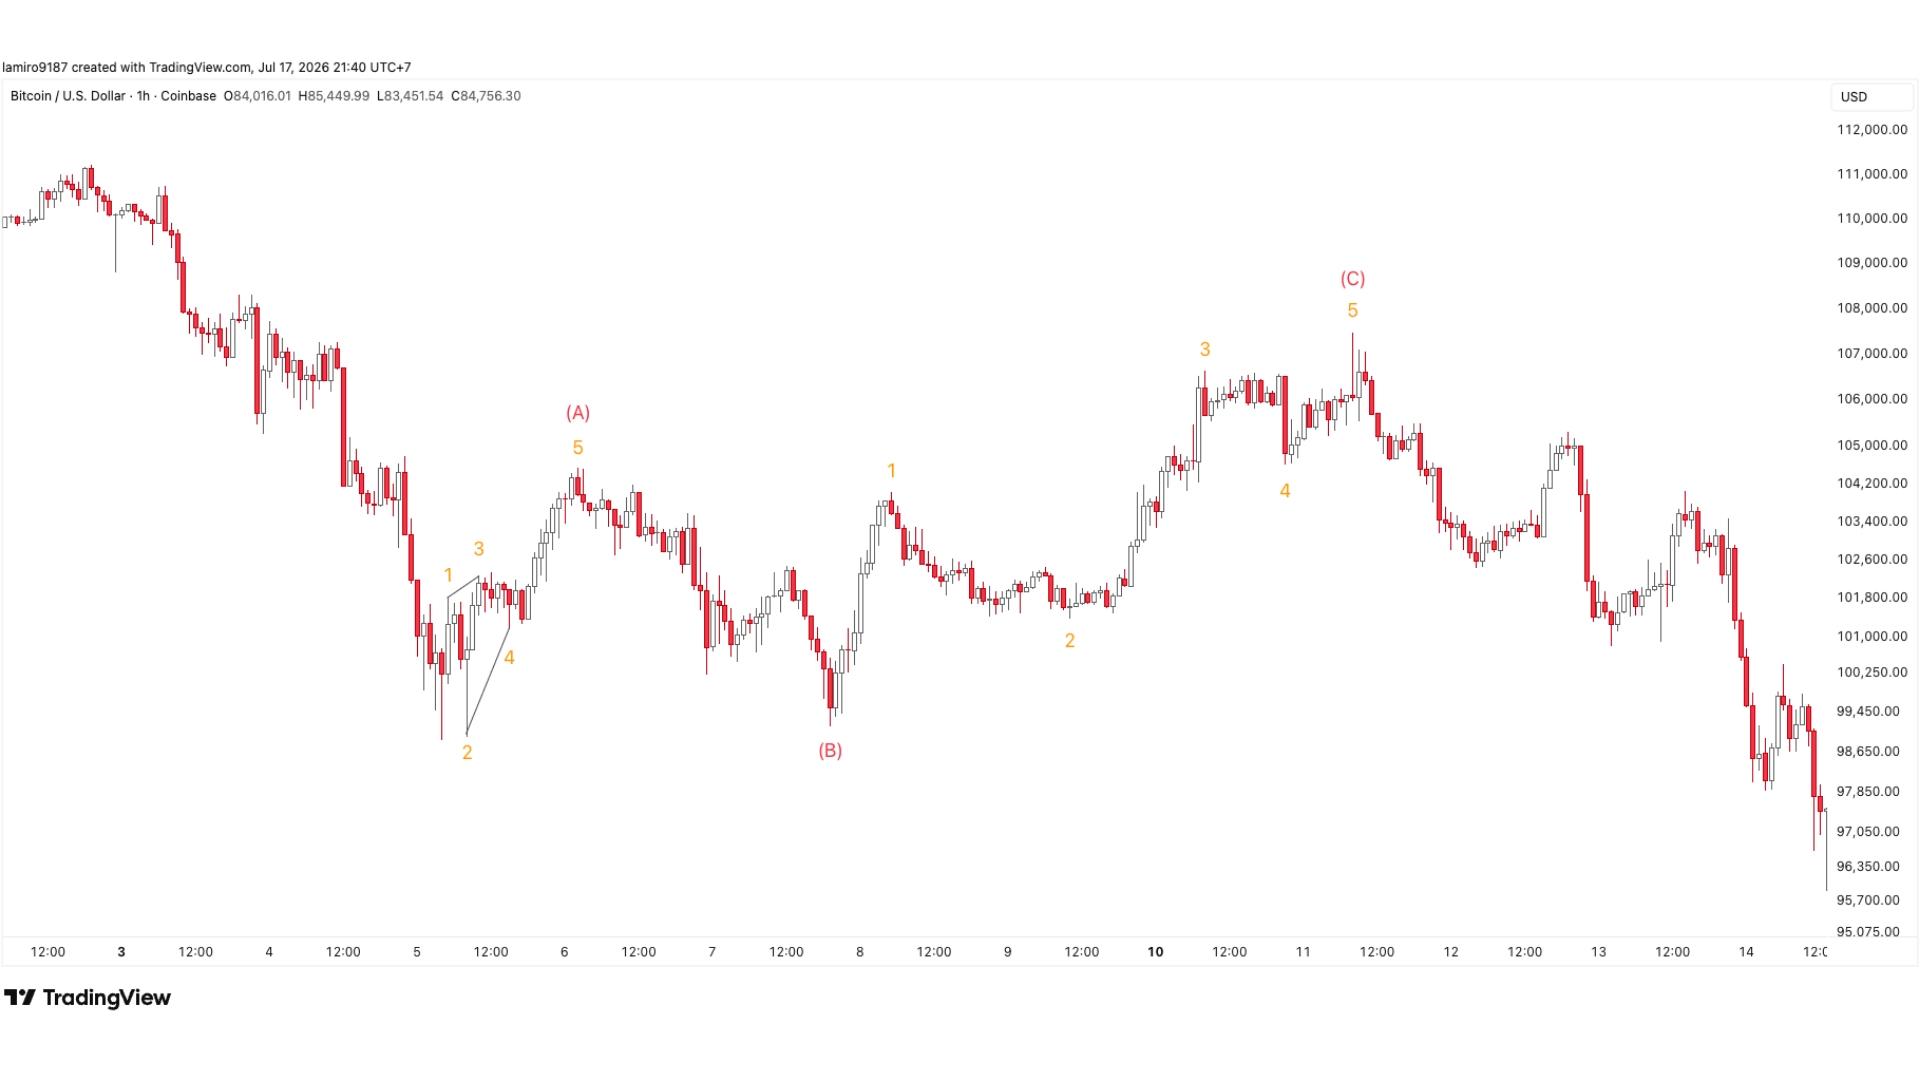 Figure 4: Identifying the zigzag wave with BTCUSDT
In the example in Figure 4, the Elliott zigzag wave pattern on the Bitcoin chart is a corrective wave within a downtrend. Wave (A) is a Leading Diagonal. Wave (B) is a wave consisting of 3 sub-waves. Wave (C) is an Impulse wave consisting of 5 sub-waves.
Identifying wave B in a zigzag
Wave B in a zigzag consists of 3 sub-waves at a smaller degree, which can be a sub-zigzag, a flat, or a triangle. We will learn these patterns in the later section.
The top of wave B lies clearly lower than the starting point of wave A in a bull market. As long as wave B has not erased all of wave A, the pattern still has the potential to be a zigzag.
Many Vietnamese documents state the figure that wave B retraces a maximum of 61.8% of the length of wave A. This figure does not come from Elliott's two source books but belongs to the guidelines of modern schools, including NEoWave. You can use it as a probability reference, but you should prioritize Elliott's qualitative criteria when labelling to avoid mistakenly eliminating a valid zigzag with a deep wave B retracement.
Identifying Wave C in a zigzag
Wave C in a zigzag is an impulse wave consisting of 5 sub-waves, which can be an Impulse or an Ending Diagonal.
Wave C almost always exceeds the end point of wave A. This is the typical sign confirming that the zigzag has completed a sharp correction of sufficient depth. When you see the third wave extend past the bottom of wave A in a bull market, it is highly likely the pattern is a standard zigzag.
The case where wave C does not exceed the end point of wave A is called a truncated wave C. This is a rare variant, similar to the truncation phenomenon in an impulse wave, and it signals unusually weak corrective pressure. You can review the mechanism of this truncation phenomenon in the article on truncated waves (truncation) to understand why it is often accompanied by a very strong underlying trend.
In which wave does a zigzag usually appear?
The zigzag appears most commonly in the wave 2 position of an impulse wave, and rarely appears in wave 4. In addition to the wave 2 position, you also encounter zigzags in the following positions:
- Wave A of a flat.
- Wave B of corrective patterns.
- Wave X connecting parts of a complex correction.
- Sub-waves inside a triangle.
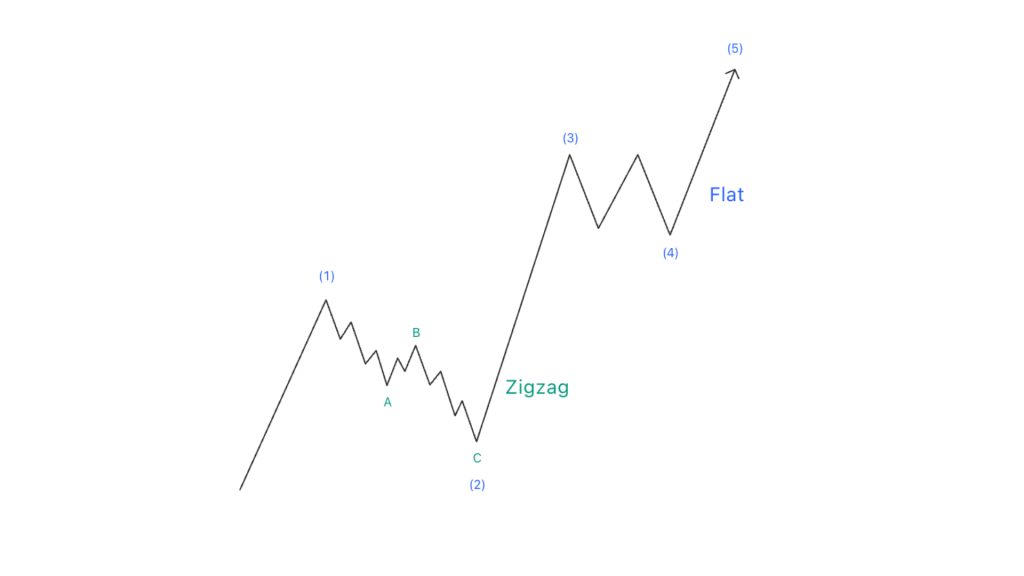 Figure 5: The zigzag wave pattern located in the wave 2 position within an Impulse wave
This distribution is tied to the rule of alternation. If wave 2 is a sharp correction in the form of a zigzag, then wave 4 is usually a sideways correction in the form of a flat or triangle, and vice versa. This rule helps you narrow down the scenario as soon as you first see wave 2. You can learn the full forecasting mechanism in the article on the rule of alternation.
Double Zigzag and Triple Zigzag: when one zigzag is not enough
Sometimes a zigzag repeats twice, or at most three times in a row. This phenomenon occurs when the first zigzag has not yet achieved the usual price objective of a correction. Each single zigzag is separated by an intervening "three" wave, forming a double zigzag or triple zigzag. These structures are similar to the extension phenomenon of an impulse wave, but less common.
W-X-Y (-X-Z) structure and wave X
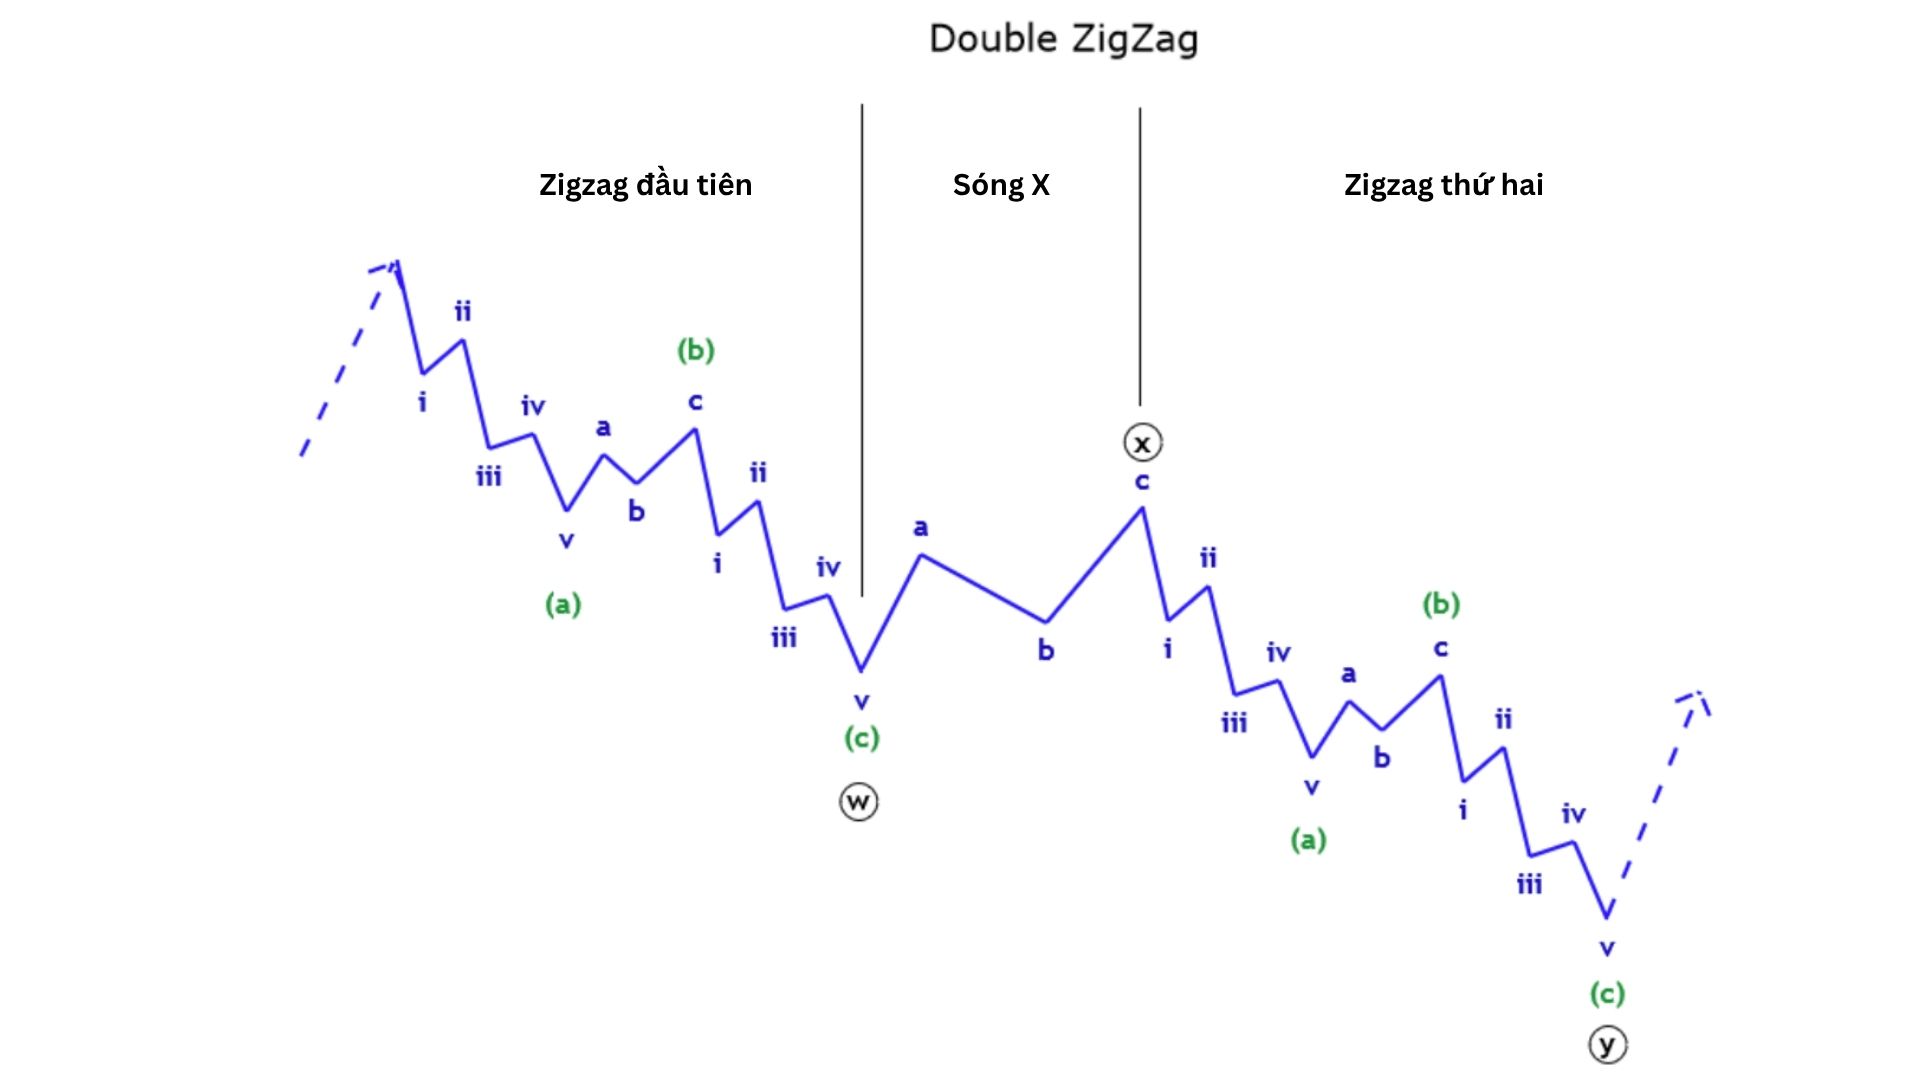 Figure 6: Double zigzag wave structure WXY
R.N. Elliott originally labelled a double zigzag as A-B-C-X-A-B-C, using the letter X for the connecting wave in the middle. This notation encounters a problem regarding wave degree: it implies the motive waves of each zigzag are only one degree smaller than the entire correction, while in reality they are two degrees smaller. Prechter corrected this error with a more accurate notation, counting the entire pattern as W-X-Y (and -X-Z if it is a triple):
- Wave W: the first zigzag in the correction.
- Wave Y: the second zigzag.
- Wave Z: the third zigzag, appearing only in a triple zigzag.
- Wave X: the reactive wave connecting the zigzags, always corrective in nature, often another zigzag running against the direction of wave W.
This subtle point about degree is what many popular documents overlook. The article on wave X goes deeper into the role of the connecting wave in combination corrections.
How is a double zigzag different from a single zigzag?
The core difference lies in the reason for formation and the number of waves:
- A single zigzag completes when a three-wave correction has reached sufficient depth in price. The pattern has three waves.
- A double zigzag appears when the first zigzag leg has not yet created a commensurate price retracement, so the market needs an additional second zigzag. The pattern expands to seven waves when counting the connecting wave X in between.
Doubling the pattern is mainly intended to complete the corrective depth in price. This is also why, when counting waves, a sequence of seven or eleven waves with much overlap is often a sign of a complex correction rather than an impulse wave. You use this characteristic to quickly distinguish the two types of movement.
Trading with a zigzag: the best opportunity is wave C
Wave C is the most attractive trading point in a zigzag. The reason is very clear in structural terms: after wave A completes 5 waves and wave B completes 3 waves, wave C will unfold a 5-wave sequence in the anticipated direction. When you recognize that the first two legs have taken shape, the direction of the third leg becomes high probability.
Kennedy's cautious method (author of Visual Guide to Elliott Wave) is to wait for confirmation from price action rather than guessing tops and bottoms. With a zigzag, a cautious entry method consists of three steps:
- Condition: wait for price to create a 5-wave movement to complete wave C (using the guideline that wave C is equivalent to wave A as the main benchmark).
- The entry point depends on the position of wave 4:
- If the sub-wave 4 within wave C lies outside the wave (A) area → Enter when price turns and exceeds the extreme of wave B.
- If the sub-wave 4 within wave C belongs to the wave (A) area → Enter when price turns and exceeds the extreme of wave 4.
- Stop-loss order: referenced at the extreme of wave C.
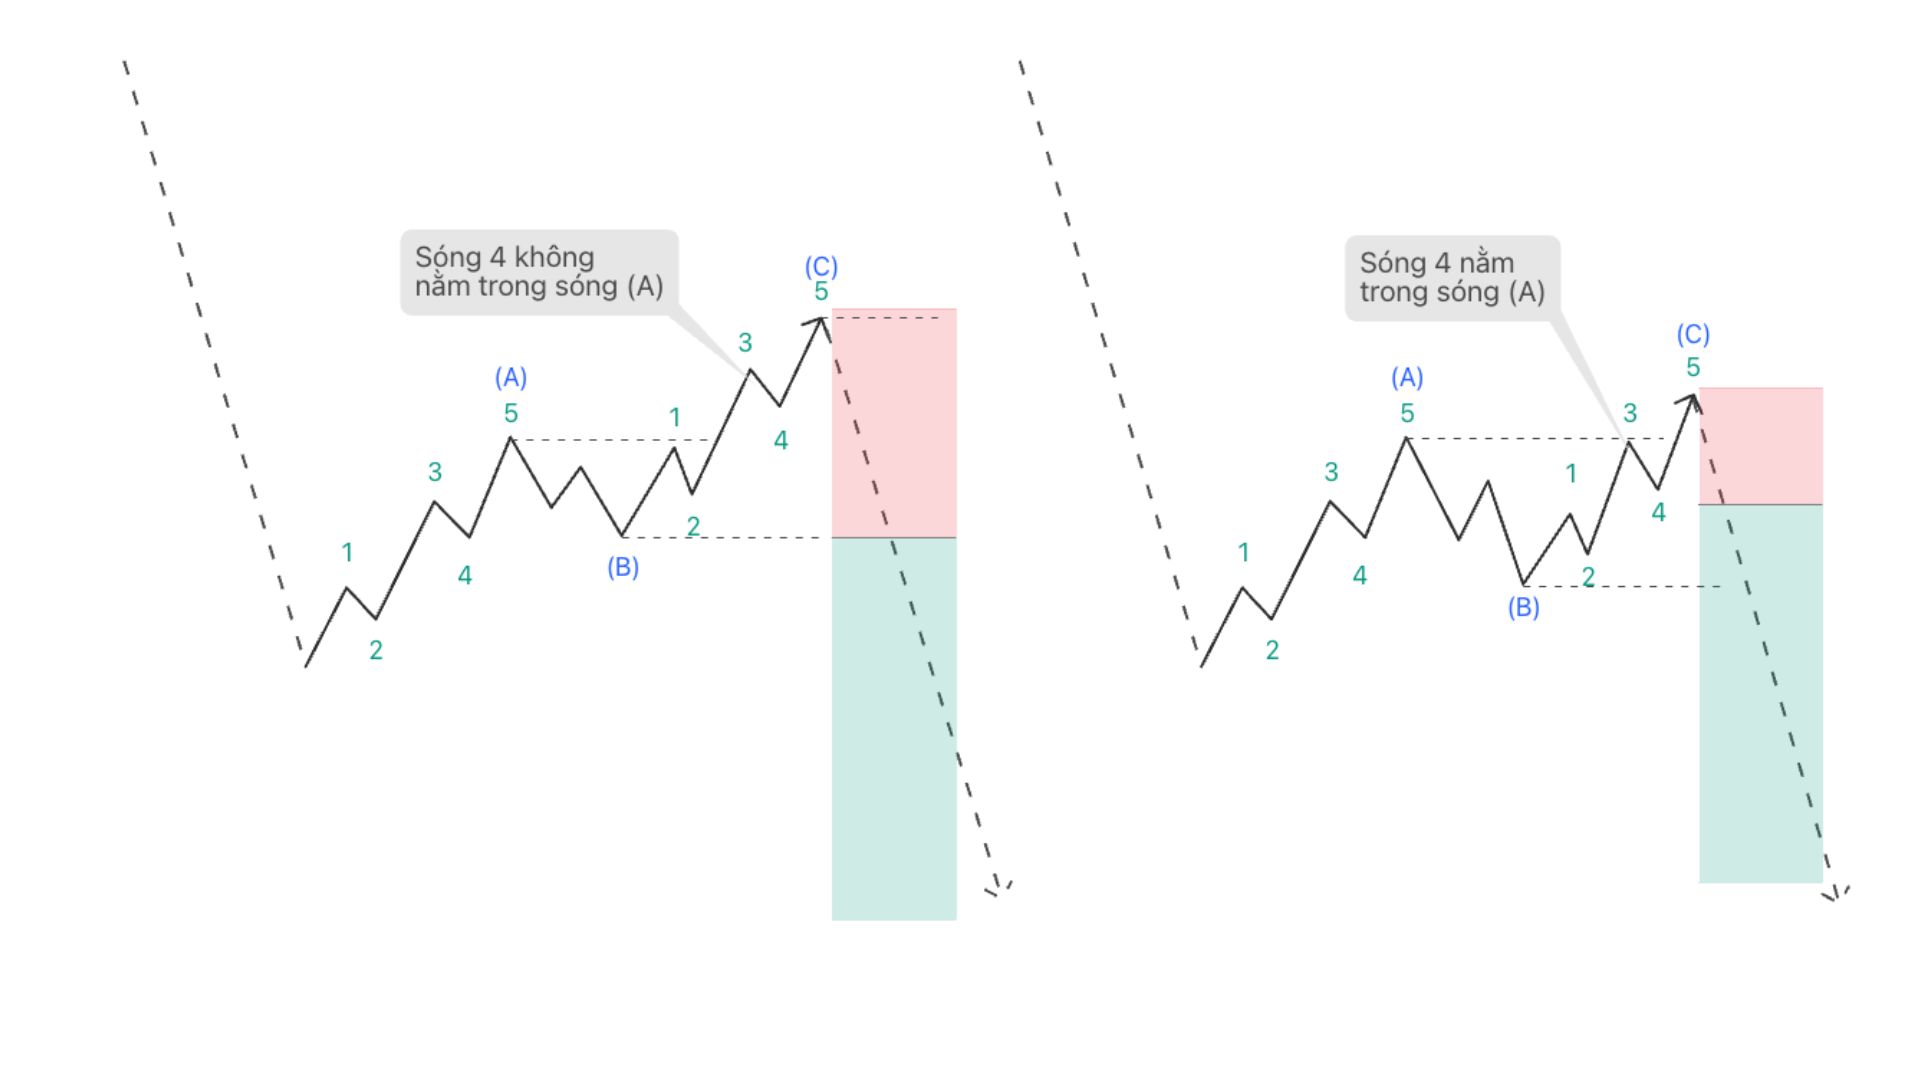 Trading when price exceeds wave B in a zigzag
Frequently asked questions about Elliott zigzag waves
What is wave X in a double zigzag?
Wave X is the connecting wave lying between two zigzags in a double zigzag, or between the parts of a triple zigzag. It is always a corrective wave, runs against the direction of the first zigzag, wave W, and often takes the form of a zigzag. The role of wave X is to link single zigzags into a larger correction.
Does a zigzag appear in wave 4?
Yes, but it rarely occurs. Zigzags appear commonly in the wave 2 position. The reason is the rule of alternation: if wave 2 was already a sharp correction in the form of a zigzag, then wave 4 tends to switch to a sideways form such as a flat or triangle. When you see wave 2 is a zigzag, prioritize waiting for a sideways correction in wave 4. The case where both are zigzags exists but is not the default scenario.
How long is wave C usually compared to wave A?
The most widely used guideline is that wave C is equivalent to wave A in price length, i.e. an equality relationship. In live trading, Wayne Gorman uses precisely the benchmark of wave C equalling wave A as the price target for T-Bond trading. Other commonly encountered Fibonacci relationships range from 0.618 to 1.618 times wave A, depending on the degree of extension of wave C. You should use these benchmarks as reference target zones and combine them with price channels, rather than clinging to one absolute figure.
Is a triple zigzag rare?
Yes, a triple zigzag is clearly rarer than a double zigzag. Elliott recorded that a zigzag repeats at most three times, and this three-time case rarely occurs in practice. The reason is that each replication of a zigzag only occurs when the preceding leg has not yet reached its price objective, and the market rarely needs three times to complete a sharp correction. When you encounter a sequence resembling three consecutive zigzags, you should carefully check the wave degree and the possibility that it is another form of combination correction.
How should you trade when you encounter a zigzag?
You should trade when wave C completes, because while wave A is forming, you do not yet have enough context to confirm whether it is the first leg of a zigzag or another pattern. By wave C, you have already seen wave A with 5 waves and wave B with 3 waves, so the direction and 5-wave structure of wave C are easier to forecast. Both wave A and wave C run in the same direction as the corrective trend so both are motive waves, but wave C gives a clearer confirmation signal and a more specific stop-loss reference point.
Rate this article
Read structure 10x faster with JUKA
JUKA maps SMC structure — swings, BOS, CHoCH and inducement zones — automatically on any TradingView chart. No more hand-drawing structure for hours.
Get JUKA — $150