Judas Swing in ICT: How to Trade It
What Is a Judas Swing in ICT?
In the ICT method, a Judas Swing is a false move at a specific time, intended to deceive retail traders into believing that price will continue moving in one direction, after which the market reverses and they are trapped.
"Judas" is a word implying "the traitor"; in essence this is Smart Money's act of psychological manipulation of traders.
Characteristics of the ICT Judas Swing
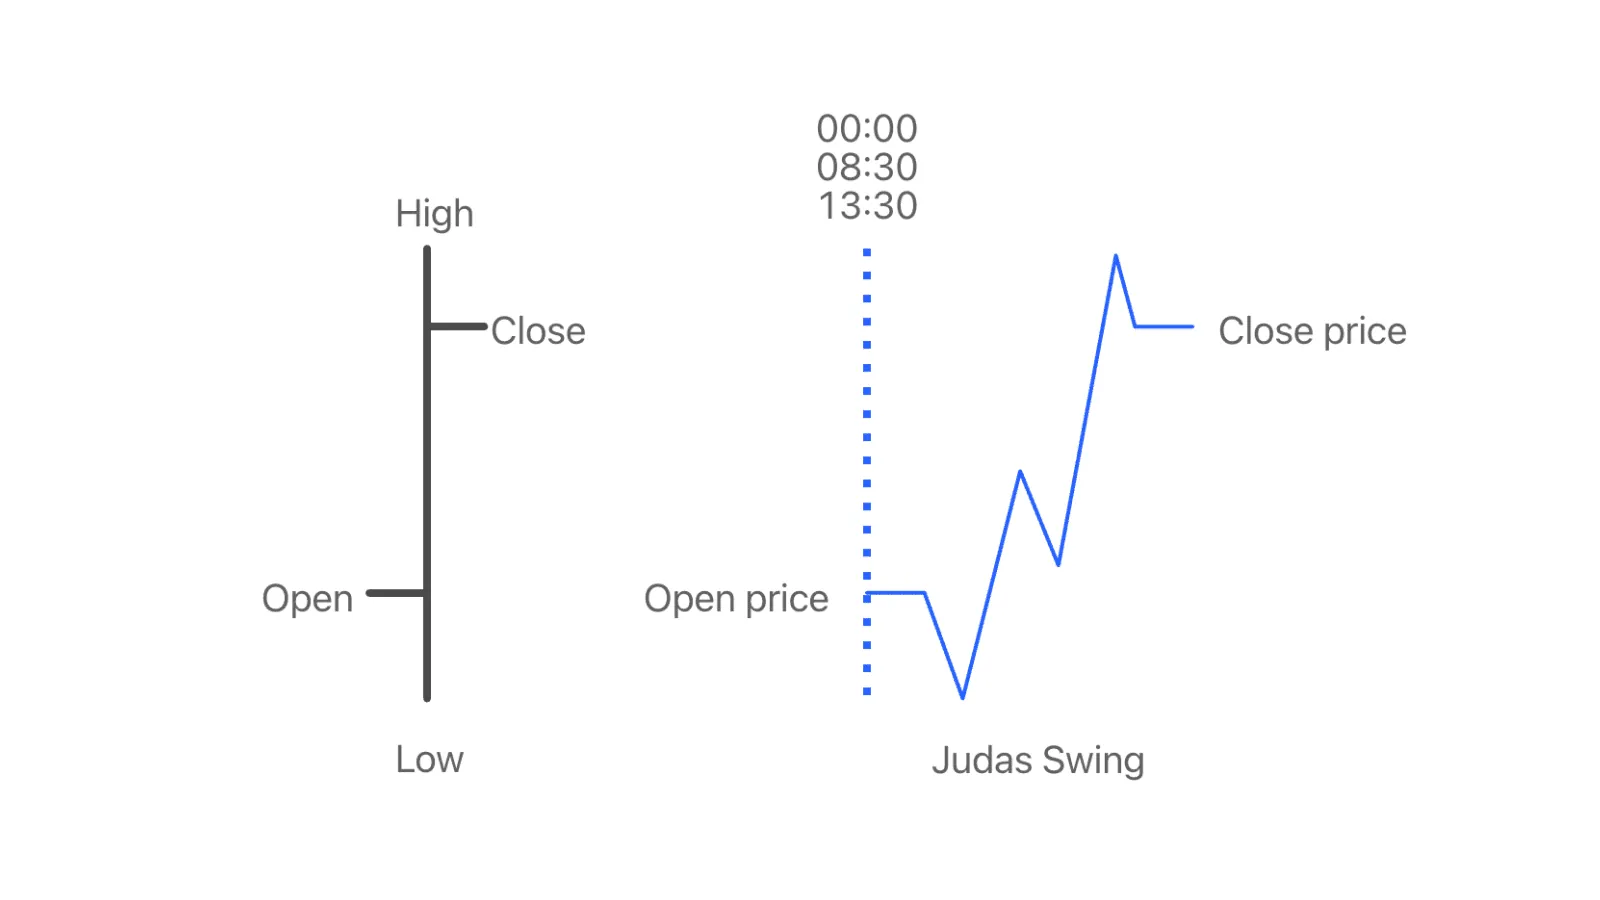
A Judas Swing is not a price pattern but a time-based event, usually appearing at 9:30 AM, 1:30 PM, and after 00:00 AM.
 Judas Swing in ICT
In a bullish structure, an ICT Judas Swing is a fast and strong move (displacement) down below the opening price, making retail think price will continue to fall and sell.
Then price comes back up, sweeping all the sellers' stop-losses.
Similarly, in a bearish structure, an ICT Judas Swing is a displacement up above the opening price, making retail think price will move in a bullish direction and buy in.
In reality, that is a price trap; the market will reverse and sweep the stop-losses of the buyers because they trusted that rise.
When a Judas Swing forms, it is basically a move that usually occurs at:
- An important support or resistance level
- A previous high or low
- A counter-trend pullback to form an OTE
- A sweep of the previous week's high or low
- A sweep of the previous session's high or low
- A sweep of intraday highs and lows
How to Trade with the ICT Judas Swing
London Judas Swing
 What is a London Judas Swing
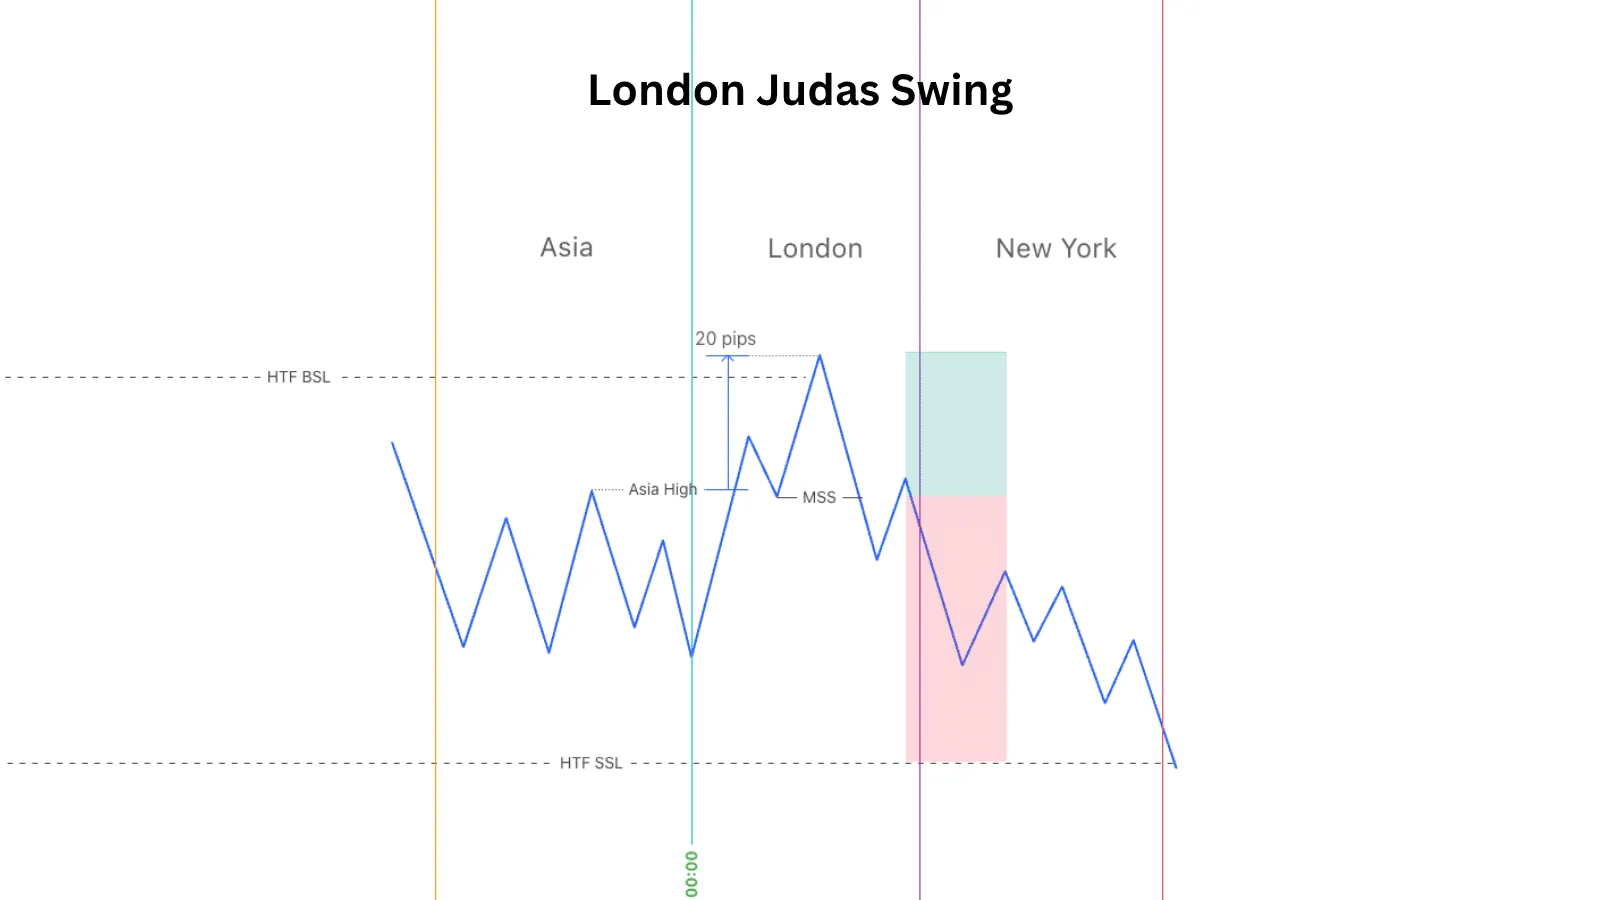
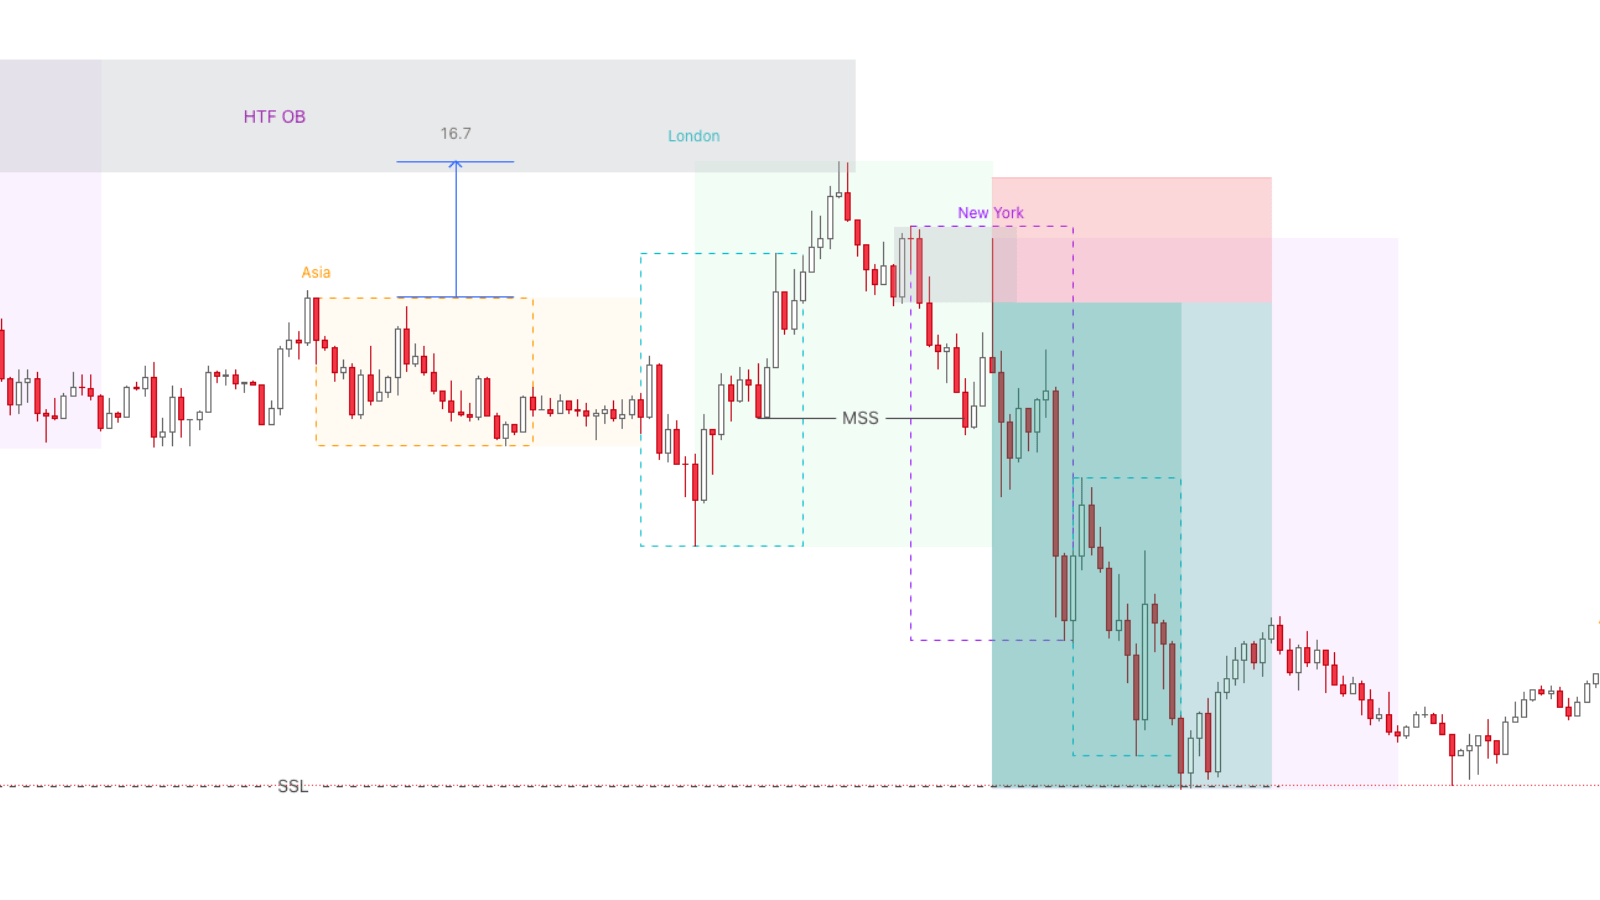
If trading after the London session opens, look for the price area where the Asian session moved sideways, and pay attention to the Asian session's stop-loss levels being swept.
After the Midnight Open at 00:00 AM, observe the strong rise/fall that breaks out of the Asian session and draws traders into trades.
Wait for a sweep of the Asian session high/low by about 10–30 pips, after which price reverses to create the London session's high/low of the day.
 Example of a London session Judas Swing
This setup is equivalent to the Intraday Profile in Part 8: CBDR.
New York Judas Swing
In the New York session, the trading window is from 9:30 – 10:00 AM. This is when the US stock market opens, causing indices and currency pairs to be affected.
First, note that when there is important high-impact news at 8:30 AM, there will be no Judas Swing at 9:30 AM.
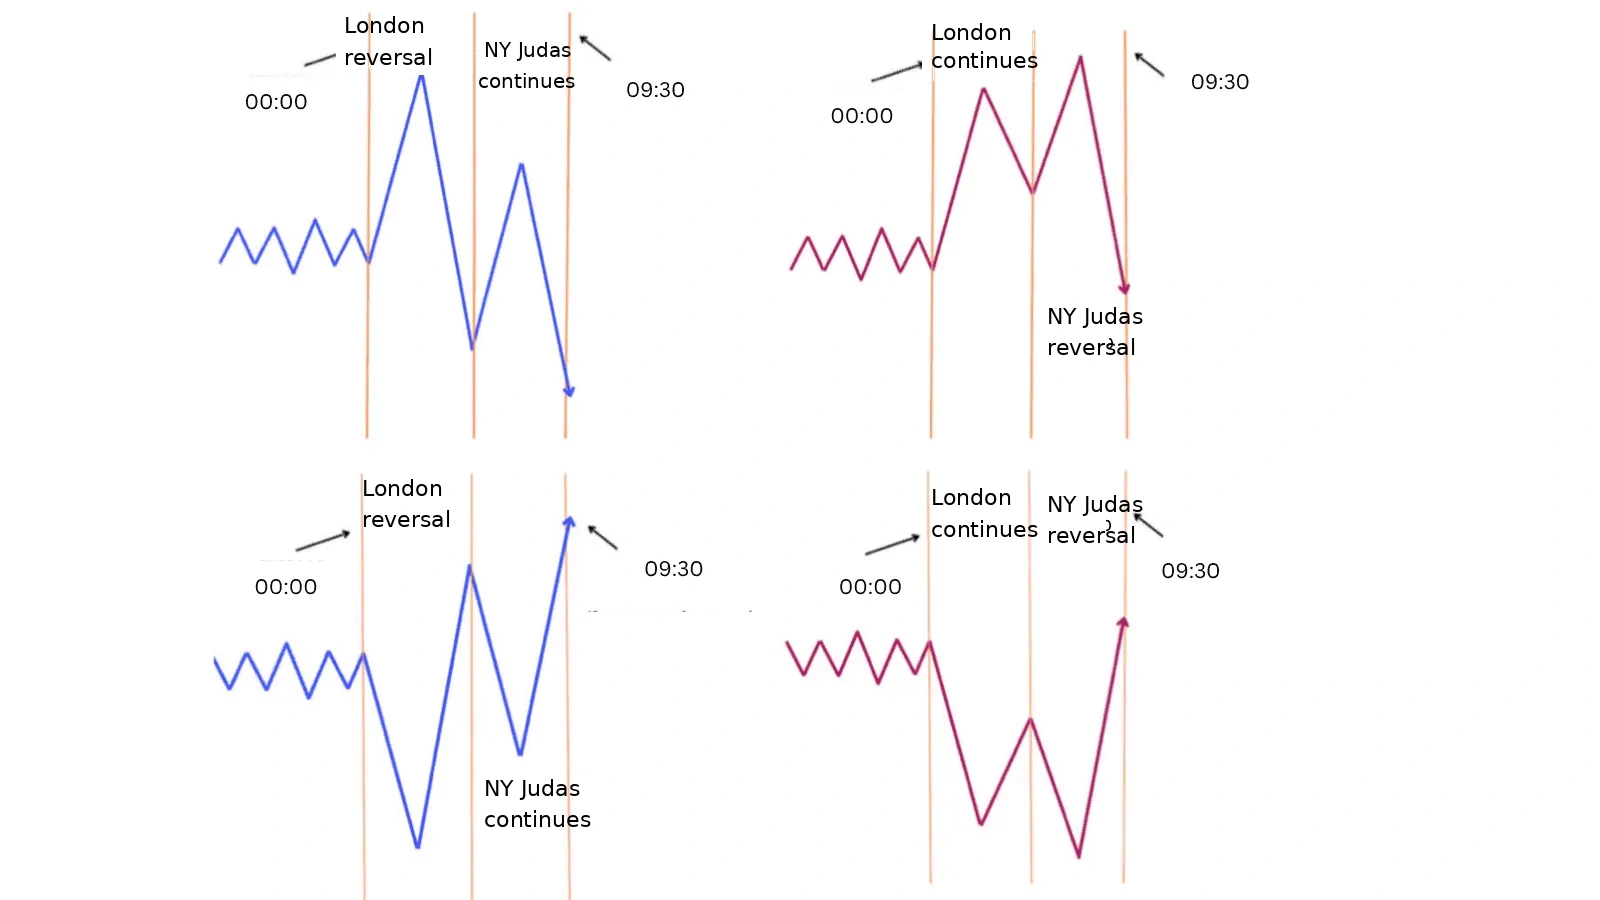
After the Midnight Open at 00:00, observe the London session:
- If London reverses, the New York Judas Swing is a continuation.
- If London continues, the New York Judas Swing is a reversal.
 New York Judas Swing diagram
When entering the New York session, based on the timing of the news we have two scenarios to anticipate:
Scenario 1: A Judas Swing occurs at 9:30 AM.
As mentioned earlier, a Judas Swing is a false move, so after liquidity is swept, we want to see price reverse right at that point.
Identify a PD Array to find an entry on the m15 timeframe, then look for BSL/SSL before the index opens at 9:30 AM.
Scenario 2: only applies when there is news released at 10:00 AM.
When news is scheduled for 10:00 AM, we do not expect there to be a Judas Swing at 9:30 AM.
Instead, wait during 10:00 – 10:10 AM for liquidity to be swept, forming a Judas Swing, followed by an immediate reversal.
Usually, our target is the liquidity level in the opposite direction.
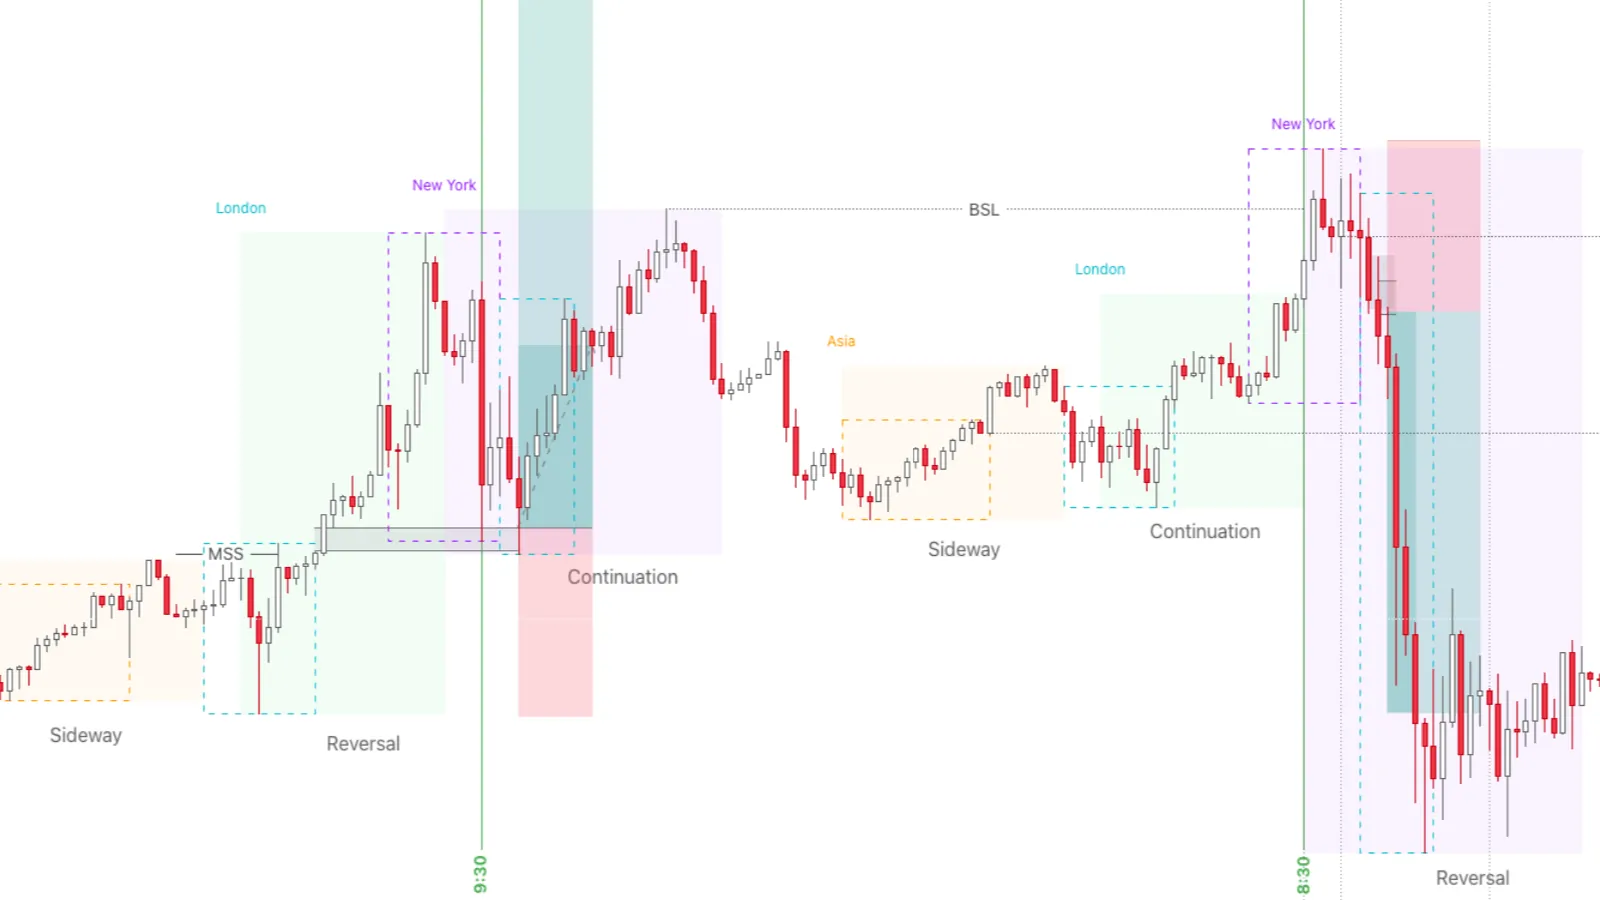 Example of a New York session Judas Swing
In the example above, we have two trading days on the m15 timeframe:
- On the first day, the Asian session moves sideways, the London session reverses and the New York session continues. We wait after 9:30 for manipulation to enter a Long trade.
- On the second day, the Asian session moves sideways, the London session continues, and the US session reverses. Because there was news at 8:30 and price had already taken BSL, we no longer wait for a Judas Swing at 9:30. Instead, we drop to m1 to find an entry.
1:30 Judas Swing
1:30 PM is an important time marker, usually coinciding with manipulation moves and the reversal phase in the New York session.
At the 1:30 time point, we will wait for certain conditions relating to the morning session (AM session), the 1:30 opening price, MSS, displacement, and so on.
All of the theory and examples of the 1:30 Judas are in the ICT 2023 PDF that Trading Hub 3.0 has compiled. Download the PDF in the documents section.
Stop Drawing Structure by Hand
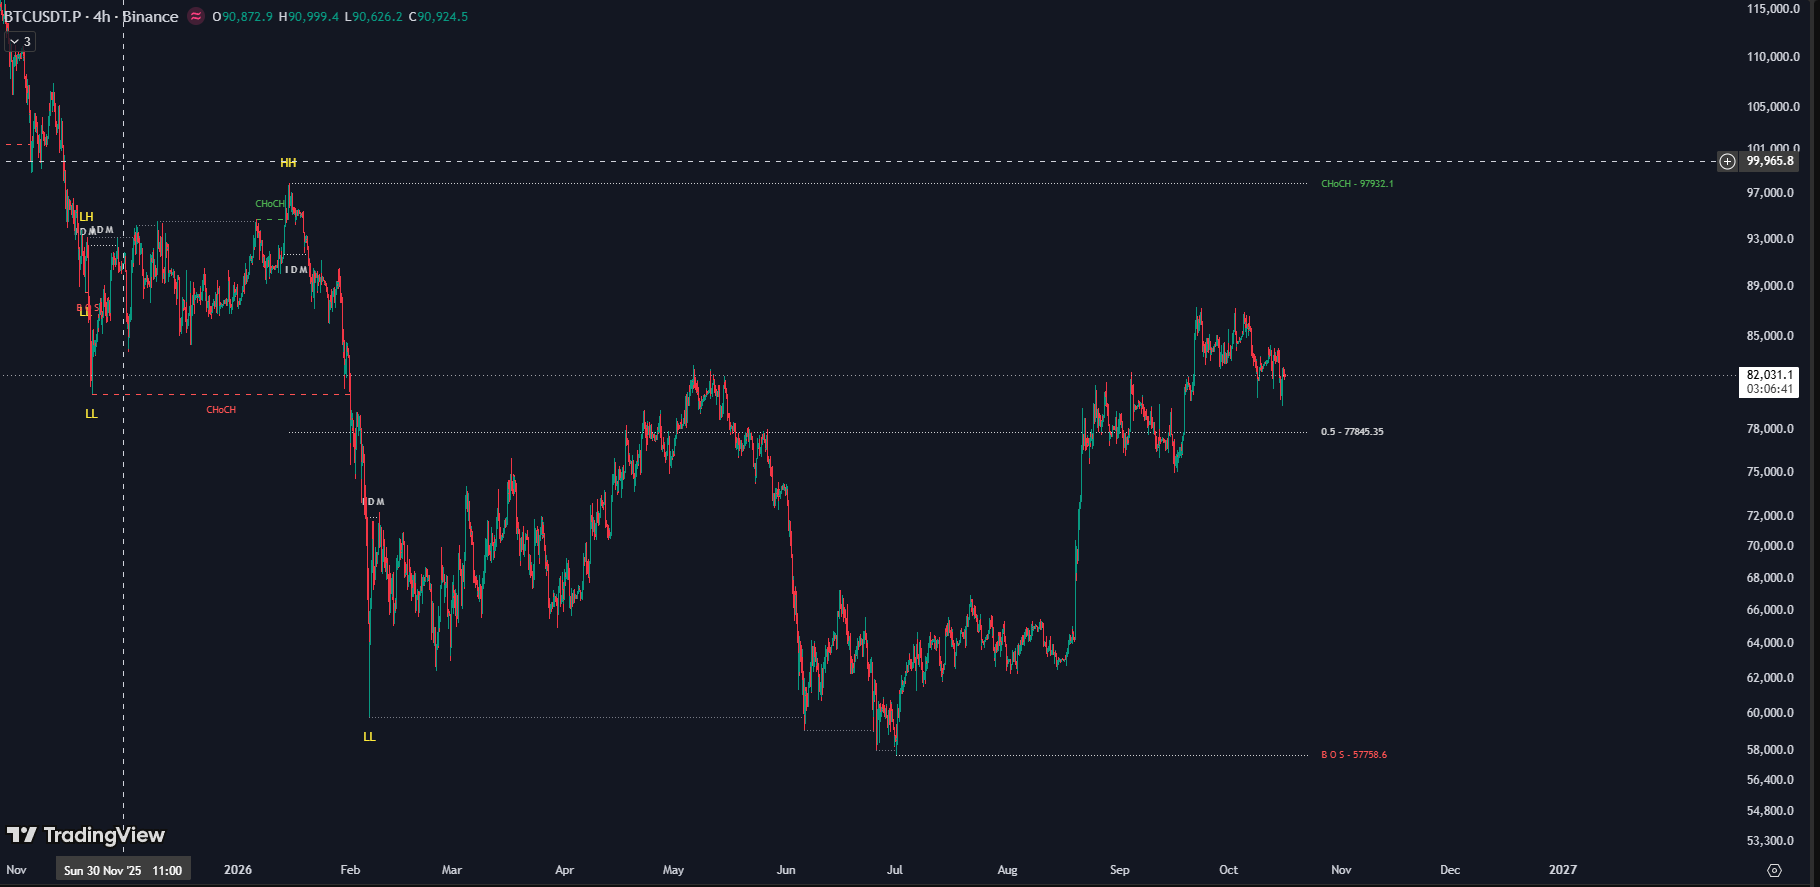
This is JUKA live on BTC 4H — every swing, BOS, CHoCH, IDM, and the premium/discount equilibrium labeled automatically, in real time.
No missed breaks. No mislabeled noise. No hours of hand-drawing. The complete Trading Hub 3.0 source code (Pine Script v5) — yours to own forever, $99 one-time. Or $50/year for invite-only access on TradingView.
Get JUKA Source Code — $99 Try JUKA on TradingView — $50/year