Lesson 4: What Is an Impulse Wave? The 3 Inviolable Rules and the 5-Wave Structure
Motive Wave in Elliott is the group of motive waves that move in the same direction as the larger trend, comprising two sub-forms: Impulse and Diagonal. In this lesson, Trading Hub 3.0 will take an in-depth look at the Elliott motive wave form known as the Impulse Wave.
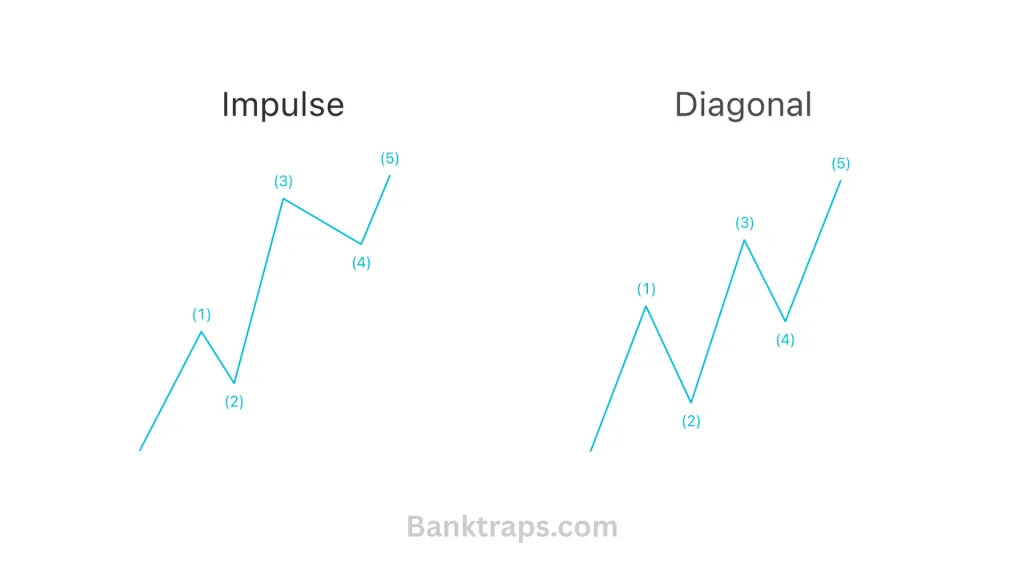 Figure 1: Motive waves have 2 forms: Impulse and Diagonal
What Is an Impulse Wave in Elliott Wave Theory?
An Impulse Wave in Elliott Wave theory is the most common and most powerful form of Motive Wave, with a structure of 5 sub-waves in a 5-3-5-3-5 pattern and compliance with 3 inviolable rules: wave 2 never retraces more than 100% of wave 1, wave 3 is never the shortest among the three action waves (1, 3 and 5), and wave 4 is never allowed to overlap into the price territory of wave 1.
Many analysis sites today use the shared term "motive wave" for both Impulse and Diagonal, making it easy for beginners to confuse two patterns that have very different trading implications. Every Impulse is a Motive Wave, but not every Motive Wave is an Impulse.
In addition, in most Impulse waves, an extension will usually appear, with amplitude and duration far exceeding those of the remaining waves.
The 5-3-5-3-5 Structure of the Impulse Wave
A complete impulse is always subdivided according to the formula 5-3-5-3-5.
- The three odd waves 1, 3, 5 play an action role, that is, they push price forward in line with the main trend, so they themselves are also motive waves and continue to subdivide into 5 sub-waves.
- The two even waves 2 and 4 play a reaction role, performing a temporary correction, so they subdivide into 3 sub-waves in a corrective pattern. One point to note carefully: among the three reaction waves, wave 3 in particular must be an impulse, not a diagonal.
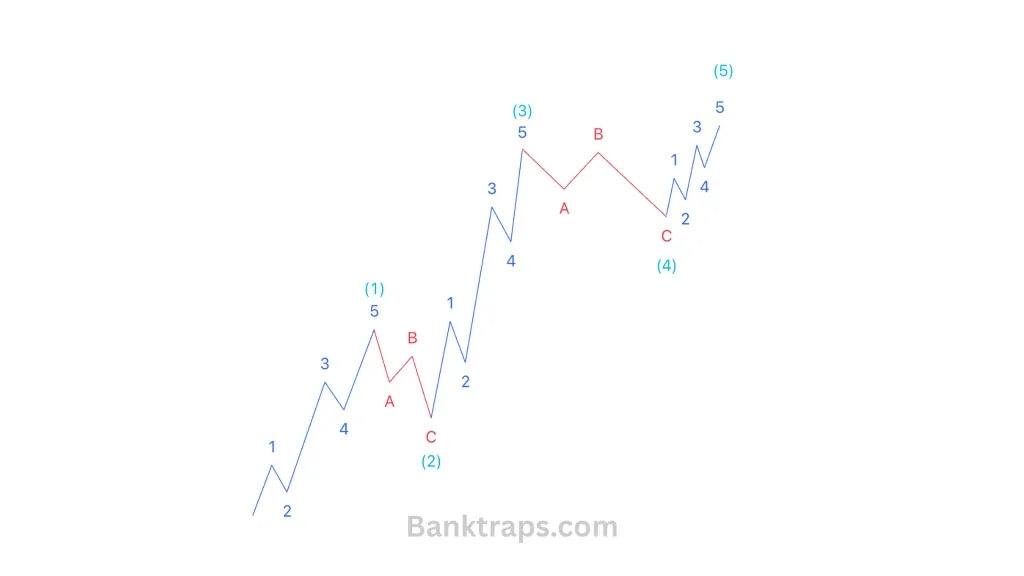 Figure 2: Diagram of the 5-3-5-3-5 structure of a complete impulse wave
The 3 Inviolable Rules of the Impulse Wave That Must Never Be Violated
There are two types of rules to remember when learning Elliott Wave: Rules and Guidelines. A Rule governs every wave of that type, with no exceptions. A Guideline is common behavior that tends to repeat but still has cases that differ.
The three mandatory rules of an impulse exist for a very specific reason: the goal of every motive wave is to create price movement in the direction of the wave at the larger degree. If one of the three rules is broken, the wave structure no longer guarantees that goal, and the wave label being assigned is certainly wrong.
Anyone who has counted waves through many market cycles will understand that most counting errors do not come from not knowing the rules, but from deliberately loosening a rule so that the wave label matches personal expectations. The three sections below are boundaries that should not be relaxed at will.
Rule 1: Wave 2 Must Not Retrace More Than 100% of Wave 1
Wave 2 never retraces beyond the starting point of wave 1. If price moves against the trend deeply enough to completely erase the entire length of wave 1, the "wave 2" label there is no longer valid and the entire wave count needs to be relabeled from scratch.
This is the easiest rule to check on a chart; you only need to compare the starting point of wave 1 with the endpoint of wave 2.
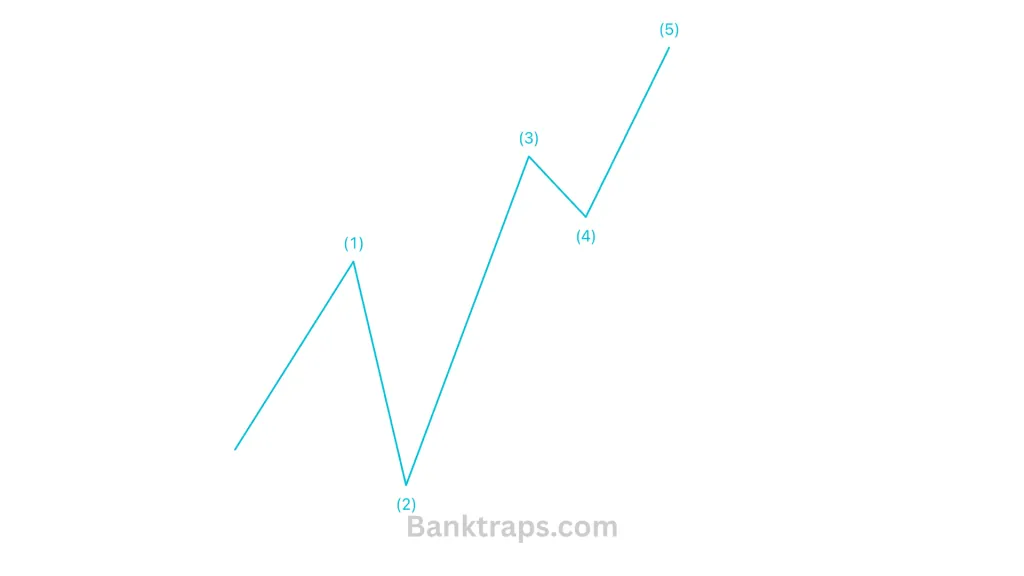 Figure 3: Violation of the rule that Wave 2 must not exceed the starting point of Wave 1
Rule 2: Wave 3 Is Never the Shortest Wave
Among the three action waves 1, 3 and 5, wave 3 is never allowed to be the wave with the shortest amplitude. This rule is often misread as "wave 3 is always the longest," whereas in essence it only requires that wave 3 not be the shortest; it is still entirely valid for wave 1 or wave 5 to be longer.
The condition for satisfying this rule is calculated by the percentage of price movement, not by the absolute number of points on the chart. In practice, the percentage difference almost always coincides with the difference calculated in absolute terms, so in most cases it can be checked quickly by eye without complex calculations.
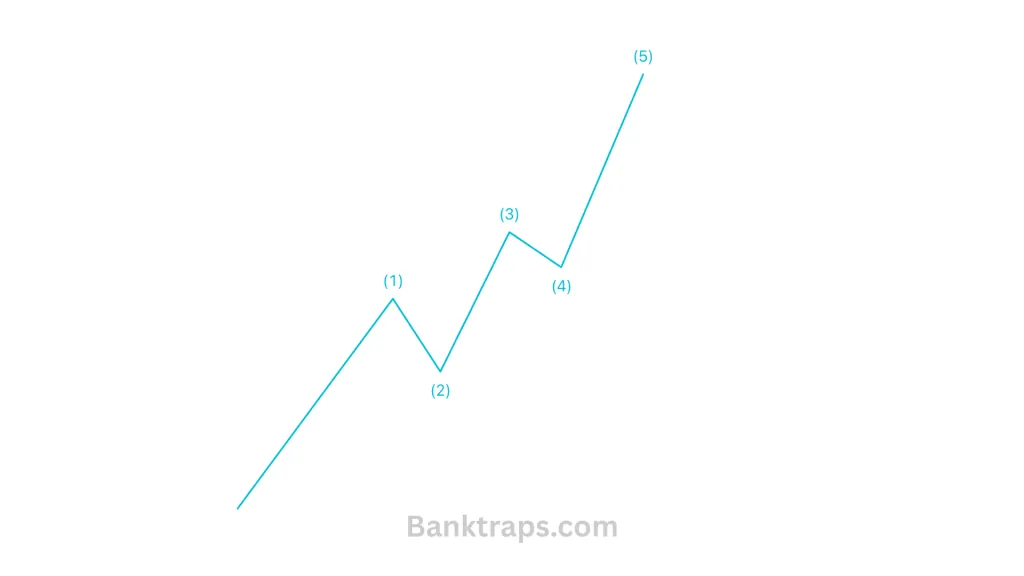 Figure 4: Violation of the rule that Wave 3 must not be the shortest wave
Rule 3: Wave 4 Must Not Overlap the Price Territory of Wave 1
Wave 4 must not enter the price territory formed by wave 1; this phenomenon is called overlap. The overlap rule applies to all unleveraged cash markets, and it is the most important boundary for distinguishing an Impulse from a Diagonal.
A rare exception exists in highly leveraged futures markets. Short-term intraday price fluctuations can sometimes create a technical overlap, but this phenomenon almost only occurs on very small timeframes and extremely rarely appears on the daily timeframe or higher.
When you see overlap appearing in a wave suspected to be wave 3 or wave 4, the correct reflex is not to ignore the rule, but to relabel the wave. The most common approach: consider the current "wave 3" label to actually be only the early stage of an extending wave 3 (extension), and the overlap is only an illusion caused by counting waves at a degree that is not detailed enough. This is an important practical skill, which will be explored in greater depth in the section on Extension and Truncation.
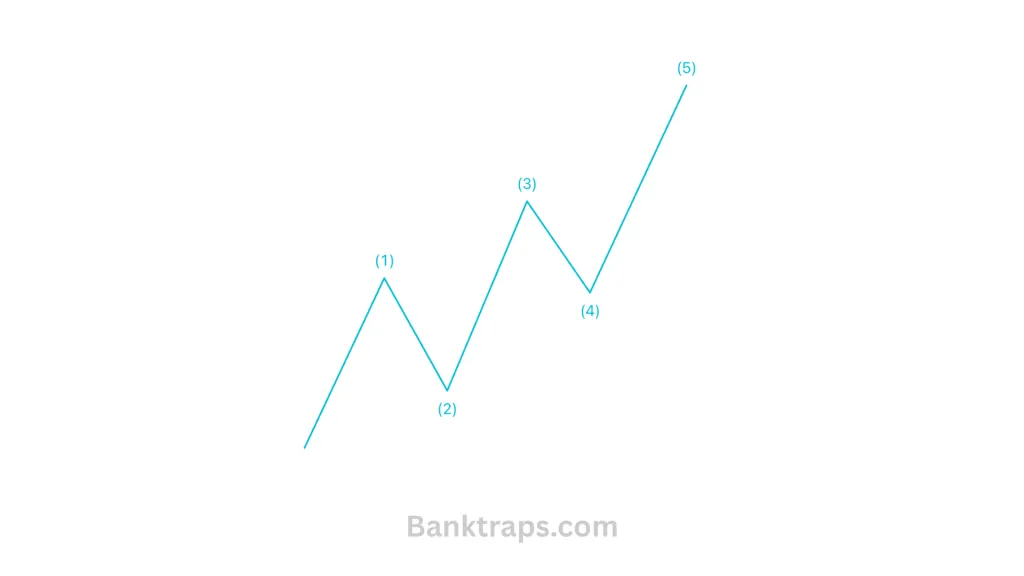 Figure 5: Violation of the rule that Wave 4 overlaps Wave 1
The three rules just presented are only the impulse application of the Rules and Guidelines framework. This entire system also includes many other guidelines such as Alternation, Equality and Depth of Correction, which apply to corrective waves as well, not just motive waves. See the full classification framework in the article Rules vs Guidelines: How to Avoid Miscounting Waves.
Basic Characteristics of Each Wave in the 1-2-3-4-5 Sequence
In addition to the three mandatory rules, each wave position in an impulse also carries a characteristic price behavior that helps identify where you stand in the cycle.
- Wave 1 initiates a new trend, usually accompanied by moderate volatility because the market has not yet confirmed a reversal.
- Wave 2 corrects wave 1 but does not break the original base, in accordance with Rule 1 above.
- Wave 3 is usually the longest and strongest wave in the sequence, often containing an Extension. A smaller wave 3 within wave 3 is the strongest movement in the entire cycle.
- Wave 4 usually moves sideways, playing the role of building a base before entering the final wave.
- Wave 5 ends the impulse sequence; a Truncation can occur if it does not exceed the peak of wave 3.
The initial wave 1 and wave 2 phase is also called by the term "one-two, one-two," referring to the still-hesitant development before the market truly accelerates in the middle of wave 3. Correctly identifying the "one-two, one-two" phase helps avoid entering trades too early when the trend does not yet have sufficient momentum.
Price Channel (Channel) When an Impulse Wave Moves
Besides the 3 mandatory rules, an impulse also often moves inside a parallel price channel; this is a guideline, not a rule, so exceptions still exist. The basic way to construct a channel: after wave 3 ends, connect the end of wave 1 and the end of wave 3, then draw a parallel line through the end of wave 2. This parallel line gives an initial estimate of the ending area for wave 4.
A price channel is a supporting tool for estimating the ending area of wave 4 and wave 5, not a mandatory condition for confirming a correct wave count. The more detailed channeling technique is presented in full in the article Channeling: Predicting Price Movement with Wave Channels.
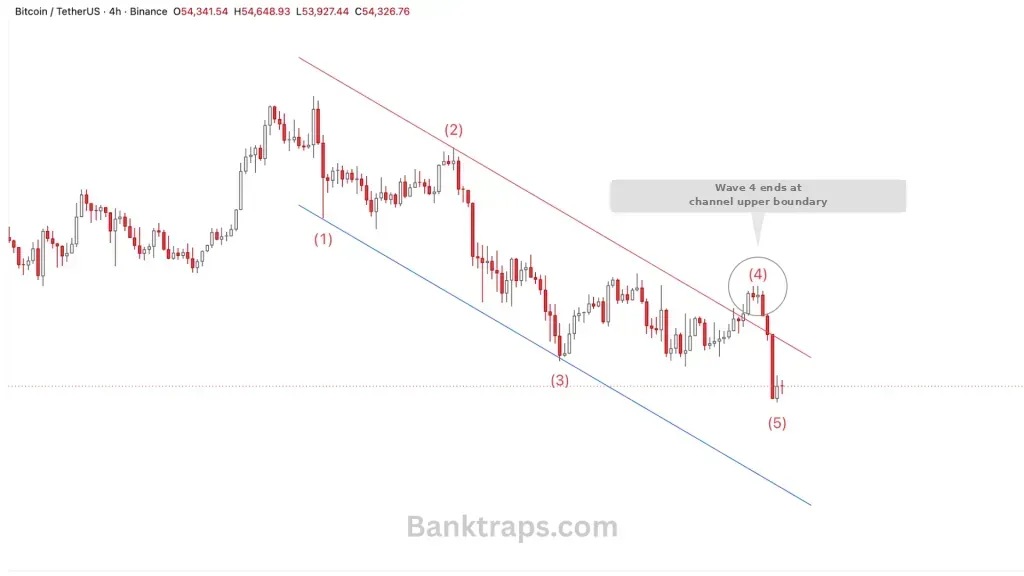 Figure 6: A parallel trend channel surrounding a sample impulse, constructed from the three landmark points of waves 1-2-3
In Figure 6, when a parallel price channel can be drawn through the 3 points 1-2-3, we predict that the ending point of wave 4 will occur when price touches the upper boundary line of the trend channel.
When Is a 5-Wave Sequence NOT an Impulse?
Not every 5-wave sequence seen on a chart is a standard impulse wave. There are two important variation situations that need to be distinguished to avoid miscounting.
First, when wave 4 overlaps wave 1 systematically, throughout the entire structure rather than as a momentary phenomenon, this is no longer an Impulse but has become a Diagonal. A Diagonal only appears in the position of wave 1, wave 5 or wave C, and carries a warning of trend weakening that is completely different from an ordinary impulse.
Second, when the structure contains an Extension in one of the three action waves, or ends with a truncated wave 5 (Truncation), the overall shape will look different from the "standard" impulse in textbooks, but it still fully complies with the 3 inviolable rules, so it still counts as a valid impulse. Learn more about these two variations in the articles Ending & Leading Diagonal and Extension, Truncation in Elliott Wave.
Frequently Asked Questions About Elliott Motive Waves
Why is wave 3 never the shortest wave among the 3 motive waves?
This rule exists because wave 3 is tied to the phase of strongest market consensus in the entire cycle. Technically, the condition only requires wave 3 to have a percentage movement greater than both wave 1 and wave 5; wave 1 or wave 5 can still be longer than wave 3 in absolute terms without violating the rule.
Are Motive Wave and Impulse Wave the same thing?
Not entirely. Motive Wave is a broader concept, comprising both Impulse and Diagonal. The Impulse Wave is the most common and strictest form of Motive Wave, complying with all 3 rules including the no-overlap rule. A Diagonal is also a Motive Wave but breaks mandatory rule 3, so the two terms cannot be used interchangeably.
Why Do Traders Still See Wave 4 Violating Into Wave 1?
If you see wave 4 violating into the price territory of wave 1, it is very likely a Diagonal rather than an Impulse, or you are labeling it incorrectly. The three rules of the Impulse Wave must be complied with, except in the very rare case of highly leveraged markets. In that case, if it truly is an impulse wave pattern, you may be confusing the wave degree or incorrectly identifying a corrective wave. After learning about corrective wave forms, you will see that there are many cases that make you mistakenly think the overlap rule of the impulse wave has been violated.
Academic reference source: Elliott Wave International — Introduction to the Wave Principle, based on the original Elliott Wave Principle by Robert Prechter and A.J. Frost.
Rate this article
Read structure 10x faster with JUKA
JUKA maps SMC structure — swings, BOS, CHoCH and inducement zones — automatically on any TradingView chart. No more hand-drawing structure for hours.
Get JUKA — $150