SMC Top-Down Analysis: HTF Bias, LTF Entries
"Use multiple timeframes" is some of the most repeated — and most misapplied — advice in trading. Most traders respond by opening five charts, marking structure on all of them, and ending up with five conflicting biases. The top-down method in Smart Money Concepts is simpler than that, and stricter: each timeframe has exactly one job. The higher timeframe decides direction. The lower timeframe only refines the entry. Mix up those jobs and the method falls apart.
What top-down actually means
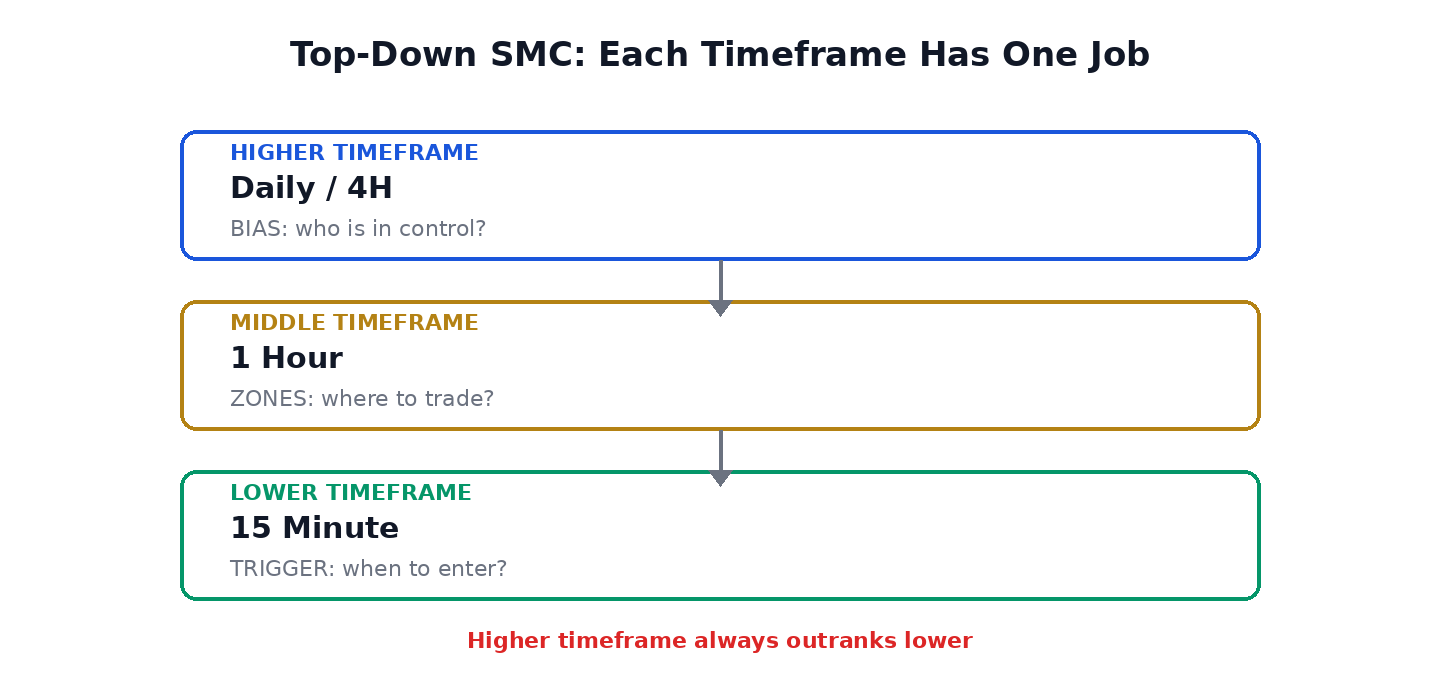
Top-down analysis runs from the big picture down to the trigger, in three layers:
- Higher timeframe (Daily / 4H) — bias. This is where you read external structure, mark BOS and CHoCH, and decide which side of the market you're on. Nothing below this layer is allowed to change that decision.
- Middle timeframe (1H) — zones. Once bias is set, drop down to locate where you'd actually want to trade: premium and discount areas of the HTF range, liquidity pools, imbalances.
- Lower timeframe (15M) — entry trigger. The final layer only answers when: a CHoCH or BOS on the LTF, in the direction of HTF bias, at your zone. That's the trigger — nothing more.
One timeframe for direction, one for location, one for timing. If a layer starts doing another layer's job, you're no longer doing top-down analysis — you're just collecting opinions.
What most traders get wrong
1. Using five or six timeframes. More charts don't mean more confluence — they mean more contradiction. You need one timeframe to define structure and one lower timeframe to refine entries. Everything beyond that is noise dressed up as analysis.
2. Skipping the higher timeframe entirely. Jumping straight to the 5-minute or 1-minute chart without checking HTF context is the fastest way to get chopped up. If the higher timeframe isn't aligned with your trade, the lower timeframe signal is swimming upstream.
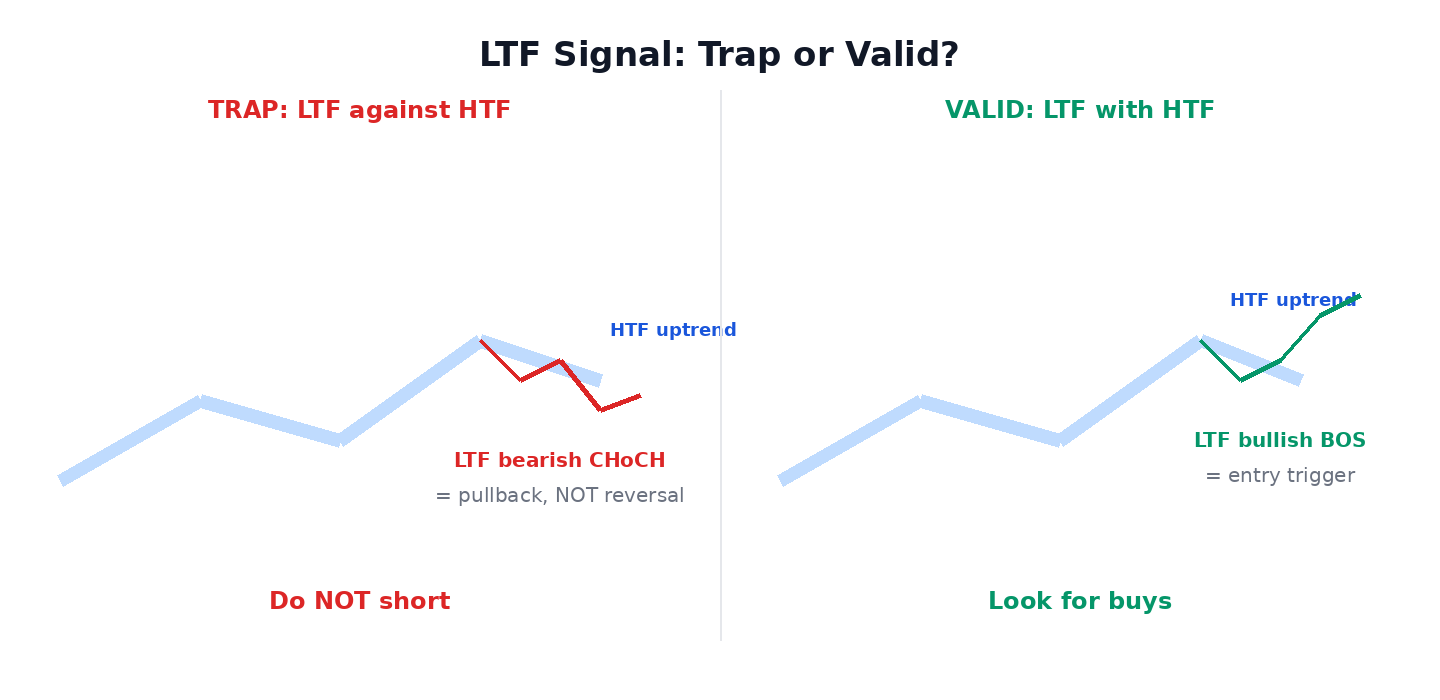
3. Taking bias from the lower timeframe. This is the big one. The HTF is in a clean uptrend; the 15-minute prints a bearish CHoCH; the trader flips bearish and shorts — directly into HTF demand. That LTF CHoCH wasn't a reversal. It was a pullback within the HTF trend. LTF structure is internal structure relative to the HTF, and internal structure never sets bias.
4. Trading every BOS and CHoCH as a setup. A structure break by itself is not a trade. Without context — HTF alignment, a real zone, displacement, liquidity — a break is just information. Traders who take every LTF break end up overtrading the noise between HTF levels.
5. Marking structure on every timeframe and "averaging" the bias. When the Daily says up and the 15-minute says down, there is no tie to break — the Daily wins, always. Higher timeframe structure outranks lower timeframe structure, no exceptions.
HTF: where bias comes from
On the Daily or 4H, do the full structure read: external highs and lows only, BOS for continuation, CHoCH for potential reversal, candle closes required. This read is the law for your trading session. Write it down if you have to: "Daily is bullish — I am only looking for buys today."
Also mark the HTF dealing range and its equilibrium. In a bullish HTF trend you want to buy in discount (below the 0.5); in a bearish trend you want to sell in premium (above the 0.5). Buying the top of a bullish range or shorting the bottom of a bearish one is how traders turn a correct bias into a losing trade.
MTF: where the zones are
Drop to the 1H with your bias locked in. You're not re-reading trend here — you're hunting location: resting liquidity above old highs or below old lows, fair value gaps left by HTF displacement, and the premium/discount subdivisions of the HTF range. Mark the zones where, if price arrives, you'd be interested. If price never arrives, there's no trade — patience is part of the method.
LTF: the trigger — and only the trigger
On the 15M, wait at your zone for confirmation in the HTF direction: a CHoCH flipping LTF structure toward your bias, or a BOS continuing it, ideally with displacement into the zone. The 15M is sharp enough for timing but — while you're learning — avoid the 5M, where noise makes clean structure nearly impossible.
The discipline that matters: the LTF can only confirm or deny an entry — it can never reverse your bias. A bearish LTF CHoCH while HTF is bullish doesn't make you bearish. It tells you the pullback is developing, and your buy setup may be approaching. Same signal, opposite conclusion — because the HTF has the final word.
BOS and CHoCH across timeframes
Think of it as two different weights:
- HTF BOS/CHoCH = the law. It decides who's in control of the bigger market. A HTF CHoCH is the only thing that changes your bias.
- LTF BOS/CHoCH = the entry signal. It only has value when it points the same way as the HTF. A LTF signal against HTF bias is a trap, not an opportunity.
This is why the most common losing pattern in SMC looks like this: trader sees a beautiful LTF CHoCH, takes it, and gets stopped — because the HTF was trending hard the other way and the "reversal" was just a pullback. The signal was real. The timeframe was wrong.
The workflow, start to finish
- HTF (Daily/4H): read external structure, set bias, mark the dealing range and premium/discount.
- Wait for price to reach discount (if bullish bias) or premium (if bearish bias).
- MTF (1H): refine the zone — liquidity, imbalance, order flow confluence.
- LTF (15M): wait for CHoCH/BOS confirmation in the direction of HTF bias.
- Enter at the refined zone (OTE, FVG), with invalidation below/above the LTF structure that confirmed you.
- Never take a LTF signal against HTF bias — no matter how clean it looks.
The checklist
- One timeframe defines structure and bias (HTF). One lower timeframe refines entries (LTF). That's enough.
- Higher timeframe structure always outranks lower timeframe structure.
- LTF signals only confirm entries — they never flip bias.
- A LTF CHoCH against HTF trend is a pullback, not a reversal.
- Buy discount in bullish HTF trends; sell premium in bearish ones.
- A break without HTF context, a zone, and displacement is not a trade.
Top-down isn't about seeing more — it's about giving each timeframe a single job and enforcing the hierarchy. Do that consistently and the charts stop arguing with each other.
Stop Drawing Structure by Hand
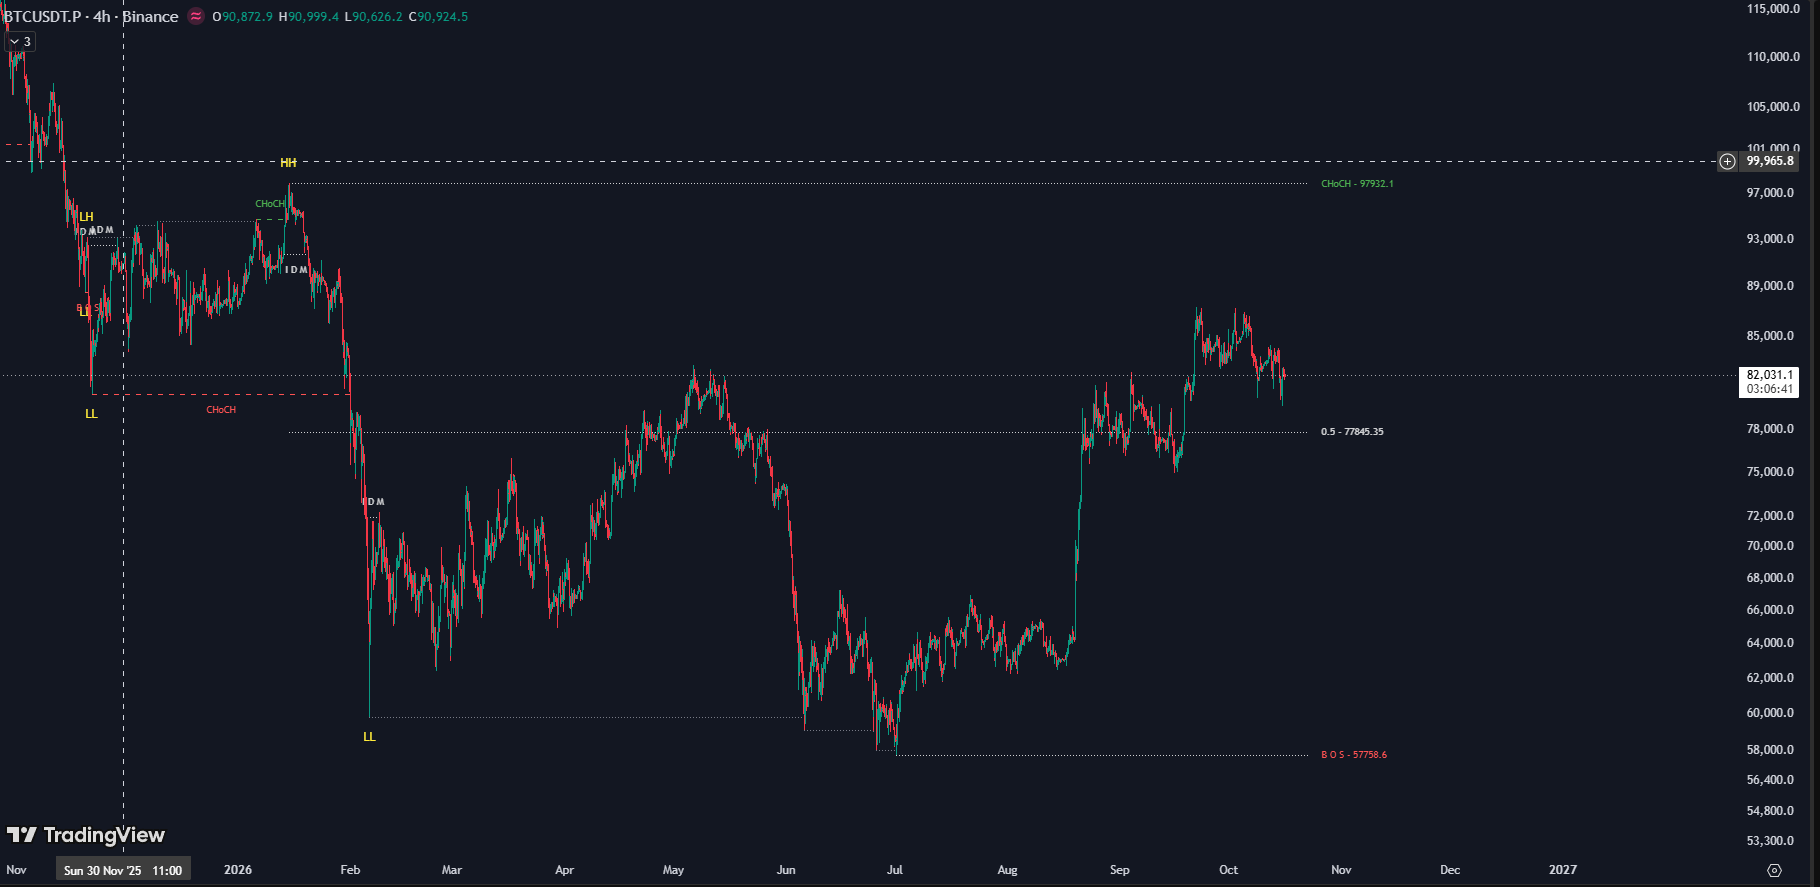
This is JUKA live on BTC 4H — every swing, BOS, CHoCH, IDM, and the premium/discount equilibrium labeled automatically, in real time.
No missed breaks. No mislabeled noise. No hours of hand-drawing. Full Pine Script v5 source code — yours to own forever, $150 one-time.
Get JUKA Source Code — $150