Trading Hub 4.0 (Part 3): Identifying the Flag Pattern Across Multiple Timeframes
In this article we will learn about the flag pattern and how to use it across timeframes.
The flag pattern
There are many different patterns such as head and shoulders, double tops, double bottoms, … but those are all reversal patterns.
Reversal patterns often easily lead to failure because of the traps created by the big players, and we truly do not know where the top and the bottom are.
Let us ignore them and just focus on continuation patterns, which is the flag pattern.
The flag pattern is formed from the up and down moves in a corrective wave; connecting the highs and lows together along trend lines, we have the flag pattern.
A flag appears after every impulsive wave, and after a flag appears the market produces the next impulsive wave again -> this is exactly the basis for finding an entry point. We enter at the breakout point of the flag, and take profit on the impulsive wave.
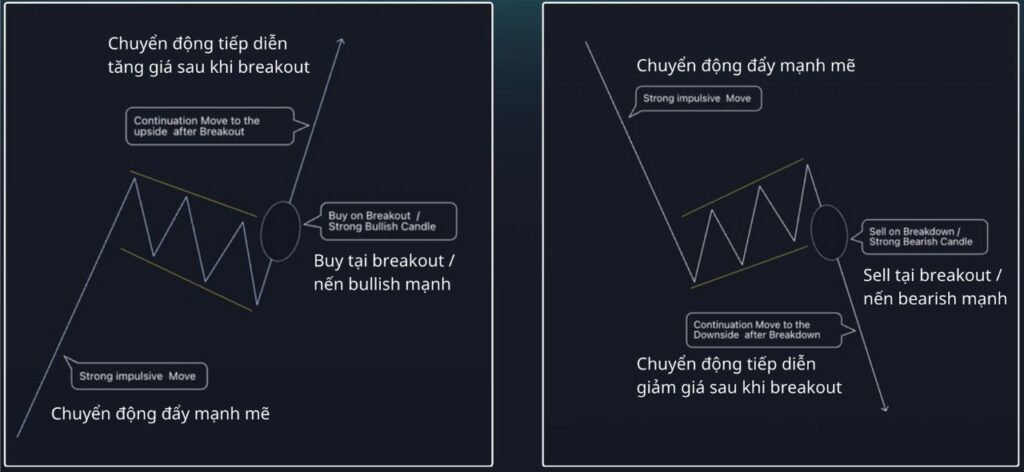 Entering at the flag
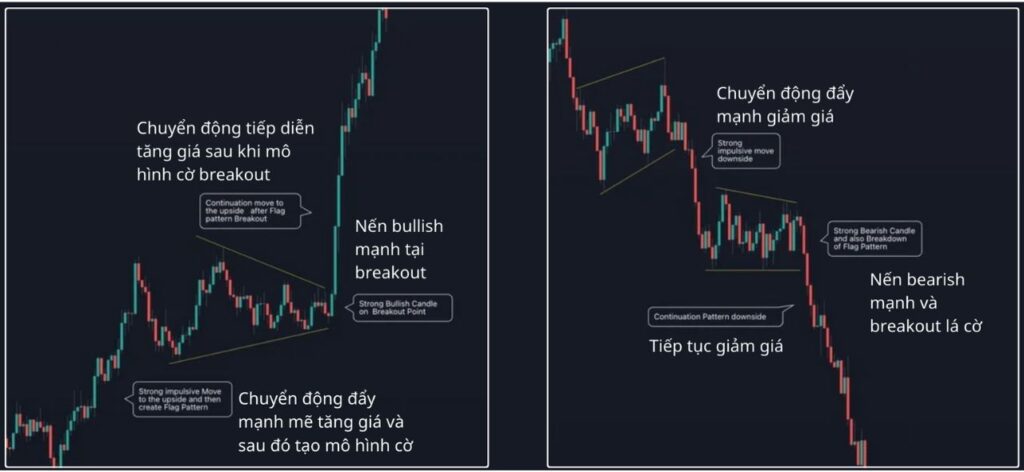 Screenshot 2024-08-08 at 00.50.11
Multi-timeframe analysis
If you have the time of a full day, you can use the m15, m30 or h1 timeframe. If you trade over several days, you can use the h4 timeframe. If you want to enter continuously, you can use the m5 timeframe.
However, if you are just starting out, limit trading on the m5 timeframe because of its strong volatility. Start with a larger timeframe and when everything goes according to plan, you can move down to a smaller timeframe.
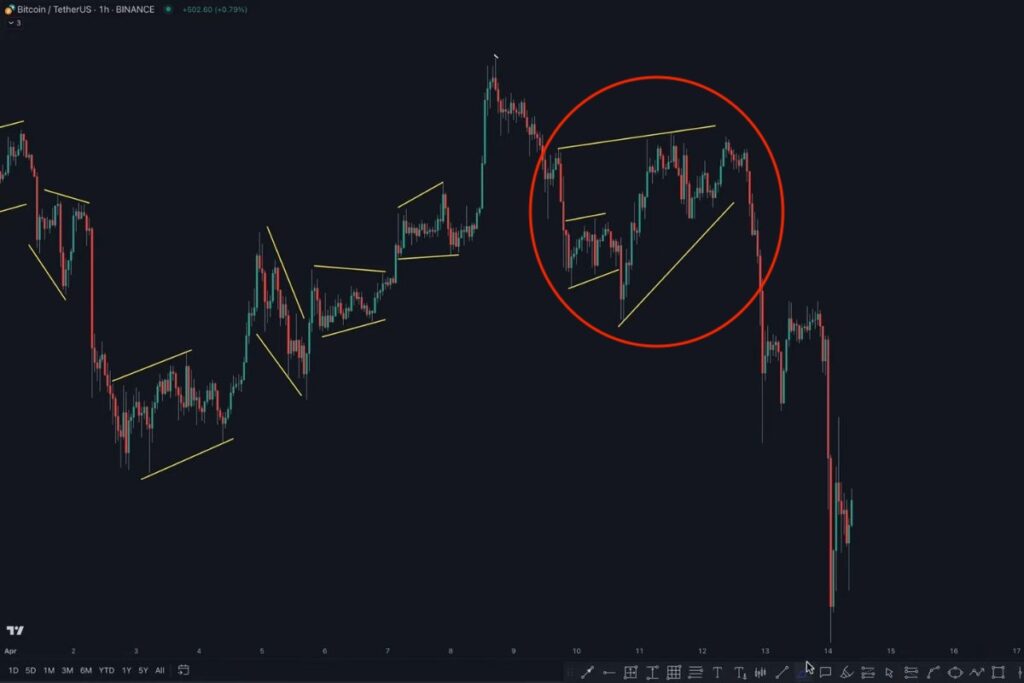 Trend continuation flag pattern
In the image above, the flags that appear are formed from the corrective moves that appear after an impulsive move.
After a flag appears, the market continues to go in the direction of the previous continuation trend again.
In the red circled area, there are 2 flags stacked on top of each other; if we enter according to the small flag inside, it is very likely that we will hit SL. The larger flag forms and the market continues to go in the direction of the previous downtrend again.
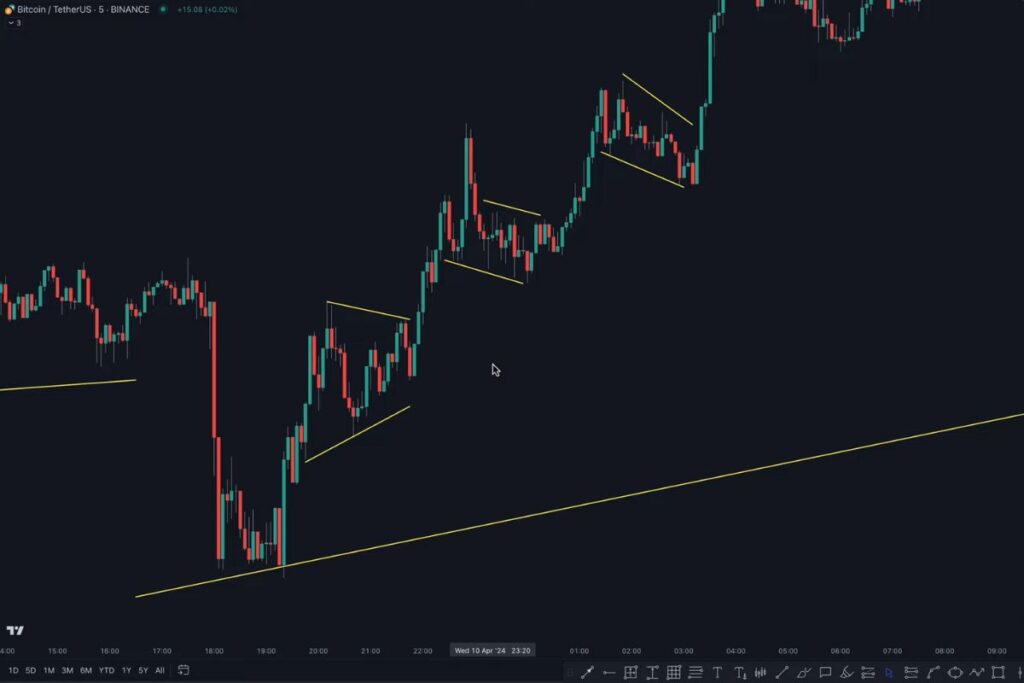 An LTF flag inside an HTF flag
When we zoom the timeframe down, we will have flag patterns appearing inside larger flags as in the image above.
To enter at those flags, follow the following articles in the Trading Hub 3.0 series of articles on Trading Hub 4.0.
3.7/5 - (4 votes)
Read structure 10x faster with JUKA
JUKA maps SMC structure — swings, BOS, CHoCH and inducement zones — automatically on any TradingView chart. No more hand-drawing structure for hours.
Get JUKA — $150