Trading Hub 4.0 (Part 4): The Power of the EMA 50
The way Trading Hub 4.0 finds entry points is much simpler than version 3.0. Trading Hub 3.0 will explain it to readers in this article.
The Exponential Moving Average (EMA)
Mr. Khan mentioned 2 lines, the MA and the EMA; I will standardise this article to use only the EMA line.
The Exponential Moving Average (EMA) is one of the popular indicators in trading; it smooths price data by reducing short-term price volatility. But this is not the indicator that decides entries.
When the market crosses above or below the EMA, it does not mean that we will enter right away.
We will only use the EMA as an additional confirmation to determine whether the structure is bullish or bearish.
Understand it simply as: first we need to determine impulse or correction (review the previous article), then we will be able to determine the flag pattern.
In TradingView, choose the Moving Average Exponential indicator and set the Length to 50.
Entering with the EMA 50
The steps for entering with the moving average in an uptrend:
- Determine the impulsive wave and the corrective wave (review the previous parts)
- Determine the flag pattern
- After a flag is created, we can enter at the bullish candle formed after price reacts with the EMA 50 line.
In a downtrend it is similar: after a flag is created, we can enter at the bearish candle formed after price touches the EMA 50 line.
To determine bullish/bearish candles, review Part 1.
So, in order to enter, price must satisfy 3 factors:
Creating a flag pattern + reacting with the EMA 50 + a Bullish/Bearish candle in line with the main trend appearing after that.
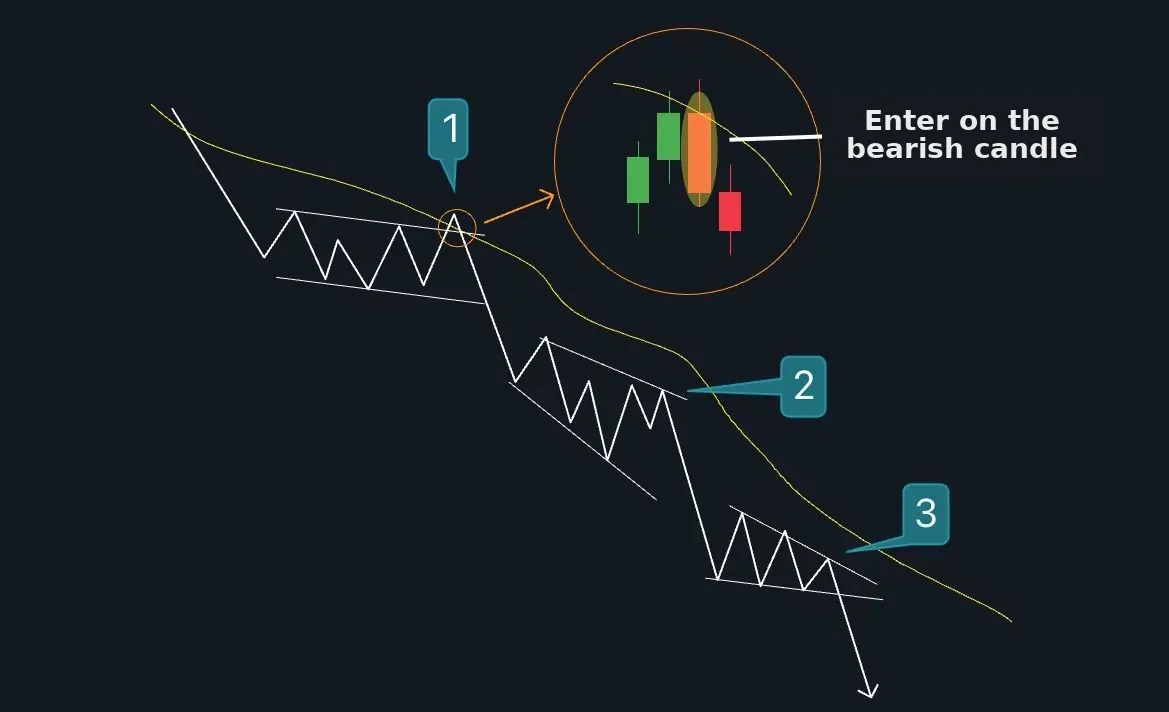 Entering with the EMA 50 line
In the image above, the market is moving in a downtrend and creates 3 flags at positions 1, 2 and 3. We look for a sell entry point at these 3 flags.
- At flag No. 1, price touches the EMA 50 line and has a rejection reaction with a strong bearish candle; we enter a buy order at that candle.
- At flags No. 2 and 3, price has not yet touched the EMA 50 line, so whether a bearish candle forms or not, we still do not enter.
-
If at flags No. 2 and 3 price touches the EMA 50 but does not create a bearish candle, we also do not enter.
Price action must show a rejection reaction from the EMA to increase reliability before executing a trade. When the market reacts from the EMA 50 line, wait for a strong bullish or bearish candle to enter. Place the stop loss (SL) above (if selling) or below (if buying) the flag pattern. Take profit (TP) at a 2R ratio.
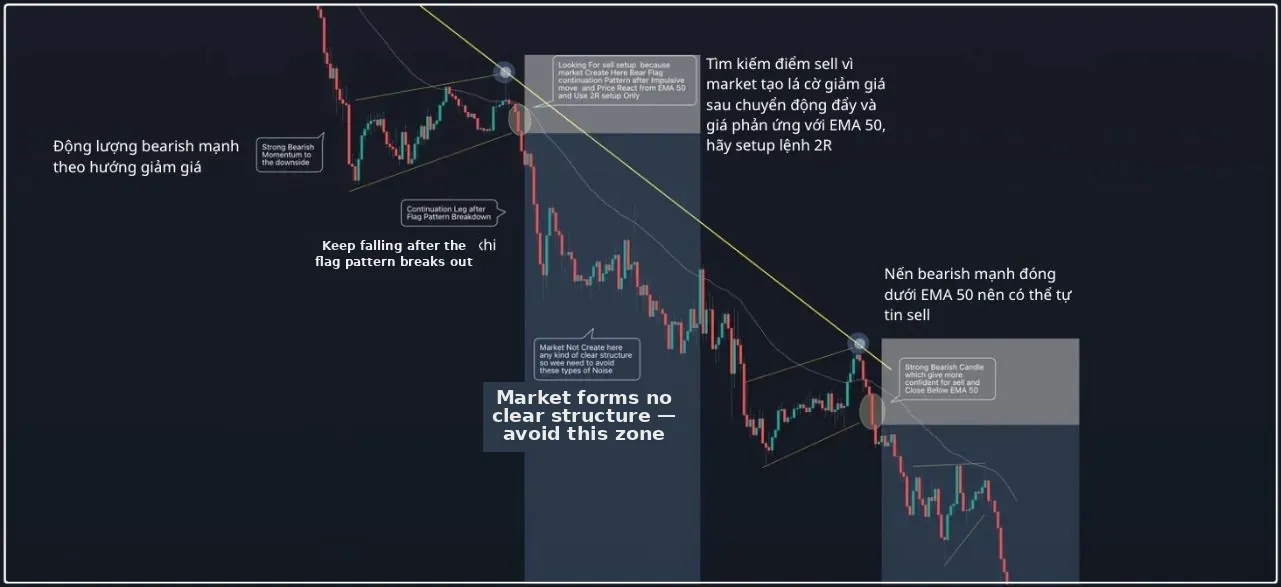 A real entry case with the EMA 50 moving average
5/5 - (1 vote)
Read structure 10x faster with JUKA
JUKA maps SMC structure — swings, BOS, CHoCH and inducement zones — automatically on any TradingView chart. No more hand-drawing structure for hours.
Get JUKA — $150