ICT Part 10: What Is the Market Maker Model (MMXM)? How to Trade with MMXM
What Is MMXM?
The Market Maker Model (MMXM) in ICT is a model describing how price moves from one PD Array to another PD Array, helping you have a trading idea with a clear stop-loss and take-profit.
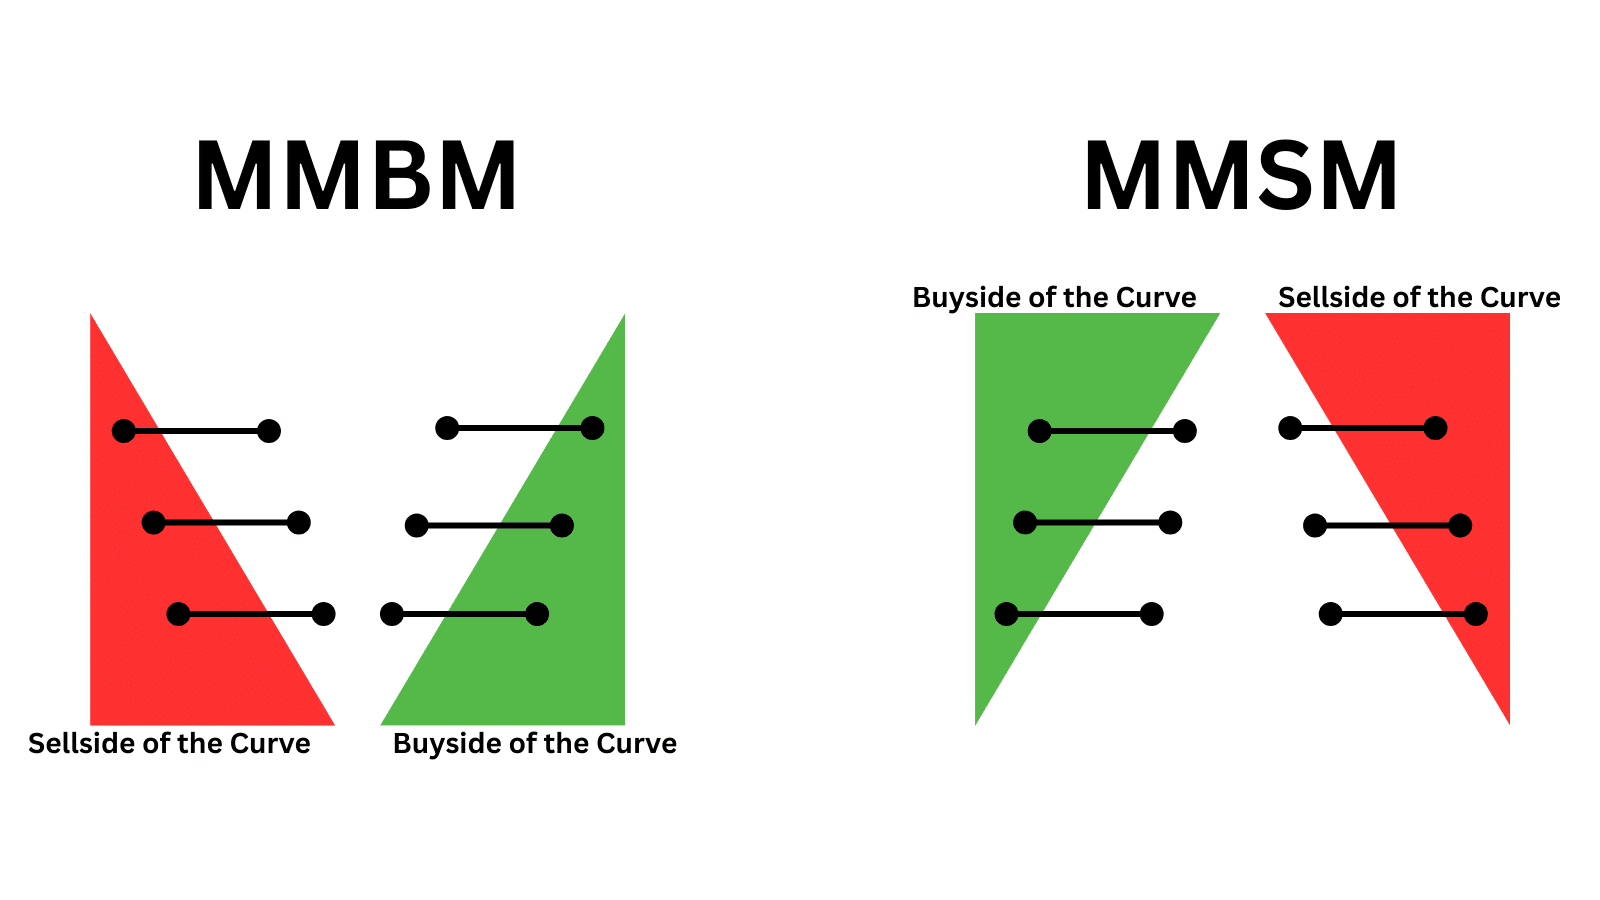
MMXM is divided into two forms: Market Maker Buy & Sell Models (MMBM & MMSM).
Market Maker Buy Model
The Market Maker Buy Model (MMBM) is the blueprint for price movement from a bullish PD Array to a bearish PD Array.
With MMBM, the market goes lower to go higher. Price moves from Discount to Premium (HTF) on the buyside.
 What is MMXM?
You need to find the following factors before there is an ICT MMBM buy model:
- Market structure on the HTF must be in an uptrend.
- The next DOL or the Daily Bias must point up.
- On a lower timeframe there must be a sell setup before the Premium array on the HTF.
Market Maker Sell Model
The Market Maker Sell Model (MMSM) is the price movement behaviour from a bearish PD Array to a bullish PD Array.
With MMSM, the market goes higher to go lower. Price moves from Discount to Premium (HTF) on the sellside.
Factors forming an ICT MMSM model:
- Market structure on the HTF must be in a downtrend.
- The next DOL or the Daily Bias must point down.
- On the LTF there must be a buy setup before the Discount array on the HTF.
Components of MMXM
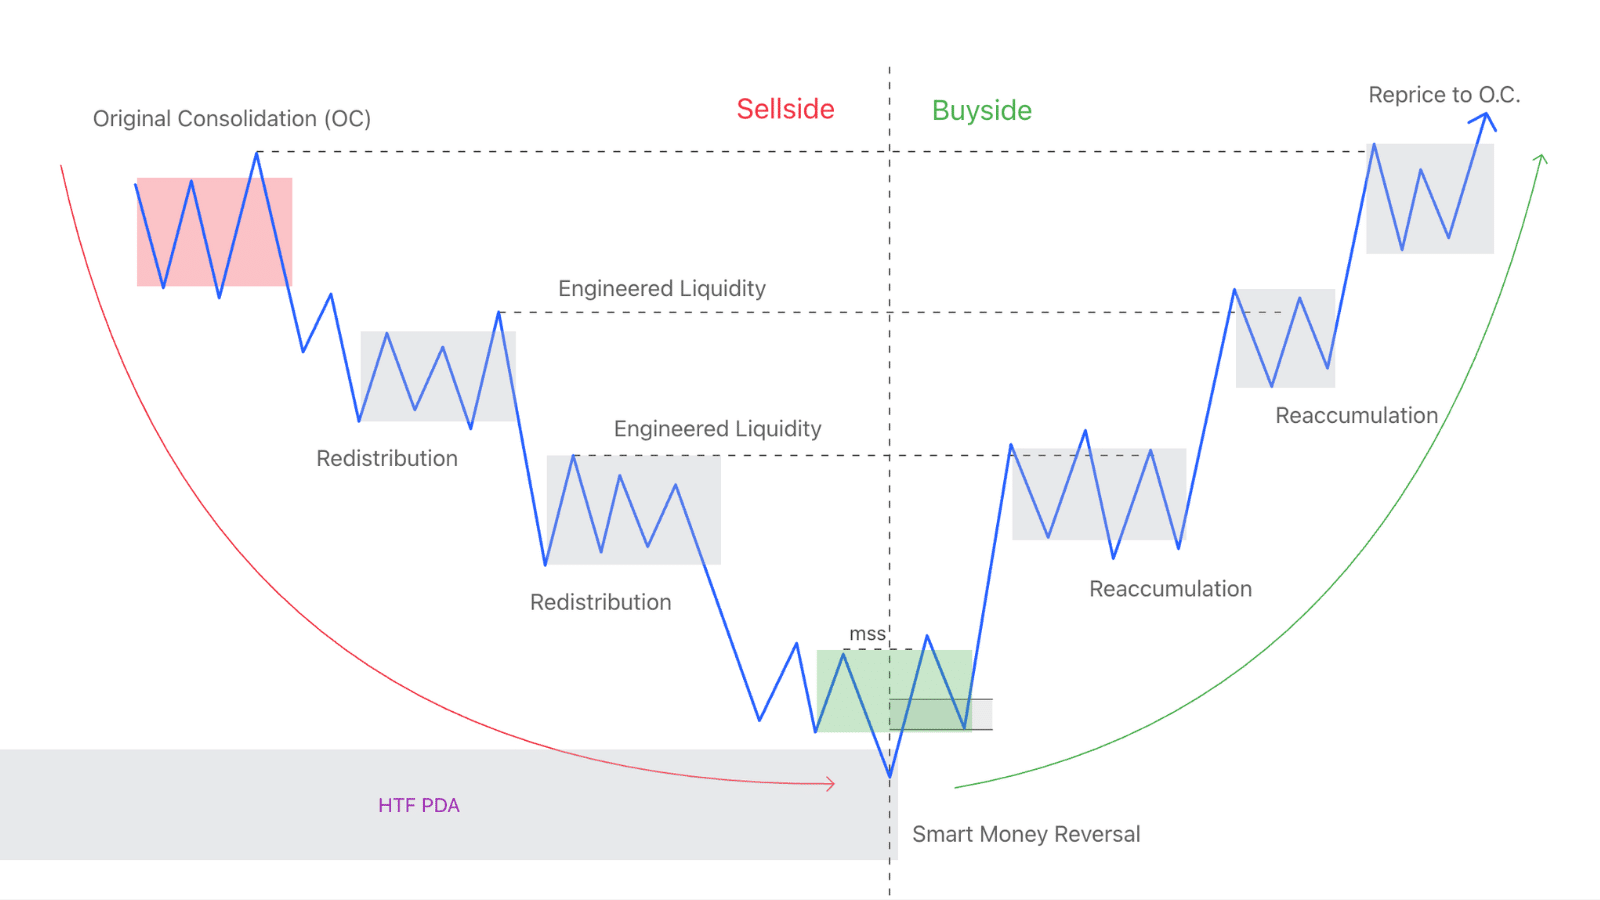
Let us illustrate the make-up of MMXM with an example of MMBM as in the image below:
 Make-up of MMBM
MMBM is composed of the components below:
Sellside of the Curve
This is the sellside of the curve, extending from BSL down to the DOL on the HTF.
(I) Original Consolidation
OC is the consolidation area formed after price moves up to interact with a past liquidity level on the HTF.
This is called a consolidation area because price ranges within a range, with an upper boundary formed from a past high, and a lower boundary formed from a price level that the market repeatedly retests.
Once we have identified a possible DOL in the Discount area, we will look for the OC area.
Ask yourself in your head: Are we at a price level that will form a Premium array to push price down to that draw on liquidity (DOL)?
 What is OC?
After price displaces and breaks down out of the OC, price may come back to test (or tap) that OC. This is the first opportunity to join a Short position.
For traders following the Wyckoff methodology, OC is called a distribution trading range.
(II) Re-distribution
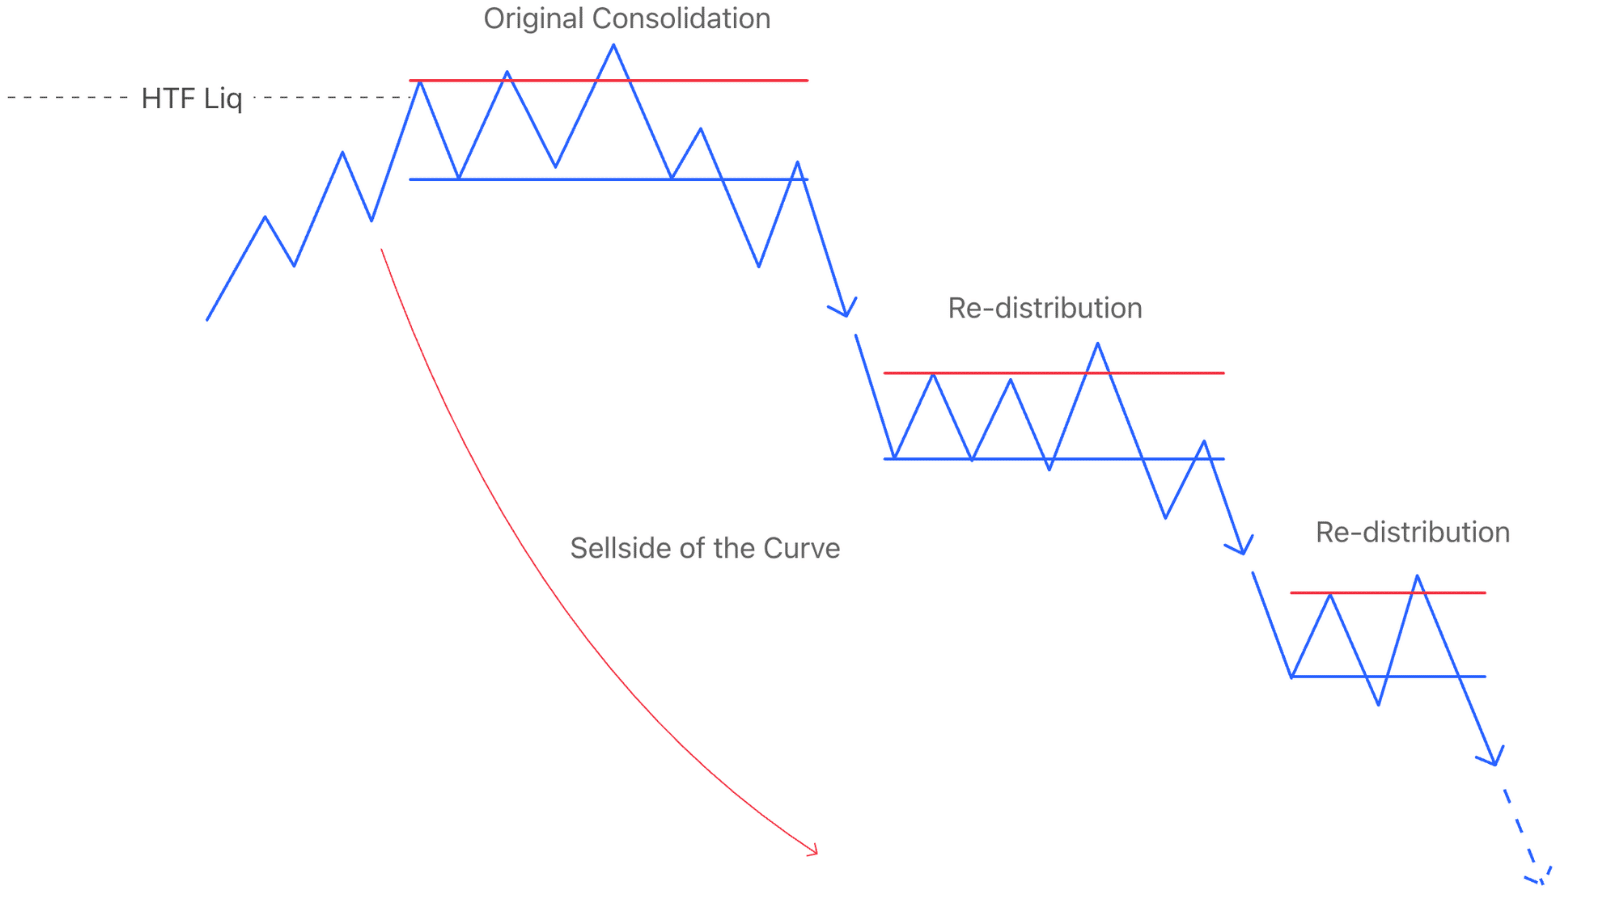
Re-distribution in MMBM is the phase in which Smart Money continues to distribute their orders in order to expand their position from their OC area.
Each time price drops to a liquidity area such as a past FVG/OB, price may correct back up. At that point Smart Money needs to re-distribute at the FVG/OB positions on the sellside.
Usually there will be 1–3 Re-distribution areas appearing before price reaches its final target.
We expect the first Re-distribution phase to form within 20–30% of the sellside curve, and the second phase to exceed 50% of the sellside curve.
 Re-distribution in ICT
Re-distribution can be a sideways area or can also just be a pullback.
Note: The closer we get to the final target, the faster price runs and the fewer entry opportunities we have compared to the area above.
(III) Engineered Liquidity
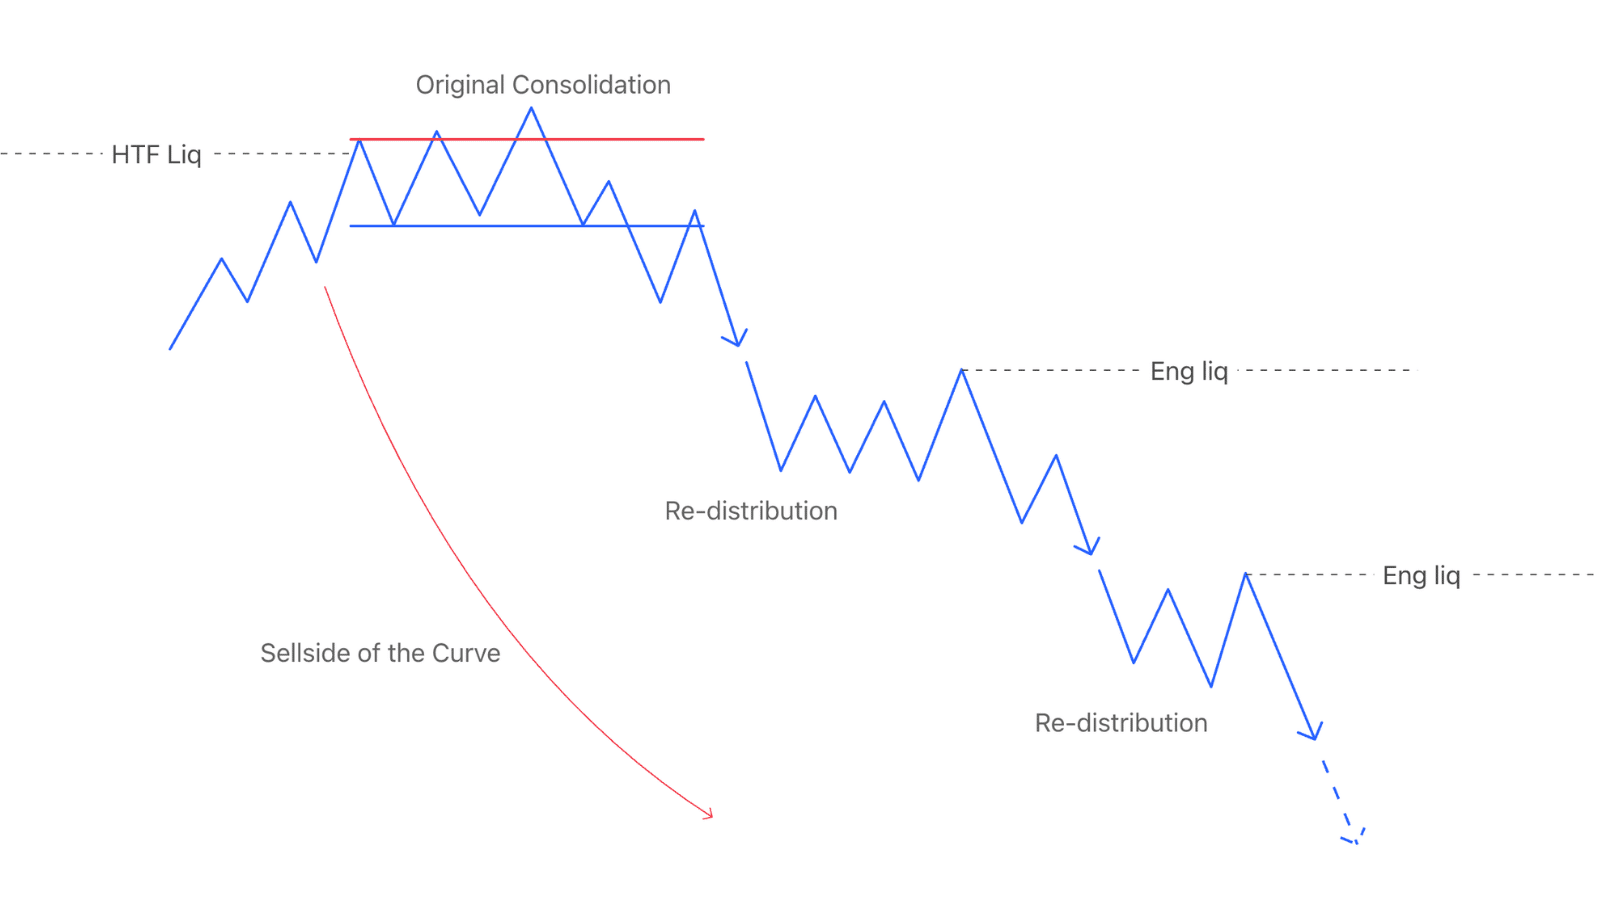
Engineered liquidity is artificial liquidity deliberately created by Smart Money to attract retail into trades, so that Smart Money can go against the crowd.
In this case, Engineered liquidity refers to the price decline that creates Lower Highs, acting as liquidity when price moves to the buyside.
With MMBM, Engineered liquidity is BSL. With MMSM, Engineered liquidity is SSL.
 Engineered Liquidity MMXM
Buyside of the Curve
When price touches a PDA on the HTF, we look for a Long entry point. At this point price follows a curve from the sellside back to OC.
(IV) Smart Money Reversal
Smart Money Reversal (SMR) in ICT refers to the reversal from the sellside to the buyside when price touches an HTF PDA array.
This is exactly a bottom-fishing phase in an HTF uptrend when we expect price to continue rising after a correction.
We will wait for a reversal on the LTF (MSS) to confirm the entry, combined with SMT to increase the win rate.
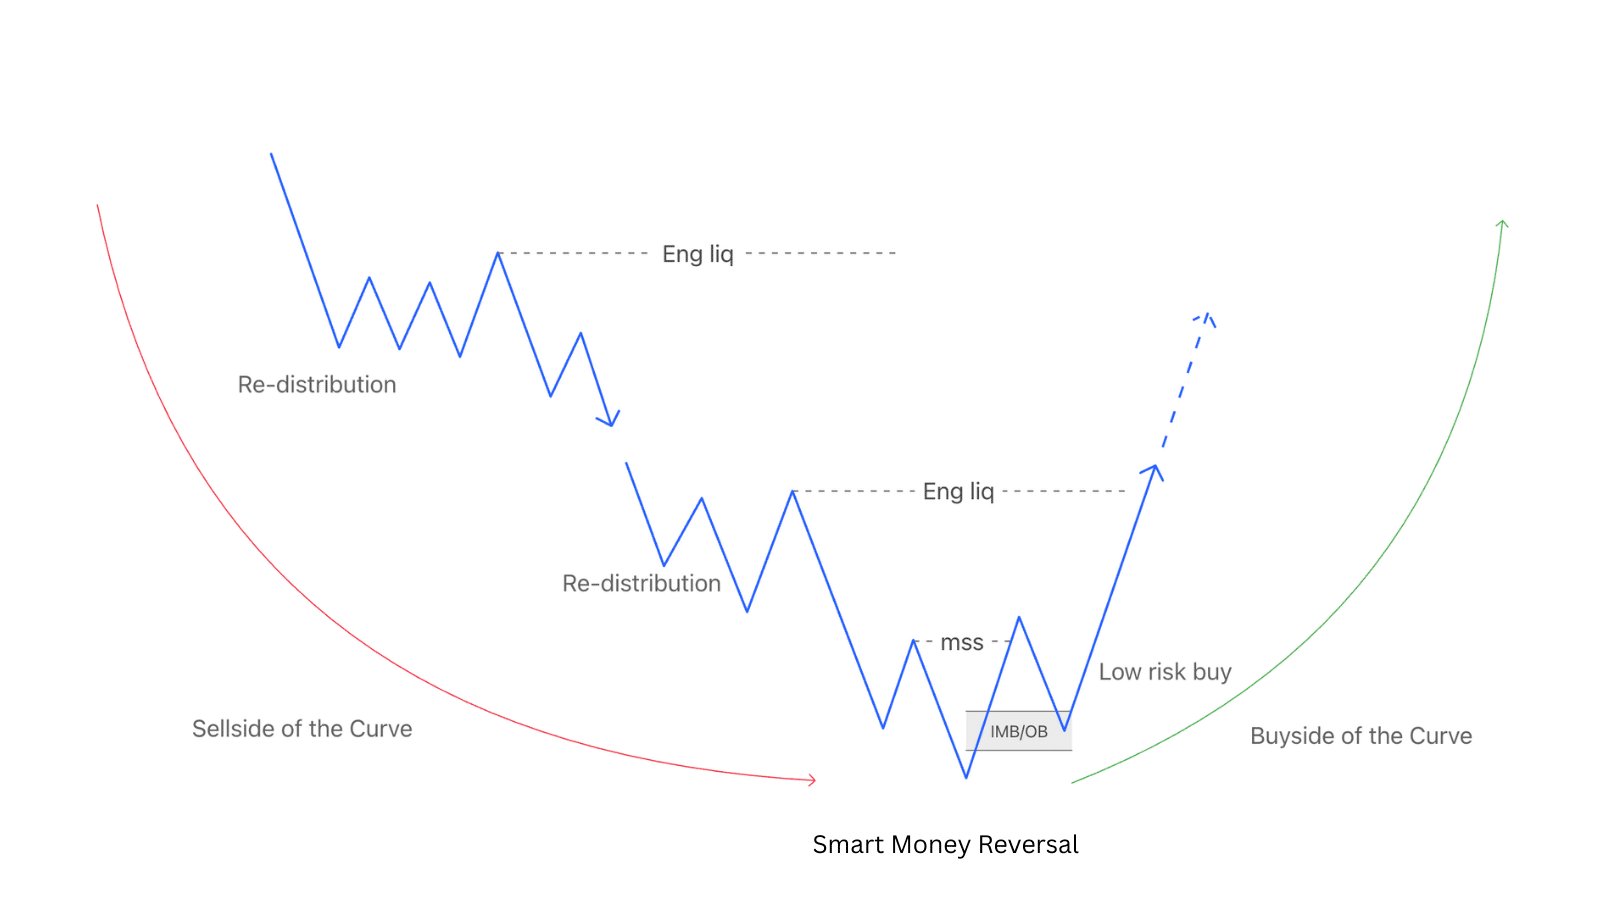 Smart Money Reversal
(V) Re-Accumulation
Similar to re-distribution, re-accumulation in MMBM is the phase in which Smart Money continues to accumulate their orders so price can continue rising to the DOL.
Usually a second re-accumulation area will appear if the first area forms before price reaches 50% of the curve.
Once there has been a Market Structure Shift, if price pushes up beyond 50% of the curve, it is very likely there will be only a single pullback before price goes straight to the DOL.
Towards the end of the buyside curve, the rise is stronger and faster than the sellside curve in MMBM, because the main trend already has a bullish bias and price is capable of breaking through the original consolidation area.
Meanwhile, the sellside curve is a controlled decline to a level that we expect price to return to before exploding higher.
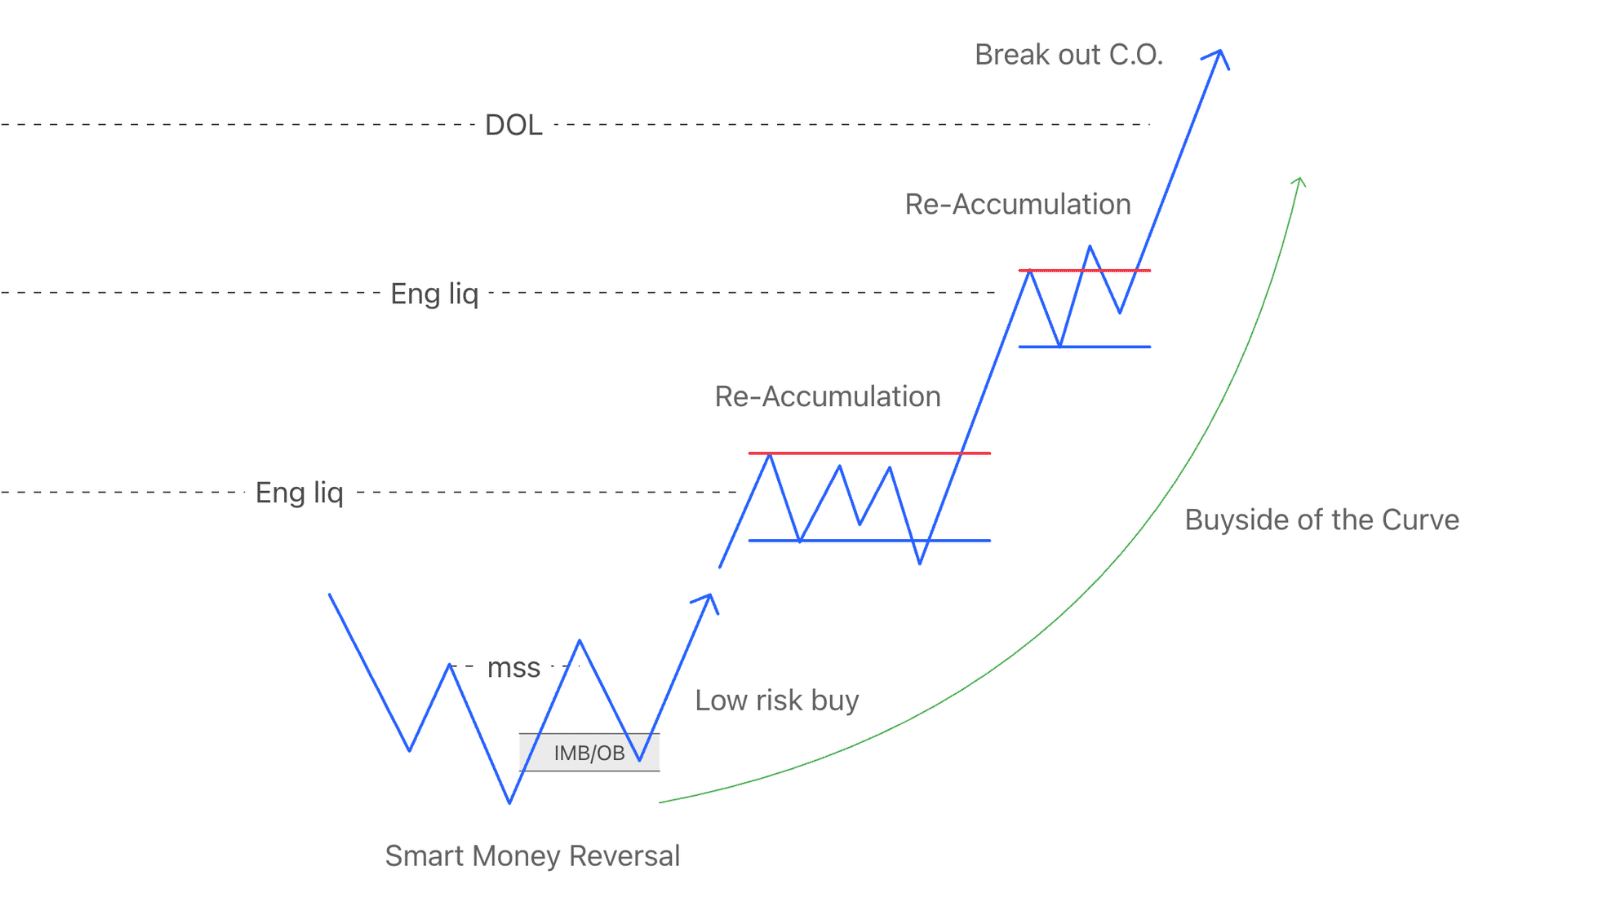 Re-Accumulation in ICT
Re-accumulation can be a sideways area or can also just be a pullback.
Similarly, with the MMSM model, we also have the full set of similar events and phases as MMBM.
On the buyside of the curve we have the OC and Re-accumulation events.
On the sellside of the curve we have the SMR and Re-distribution events, and price goes straight to the DOL.
This model leaves traces; we can use them to capture high-probability setups.
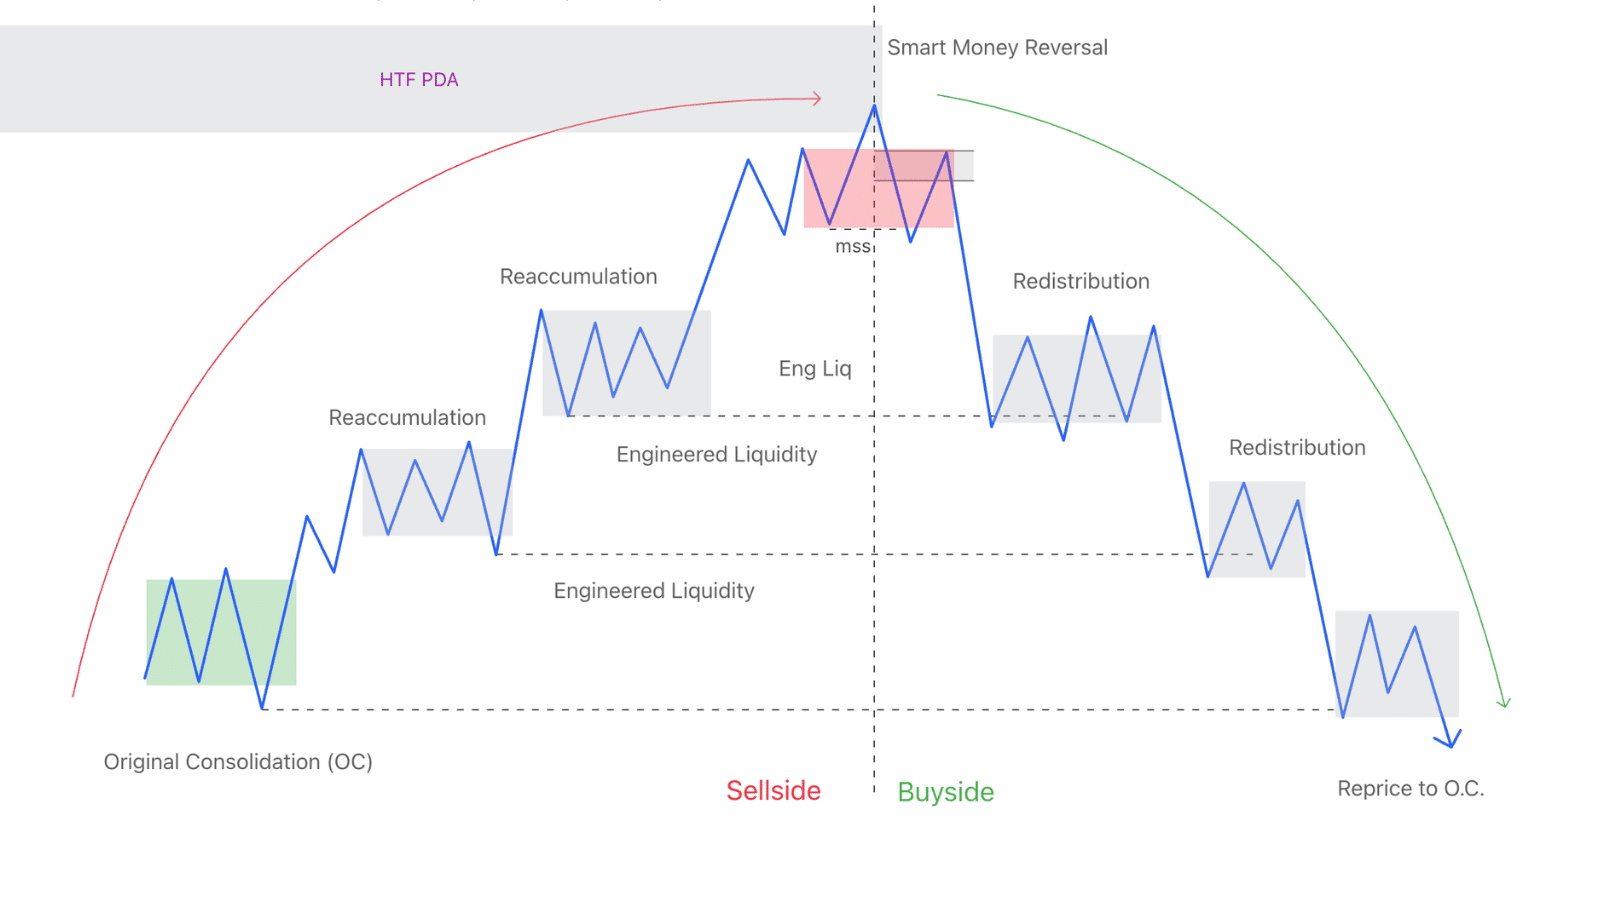 Make-up of MMSM
How to Trade with MMXM
When analysing, we look at the left side of the curve to anticipate price action on the right side.
We need to wait for price to complete the left side of the curve — that is, after seeing price touch a PDA on the HTF and a reversal appear, we then start analysing how to trade.
The first entry will be an FVG that occurs after MSS, before price breaks through the first Engineered Liquidity. That is a low-risk entry.
Each time price interacts with Engineered Liquidity, we expect price to correct back to a PDA.
We will apply all the PDAs we have learned to look for entry points, prioritising Reclaimed OB, OB, OF, FVG.
 How to trade with MMXM
The closer we get to the DOL, the faster price runs and the fewer entry opportunities we have.
Timeframes for Using MMXM
Depending on the length of the curve, no timeframe is perfect for MMXM. Usually we can switch to the LTF or ITF.
| HTF | ITF | LTF |
|---|---|---|
| Weekly PDA | D1 MMXM | H4 MMXM |
| Daily PDA | H4 MMXM | H1 MMXM |
| H4 PDA | H1 MMXM | m15 MMXM |
| H1 PDA | m15 MMXM | m5 MMXM |
| m15 PDA | m5 MMXM | m1 MMXM |
The smaller the timeframe on which MMXM occurs, the fewer entry touch points we have.
MMXM Examples
MMBM Model on the Nas100 Index
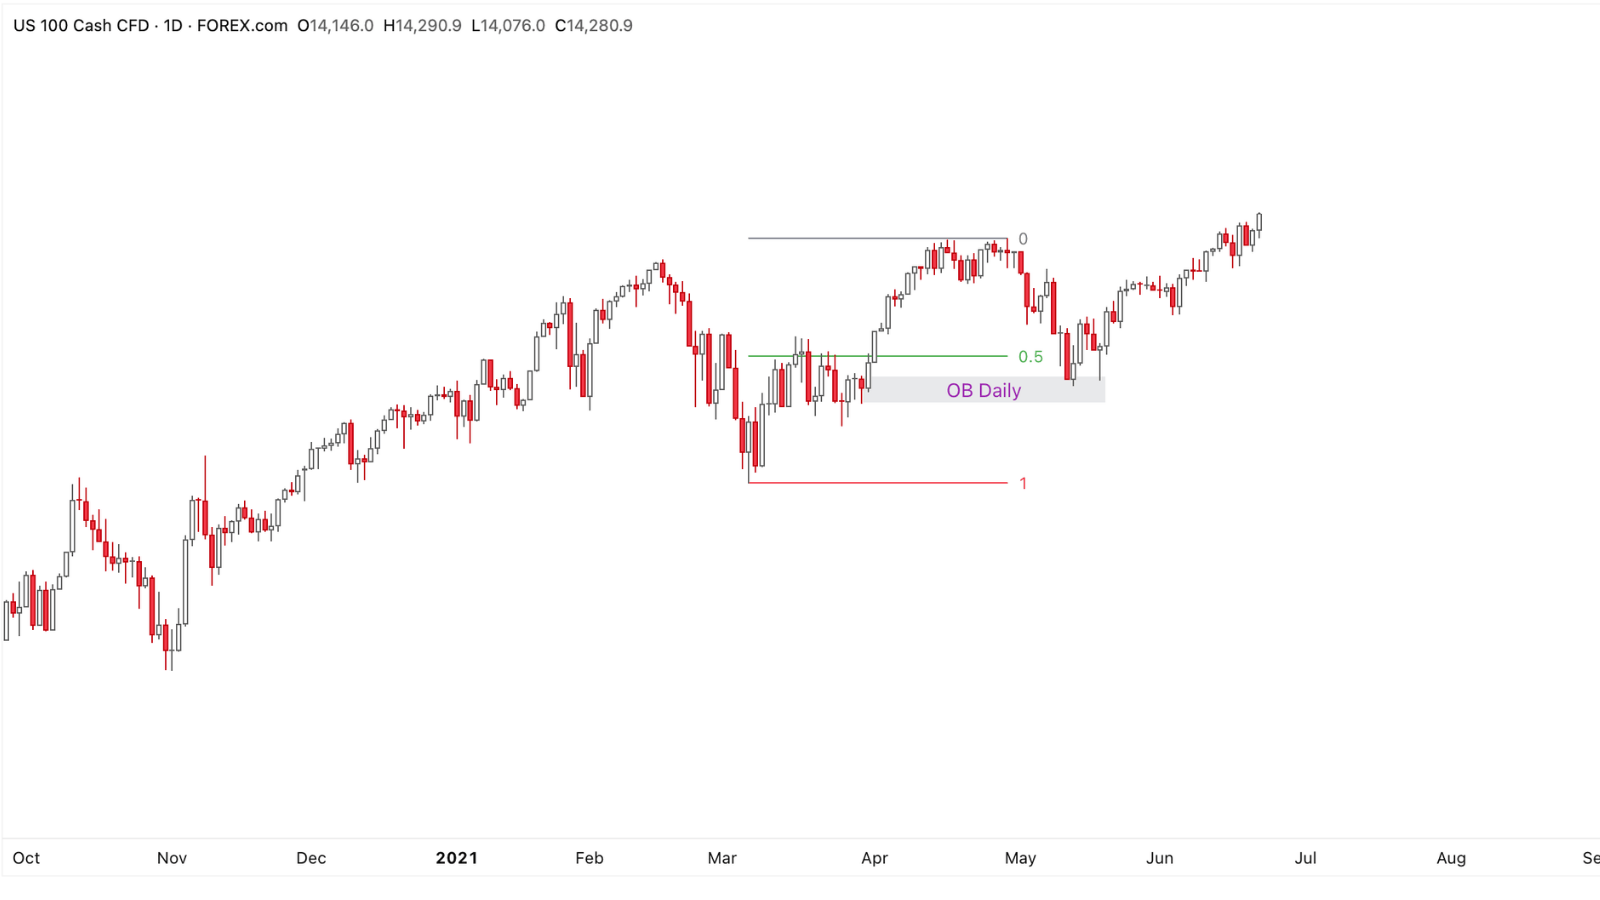 MMBM example on the HTF
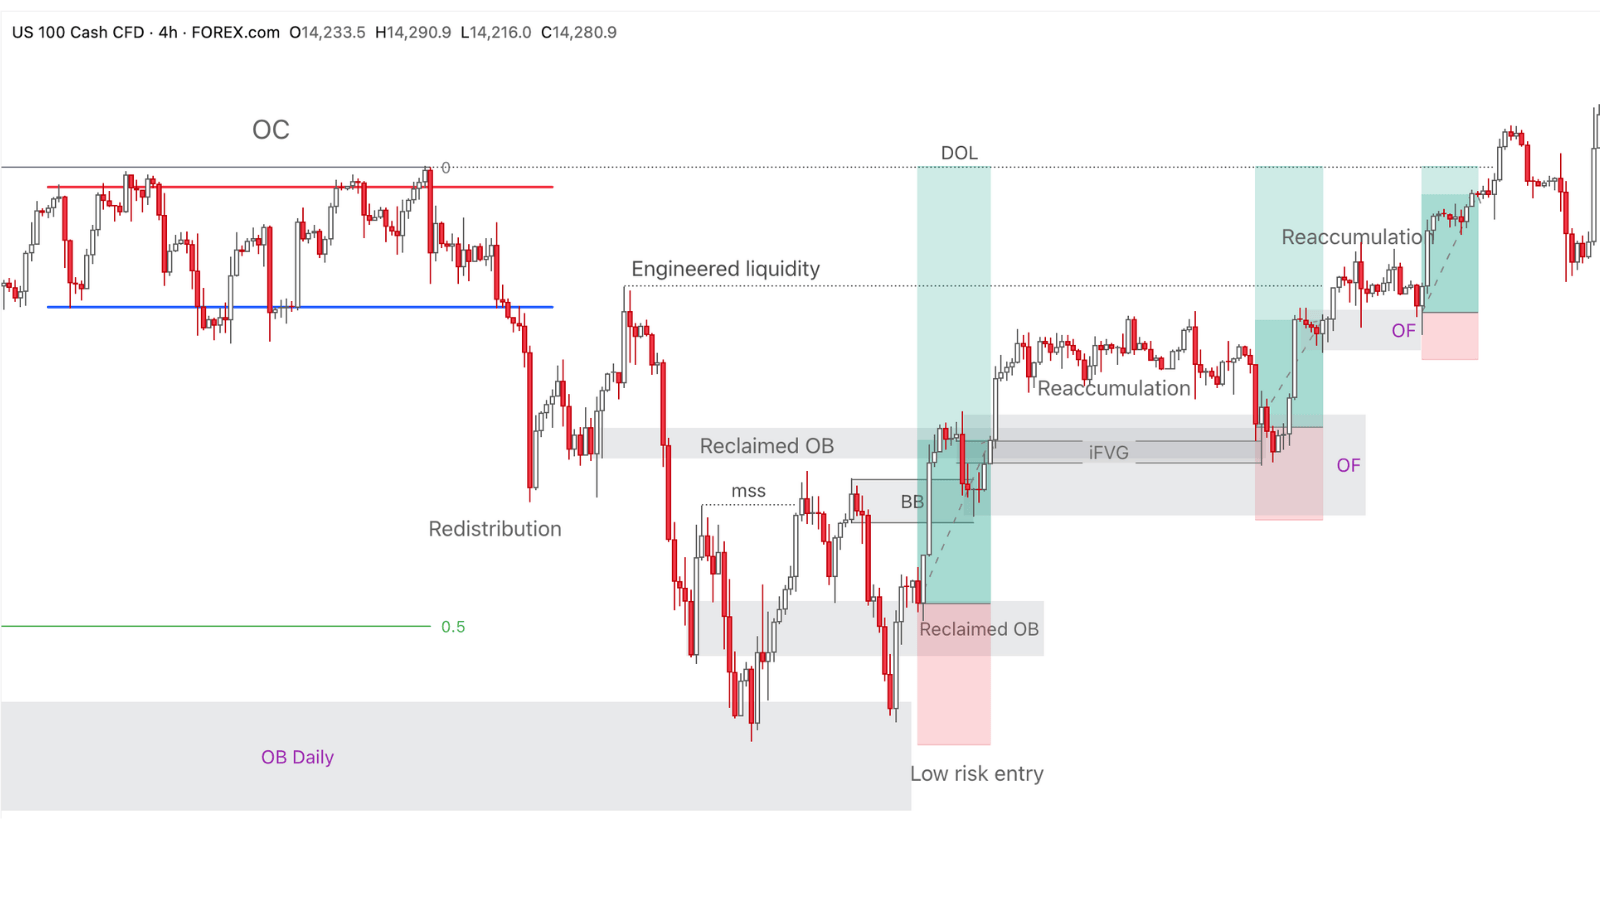
On the Weekly/Daily timeframes we see US100 is in an uptrend.
A correction back to a Daily OB in the Discount Array.
We switch to the H4 timeframe to look for an entry point.
 MMBM example
On the H4 timeframe, we notice the buyside curve has completed when price returned to a PDA on the HTF and MSS appeared.
We start looking for entry points:
- Low-risk entry at a Reclaimed OB after price reverses higher.
- Second entry at an iFVG in confluence with a Reclaimed OB and OF.
- Third entry at OF after price takes Engineered Liquidity.
In my experience, the second entry is the safest because it has many confluence areas, does not have the fake MSS rate of the first entry, and the accumulation area at the second entry is also a clear AMD setup.
MMSM Model on the Nas100 Index
 MMSM example on the LTF
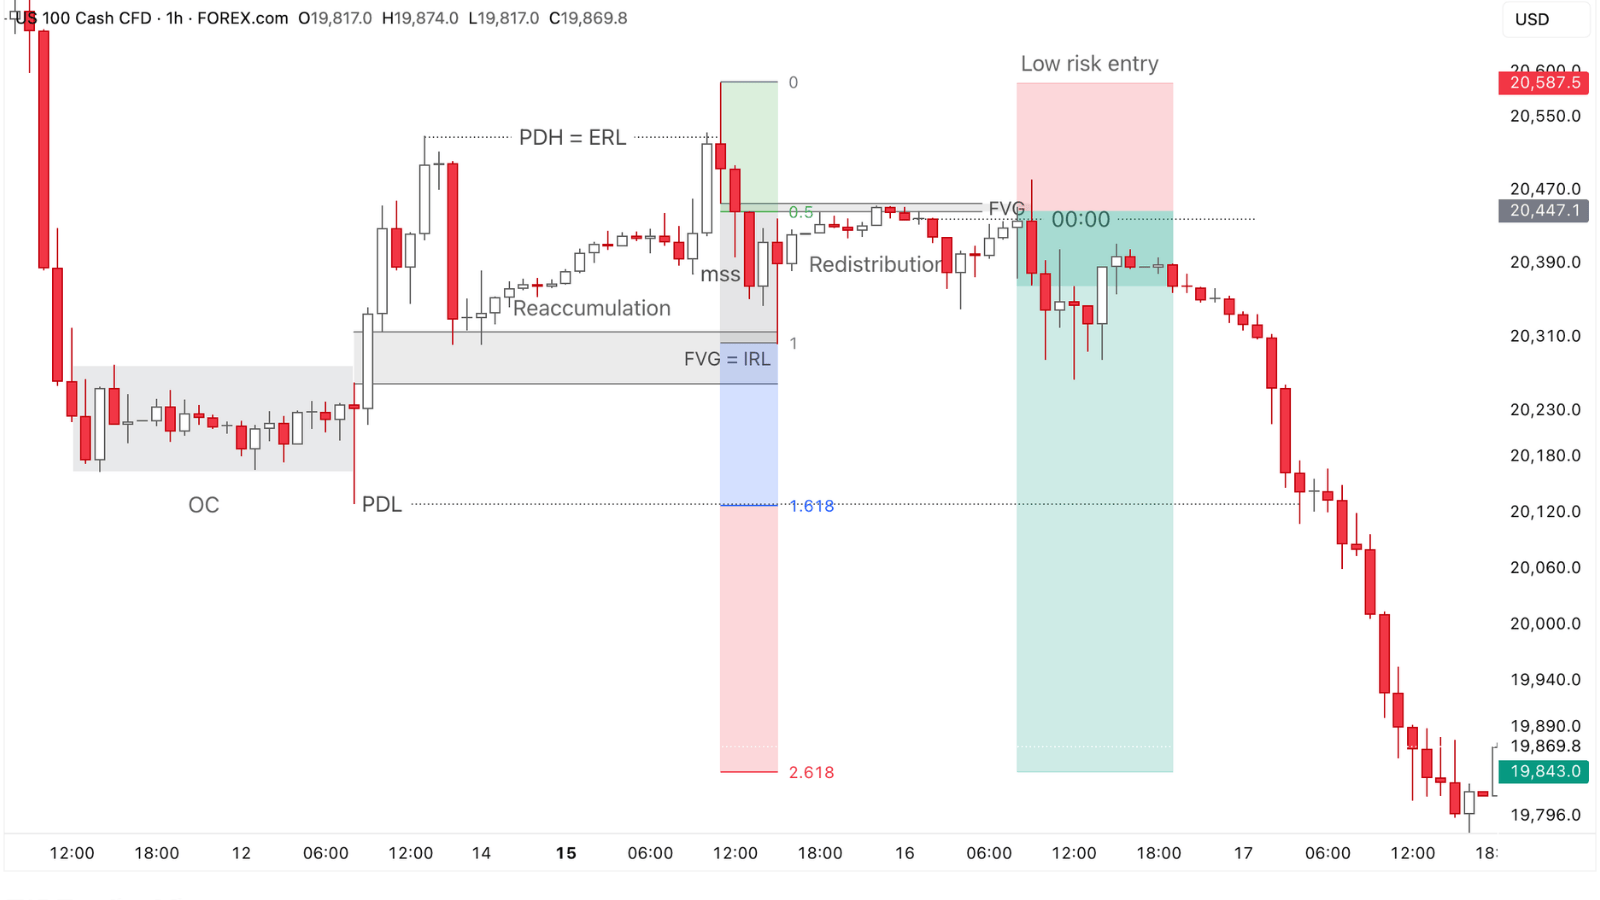
The example that Trading Hub 3.0 found below is quite interesting on the US100 index:
- Price sweeps PDH liquidity.
- Price reverses with an H1 MSS.
- Then price drops to an H1 Bullish FVG (ERL → IRL).
- Look to short at the H1 FVG lying in the Premium area, above 00:00.
Place take profit at the 2.618 Fibonacci level. We can take partial profit at PDL, which coincides with the 1.619 Fibonacci level.
Read structure 10x faster with JUKA
JUKA maps SMC structure — swings, BOS, CHoCH and inducement zones — automatically on any TradingView chart. No more hand-drawing structure for hours.
Get JUKA — $150