Why You Never Know When to Buy or Sell (It's Not Your Strategy — It's Market Structure)
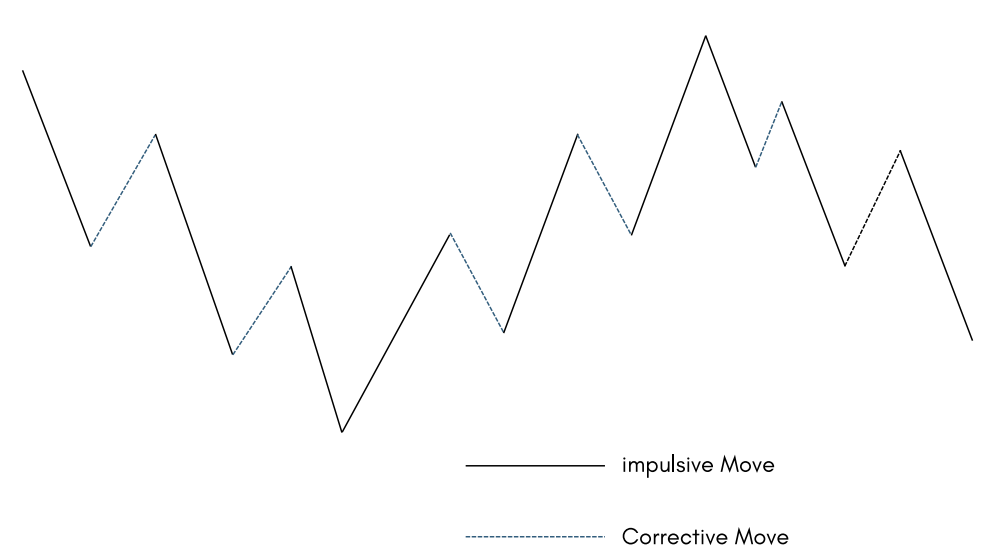
You do not have a buy/sell problem. You have a "which state is the market in" problem. Every losing trader knows the feeling: price rallies, you finally buy — and it tops. Price crashes, you panic-sell — and it bottoms. Then you stare at the chart wondering how you always seem to get it backwards. The answer is uncomfortable but simple: you were never taught to read market structure, so every buy and sell decision was a guess dressed up as analysis.
The buy-high, sell-low cycle
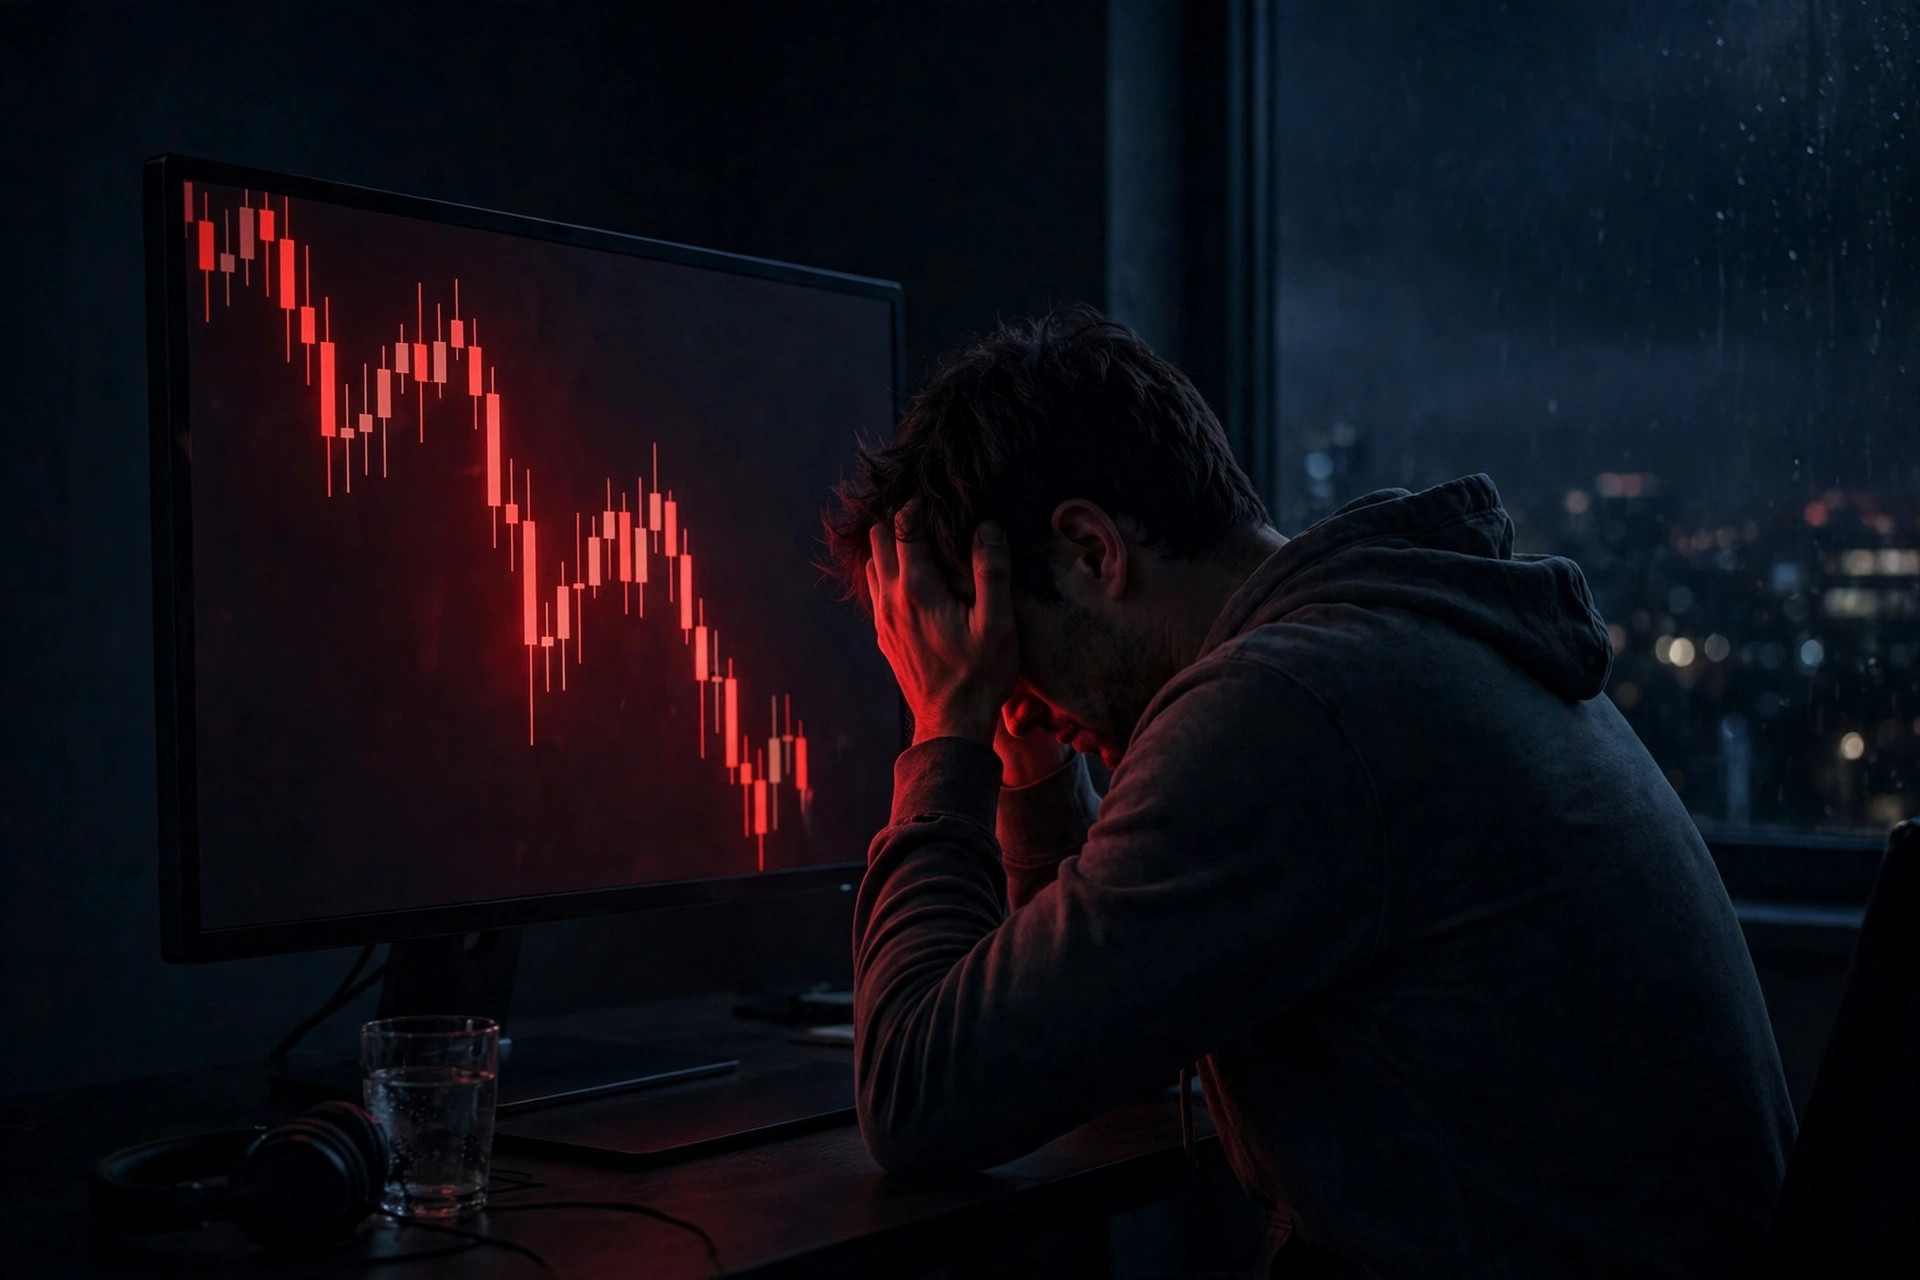
Watch the cycle play out, because you have lived it. Price rises fast and everyone gets confident — that confidence peaks exactly at the top, and that is when most retail traders buy. Then price pulls back a little, a normal healthy correction, and the same traders panic: the red portfolio feels like proof they were wrong, so they sell at a loss. Then price resumes upward without them.
The professionals do the opposite at both ends. They buy while panic controls the crowd, and they sell into the euphoria. The difference is not courage or information. It is that professionals decide from structure, while amateurs decide from feelings. Feelings always arrive late: greed peaks at tops, fear peaks at bottoms.
Why buy/sell indicators cannot fix this

The obvious escape looks like a buy/sell indicator: a green arrow says buy, a red arrow says sell, no thinking required. It fails for two structural reasons, and both matter for market structure.
First, lag. An indicator is computed from past price, so its signal can only appear after the move has already started. By the time the arrow prints, the best price is gone and the risk is at its worst — you enter exactly when the move is most extended, which is why indicator entries so often become instant drawdowns.
Second, repainting. Many buy/sell indicators redraw their history: an arrow that appeared on a live candle vanishes or moves once the candle closes, or the indicator recalculates past signals as new data arrives. The backtest looks perfect because the losers were erased. On a live chart, you trade signals that may not exist five minutes later.
An indicator that lags and repaints cannot identify market structure, because market structure is read from price itself — from swing highs and lows and candle closes — not from a derivative of price that rewrites itself. Outsourcing the buy/sell decision to a label is outsourcing the one decision that matters. A label cannot measure where risk is smallest, and it cannot tell you which state the market is in.
The real question: which state is the market in?
Most traders trade patterns in a vacuum. They see a breakout and go long. They see support and go long. They see a pullback and go long. But if you do not know which state the market is in, you are guessing. There are only four states, and each one answers the buy/sell question differently:
- Uptrend — buy pullbacks only. Price makes higher highs and higher lows. You never chase the rally and never short it. You wait for price to come back to a level and buy there.
- Downtrend — sell rallies only. Price makes lower highs and lower lows. You never catch the falling knife and never buy the bounce. You wait for price to rise into a level and sell there.
- Range — stand aside. No clear sequence of highs and lows. Trend strategies bleed here. The correct trade is often no trade.
- Transition — wait for confirmation. A change of character just printed. The old trend may be dying, but the new one has not proven itself. You wait for the next structure to confirm before committing.
Notice what this framework does: it tells you when to trade, when to wait, and when to get out — before you ever look at an entry trigger. Buy and sell stop being guesses. They become consequences of the state.
How to identify market structure correctly
Reading structure correctly is a mechanical skill, not a talent. Five steps:
- Mark only the obvious swings. A swing high is a peak with lower price on both sides; a swing low is a trough with higher price on both sides. If you have to squint to see it, it is not a swing that matters.
- Read the sequence. Higher highs and higher lows mean buyers control. Lower highs and lower lows mean sellers control. Neither means range — stay out of trend trades.
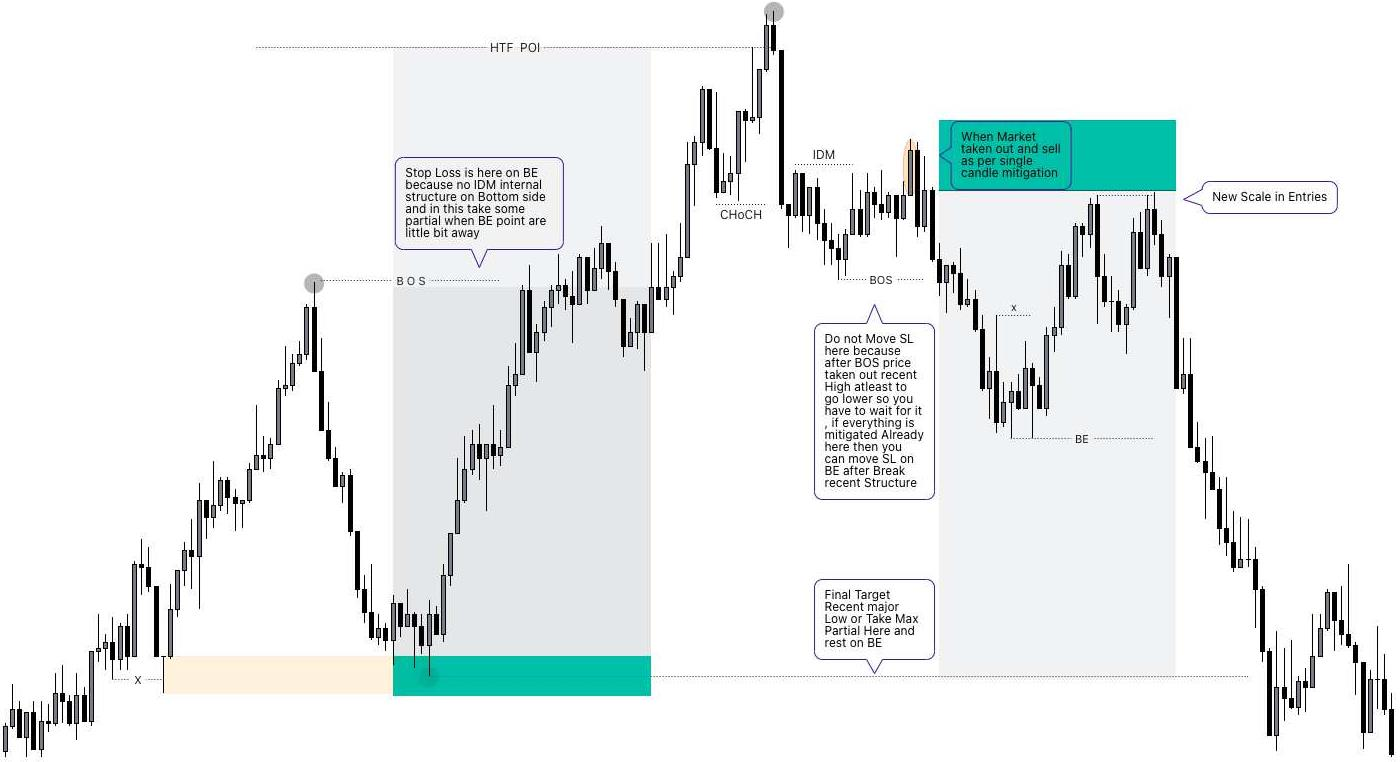
- Use BOS for continuation, CHoCH for warning. A break of structure (BOS) confirms the trend is still in control. A change of character (CHoCH) is the first break against the trend — an early warning, not a confirmed reversal.
- Demand a candle close. A wick piercing a level is not a break — it is usually a liquidity sweep collecting stops. Only a candle body closing beyond the level counts. This one rule kills most false signals.
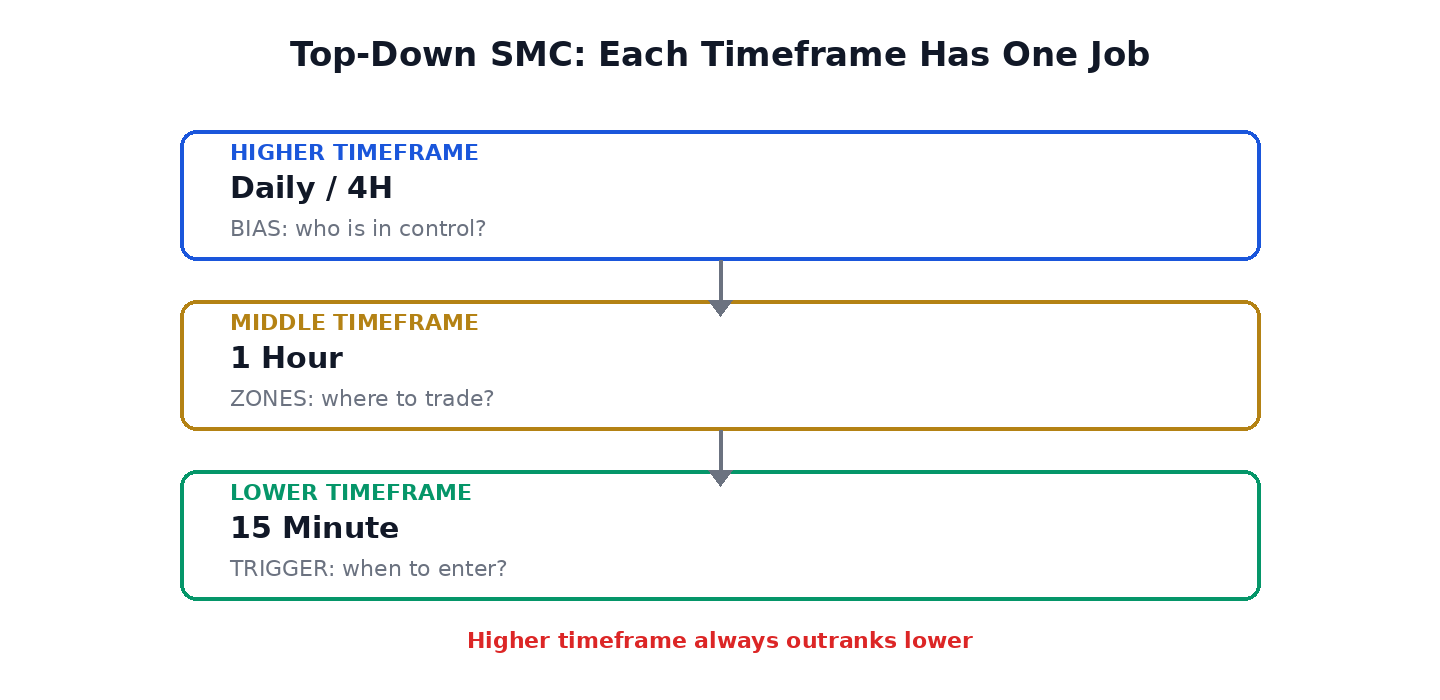
- Read external structure, and let the higher timeframe lead. BOS and CHoCH are read on the big swings, not the small wiggles inside a leg. And a 5-minute signal against a daily trend is a pullback until proven otherwise — the higher timeframe always wins.
The one rule that separates a pullback from a reversal
The single most expensive confusion in trading is mistaking a pullback for a reversal — and vice versa. It is how traders sell winners too early and buy into real reversals thinking they caught a dip.
The rule: a pullback respects structure; a reversal breaks it. In an uptrend, a pullback holds above the last higher low. A reversal takes out that higher low with a candle close — a CHoCH. Same logic mirrored in a downtrend. One rule, applied coldly, ends the most common buy/sell mistake there is.
The 3-question checklist before every trade
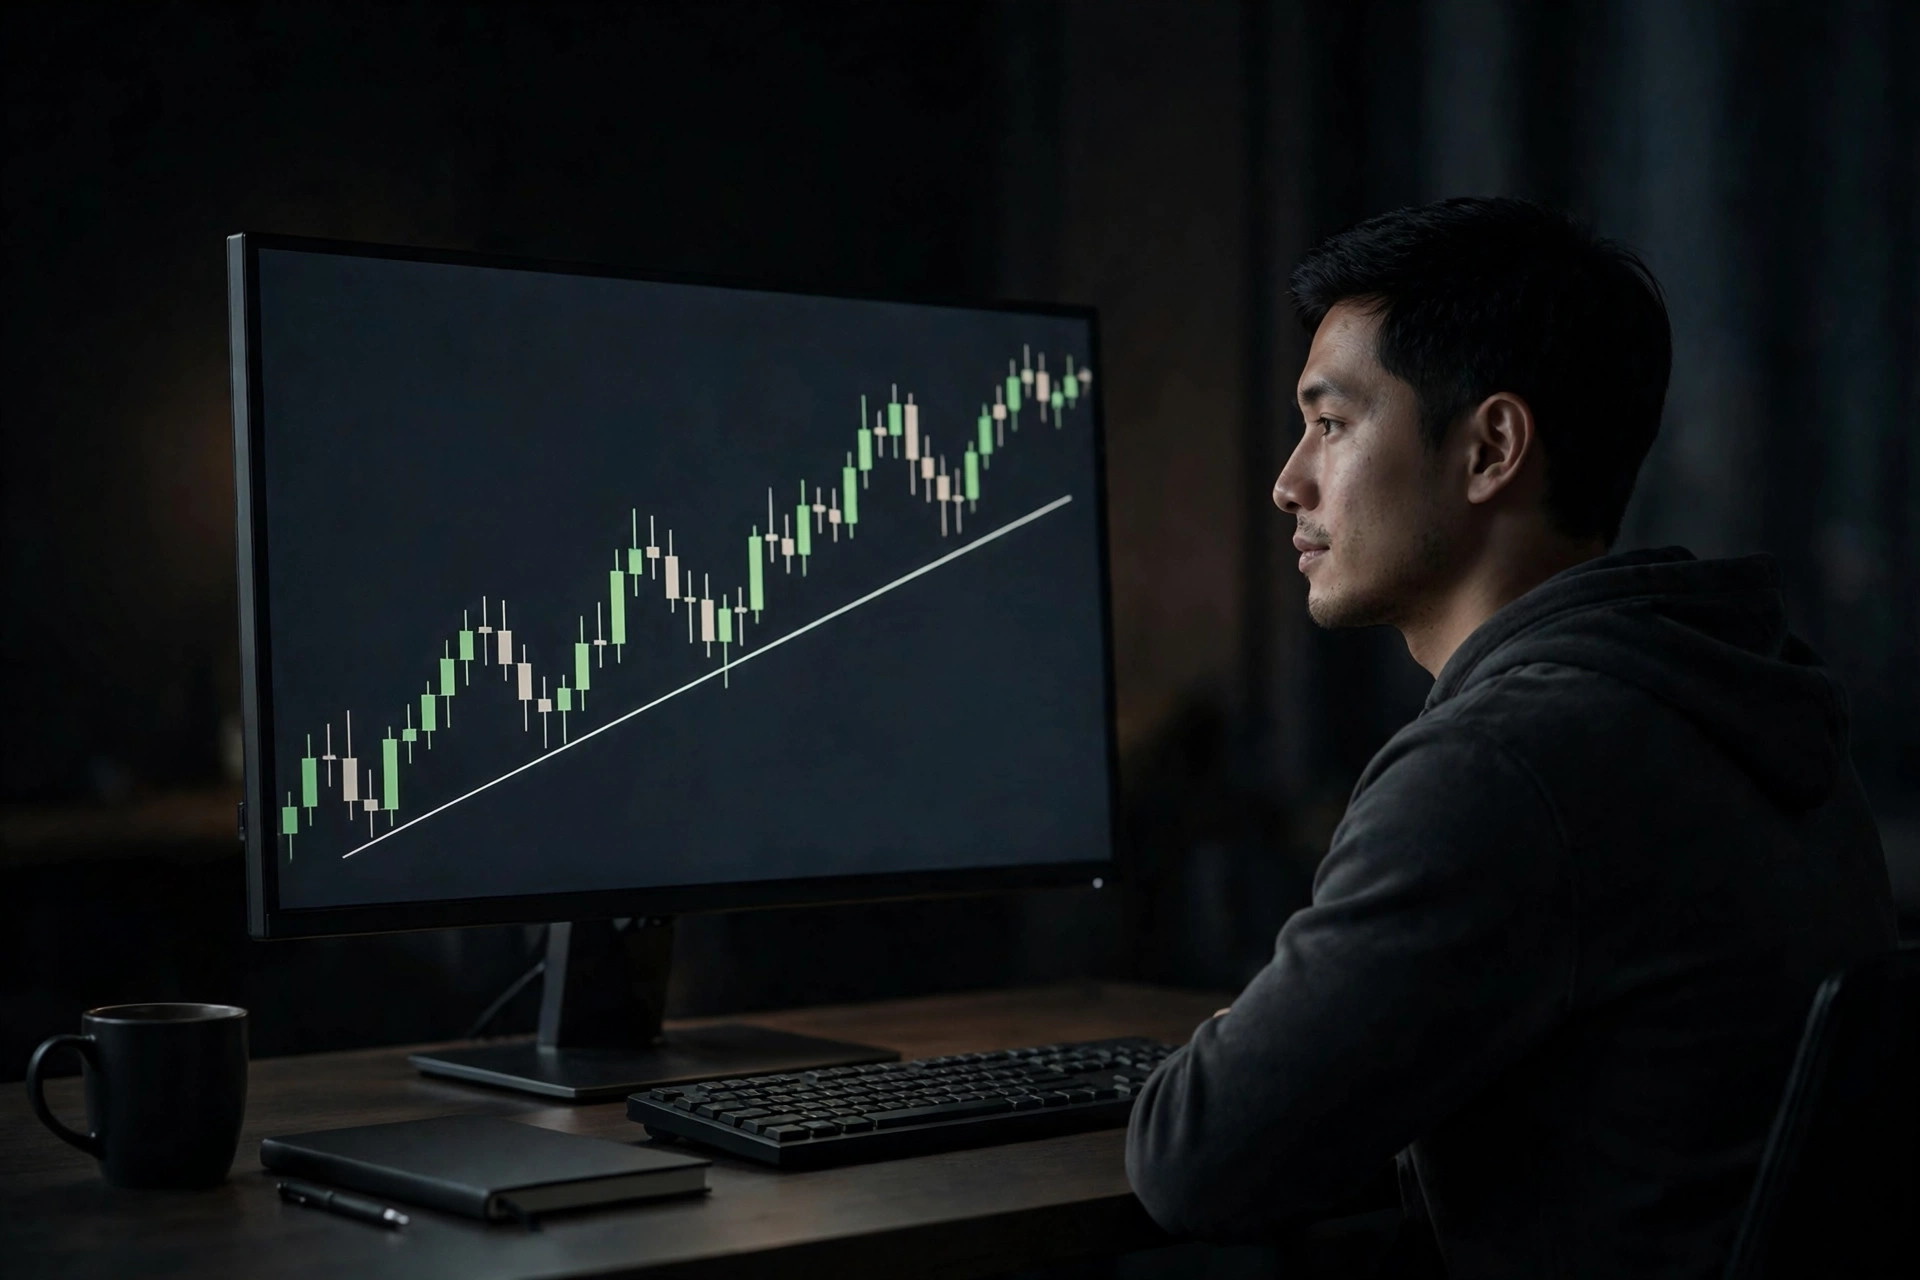
Before you click buy or sell, answer three questions. If any answer is unclear, you do not have a trade — you have a guess:
- What does the higher-timeframe structure say? Uptrend, downtrend, or range — this sets the only direction you are allowed to trade.
- Did BOS or CHoCH confirm it? A BOS keeps you with the trend; a CHoCH tells you to stop trusting the old one and wait.
- Am I trading with structure or against it? Buying a pullback in an uptrend is with structure. Buying a bounce in a downtrend because it "looks cheap" is against it.
Three questions, ten seconds. Most losing trades fail at least two of them — and most of those failures happen because the trader never asked.
Frequently asked questions
Why do I always buy tops and sell bottoms?
Because you trade feelings, and feelings peak at the wrong moments: confidence peaks at tops, panic peaks at bottoms. Structure replaces feelings with a rule: the market's state decides the direction, and only then do you look for an entry.
Do buy/sell indicators work?
No — not for identifying market structure. They lag, because they are computed from past price, and many repaint, erasing losing signals from history. They cannot read structure, because structure is read from price itself: swings and candle closes.
How do I know when to buy or sell?
First identify the market's state on the higher timeframe. In an uptrend, buy pullbacks. In a downtrend, sell rallies. In a range, stand aside. After a CHoCH, wait for confirmation. The state answers the question; the entry only refines it.
What is market structure in trading?
The sequence of swing highs and lows that tells you whether buyers, sellers, or neither are in control of a market.
Stop Drawing Structure by Hand
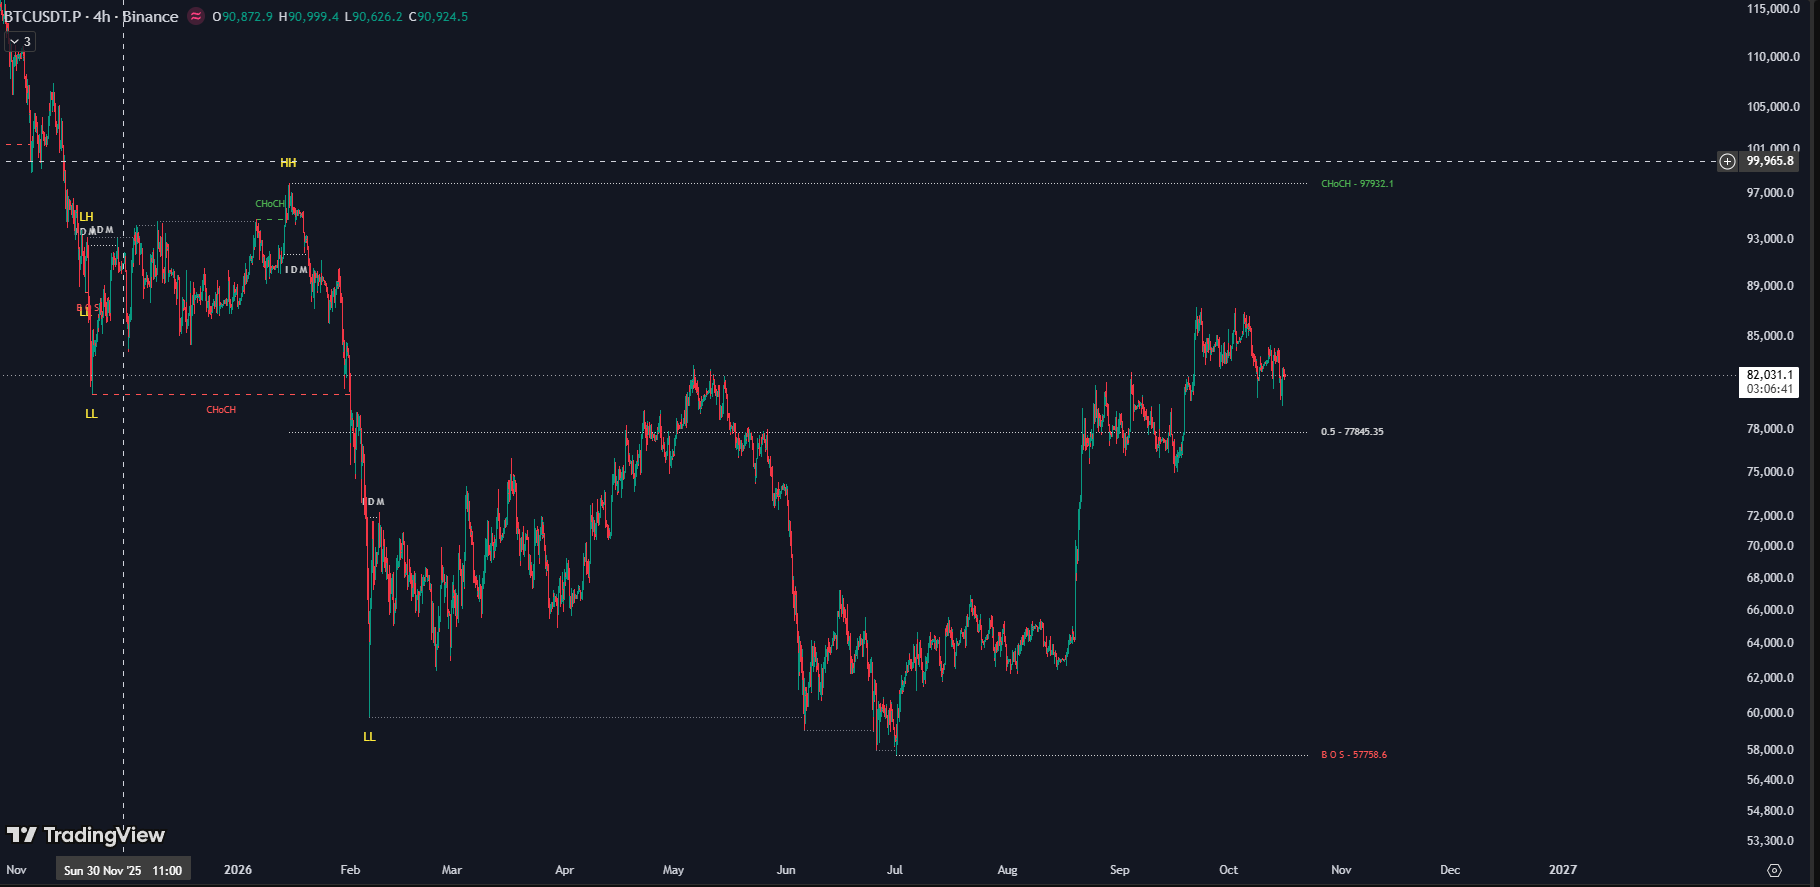
This is JUKA live on BTC 4H — every swing, BOS, CHoCH, IDM, and the premium/discount equilibrium labeled automatically, in real time.
No lagging arrows. No repainting — confirmed signals never move on closed bars. No hours of hand-drawing. The complete Trading Hub 3.0 source code (Pine Script v5) — yours to own forever, $99 one-time.
Get JUKA Source Code — $99