ICT Part 0: What Is a PD Array? What Is OTE? What Is a POI?
To open the ICT series, we will learn about the PD Array and OTE. These are two important concepts to start with before the following parts.
What is a PD Array in ICT?
The PD Array (Premium and Discount Arrangement) is a technical element used to identify potential entry points based on the current price position relative to the Premium (high) and Discount (low) price zones.
The PD Array is used as a checklist to help traders identify potential entry points in the market.
It is a tool that helps traders assess whether they should buy or sell, and at which price zone, in order to gain a price advantage.
How to identify a PD Array
To accurately identify the PD, you need to use the Fibonacci Retracement tool with the following settings:
- 1 – Start point
- 0.5 – Equilibrium point
- 0 – End point
Then, draw the Fibonacci from an old high to an old low – these are price zones that have been clearly established on the chart.
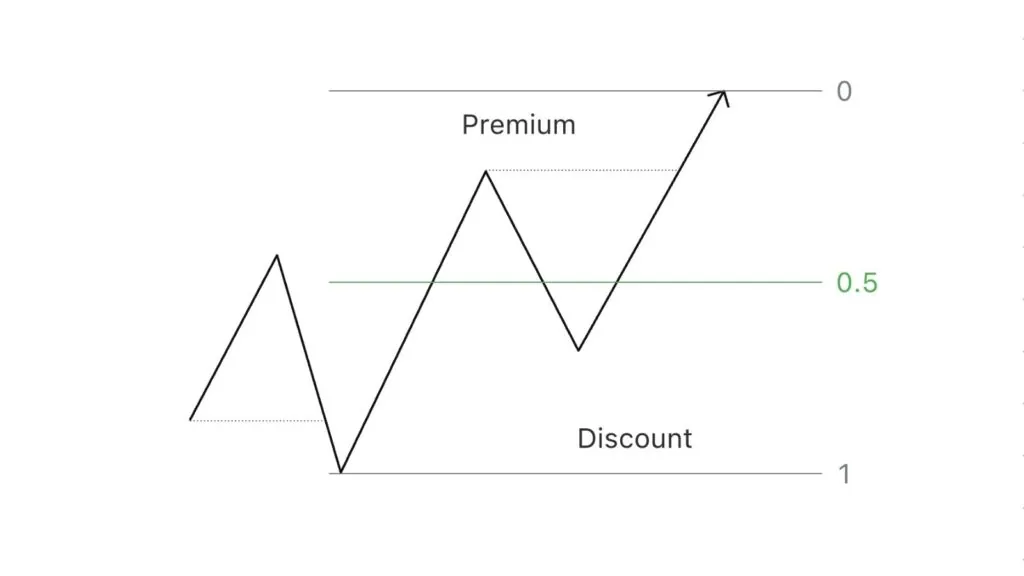 How to identify a PD Array
Explaining the PD Array zones
- The 0.5 level in Fibonacci is called the Equilibrium zone (state of balance).
- The zone above the 0.5 level is the Premium Zone – an area that tends toward selling because price is being valued higher than its fair value.
- The zone below the 0.5 level is the Discount Zone – an area considered a buying opportunity because price is cheaper than its actual potential.
Within the PD Array there are separate components that we will use throughout the trading process with ICT.
What is OTE in the ICT method?
OTE (Optimal Trade Entry) refers to the optimal entry points within the PD Array for joining a trade position, identified by using Fibonacci.
When price finishes forming a low or a high, there is usually a deep and clear pullback before it continues moving in the previous trend direction.
The 62% and 79% levels on Fibonacci are the ideal levels, of which 70.5% is considered the sweet spot (the most optimal).
| Levels | Meaning |
|---|---|
| 0 | Stop loss relocation point |
| 0.5 (50%) | Equilibrium point |
| 0.62 (62%) | Entry #1 |
| 0.705 (70.5%) | Entry #2 |
| 0.79 (79%) | Entry #3 |
| -0.27 (-27%) | Target #1 |
| -0.62 (-62%) | Target #2 |
| -1 (-100%) | Symmetrical swing |
| -2 (-200%) | Final Target |
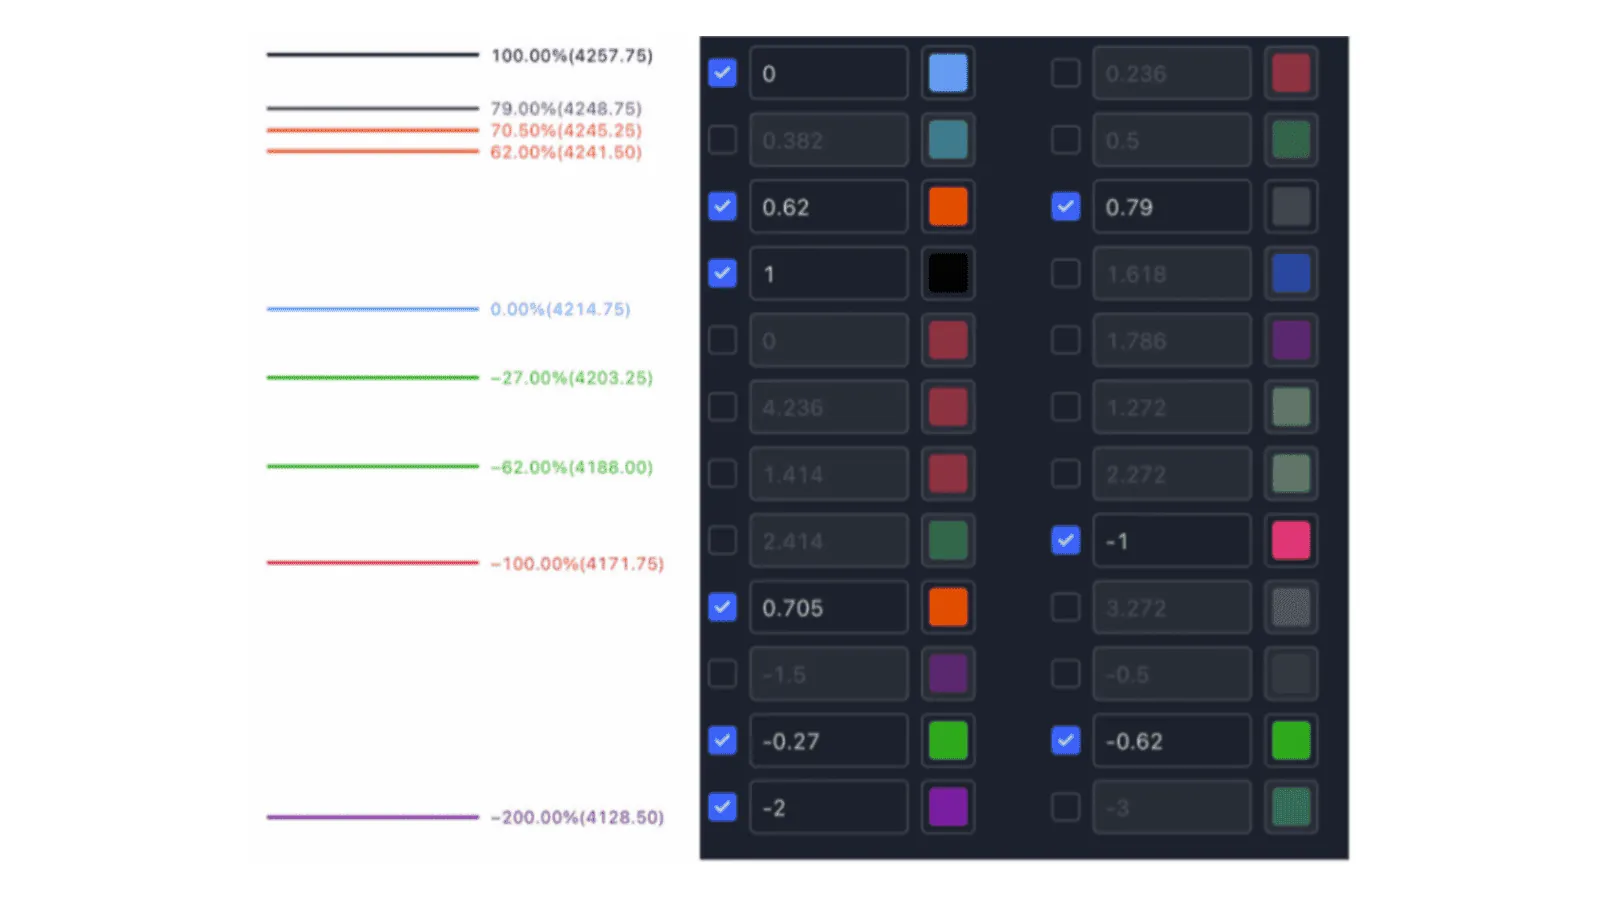 Fibonacci OTE settings
The OTE zone lies in the Premium zone if we are considering a sell (short) trade, and lies in the Discount zone if we are considering a buy (long) trade.
Steps to apply OTE
Step 1: Market structure
Is the market trending up or down? This is very important because Fibonacci levels work most effectively in a trending market.
Step 2: Identify the swing
Identify the swing highs and swing lows to draw the Fibonacci grid. These highs/lows are usually visually prominent and easy to mark.
Step 3: Draw the Fibonacci Retracement
- In an uptrend, draw from the low to the high.
- In a downtrend, draw from the high to the low.
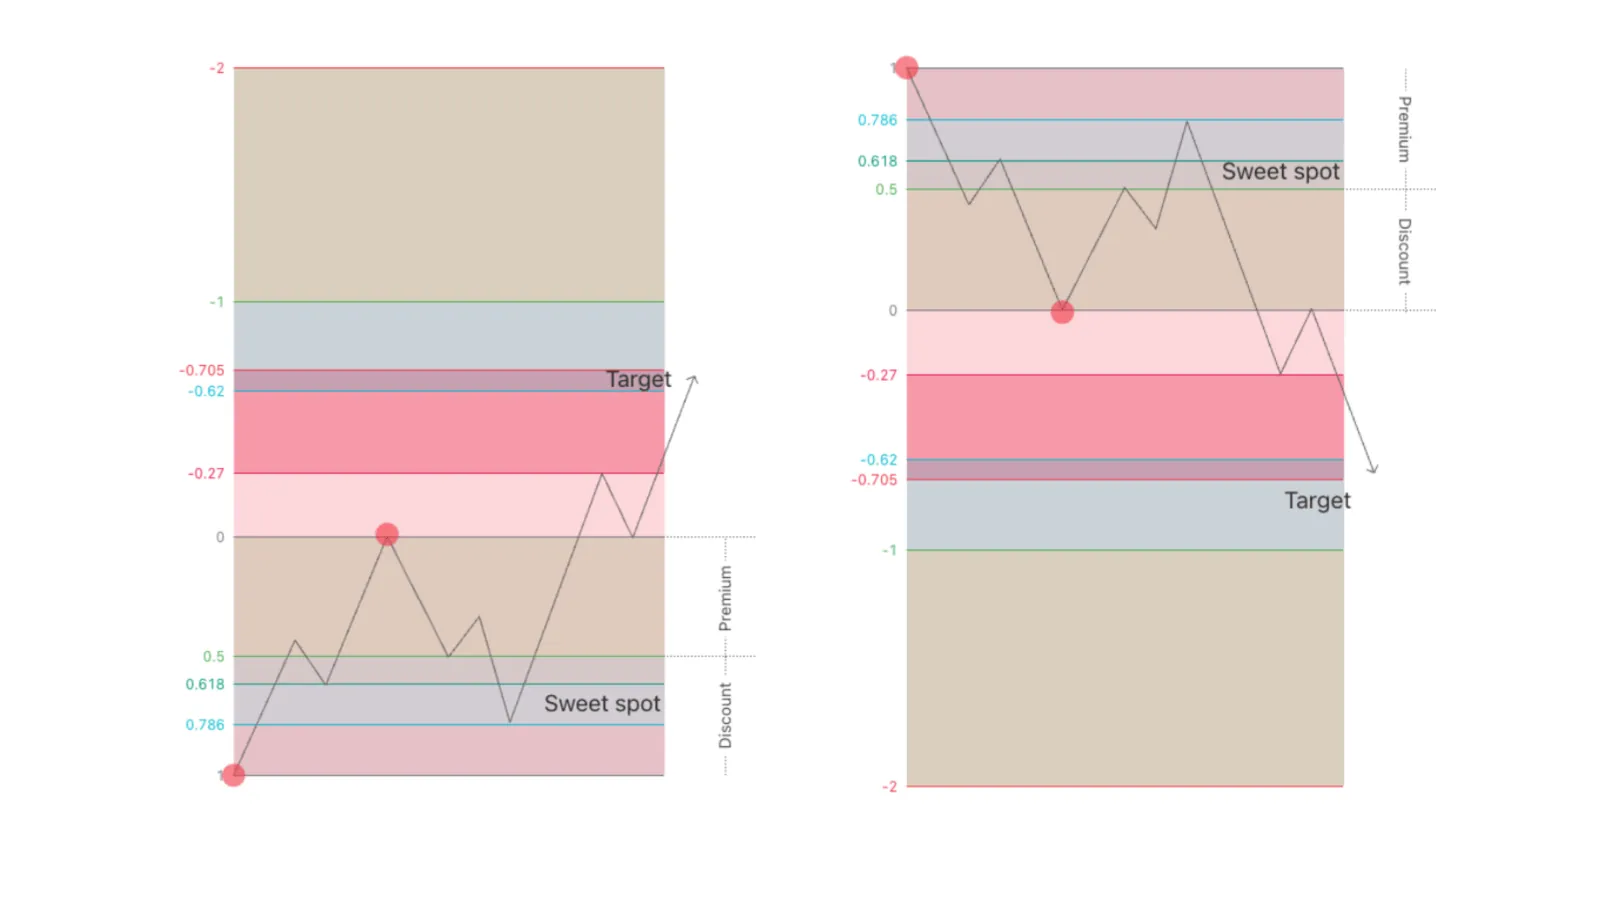 Drawing the Fibonacci OTE
From the zone where OTE coincides with a POI, price bounced up strongly, giving us an excellent entry point with a very high reward-to-risk (R/R) ratio.
How OTE works
OTE is an important tool for finding entry points with a high R/R ratio.
The golden rule in trading: after a main leg of the market, there will definitely be a pullback.
Nothing rises forever; price needs to pull back to attract liquidity below.
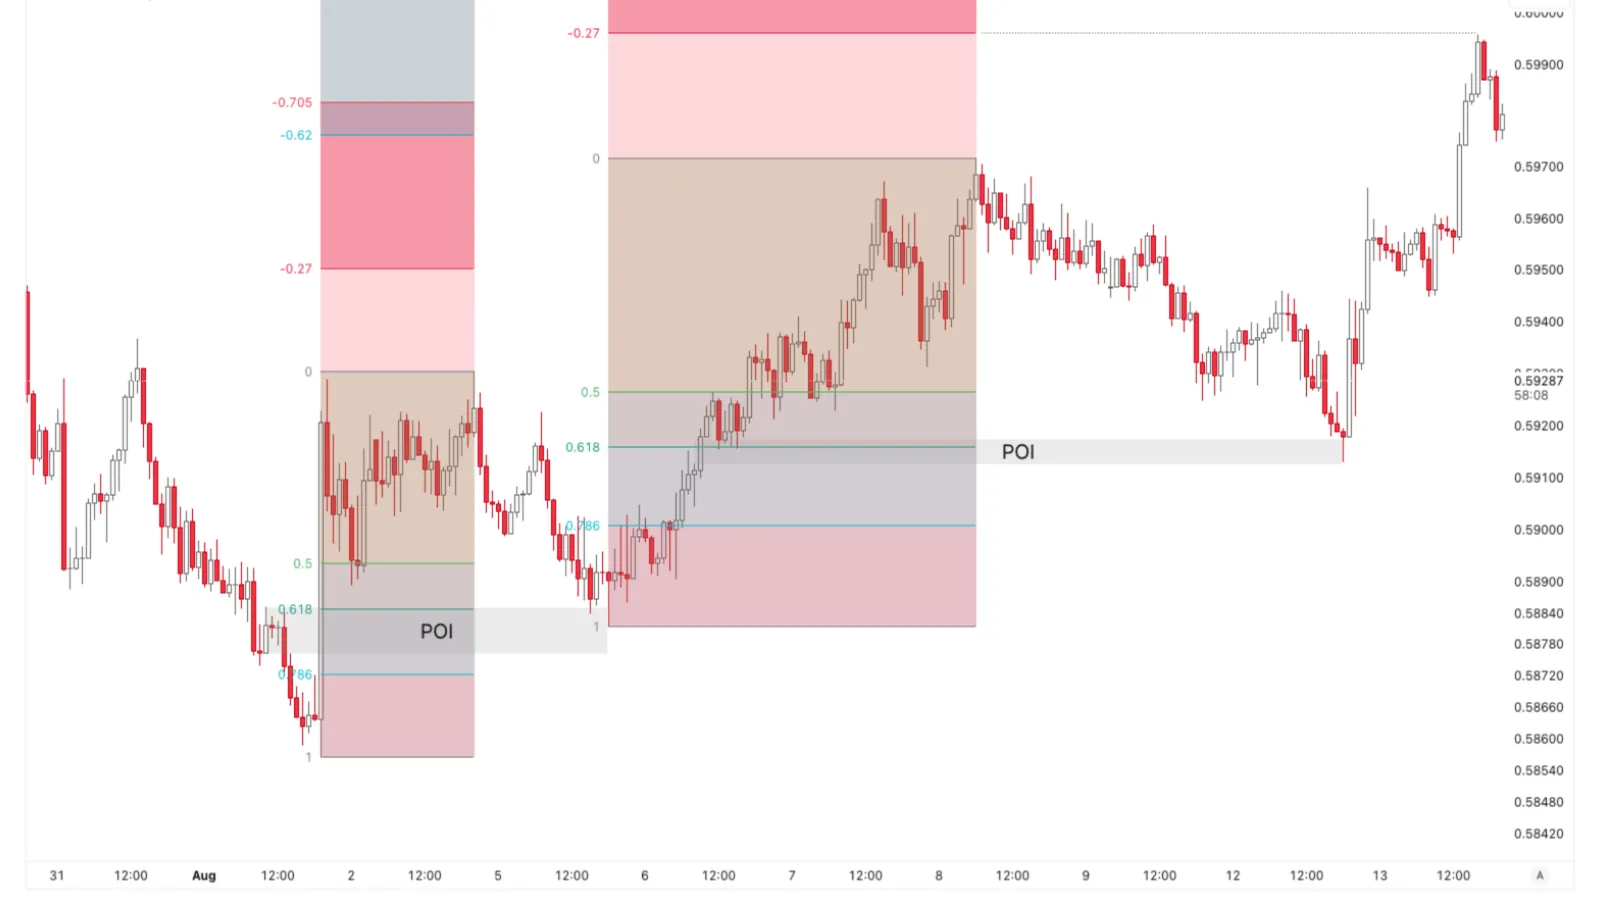 Trading with OTE
- The 50% (0.5) level is the most important, and sooner or later price tends to return to this zone.
- Besides the 0.5 level, the 0.62 and 0.79 levels are also important, because most technical analysts usually place their stop loss behind these levels on the Fibonacci grid.
These Fibonacci levels are not always “magical” and do not work everywhere.
We must combine OTE to look for POI confluences such as FVG, OB, etc.
What is a POI?
A POI is a Point of Interest of Smart Money, where they accumulate their orders. Large traders will defend their entry area.
A POI can be:
Which POIs are the strongest?
There is no concept of one POI zone being stronger or weaker than another.
Each POI level is strong in its own way.
There are cases where many POIs appear and make you hesitate. For example, an OB and an FVG appearing at the same time.
What matters is to wait for a confirmation signal on a lower timeframe.
Which POI should you choose?
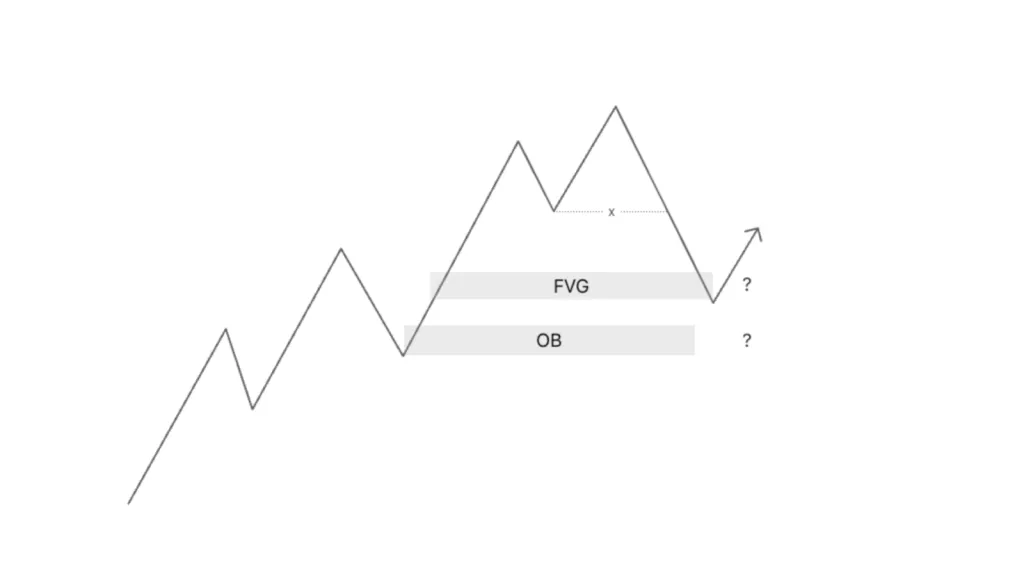 Which POI is stronger?
Example: We are observing on the H1 timeframe and see two bearish POIs: an FVG and an OB. Even an experienced trader could ask: How do I know which zone to trade? Of the two zones, which will be stronger?
→ Both zones are strong, and you should wait for a confirmation signal on a lower timeframe.
Common timeframe combinations used:
- m15 → m15 (or m1)
- H1 → m15 (or m5)
- H4 → H1 (or m15)
- D1 → H4 (or H1)
When moving down to the LTF, look for confirmation (CE) such as BOS, CHoCH, sweep, etc. before entering a trade.
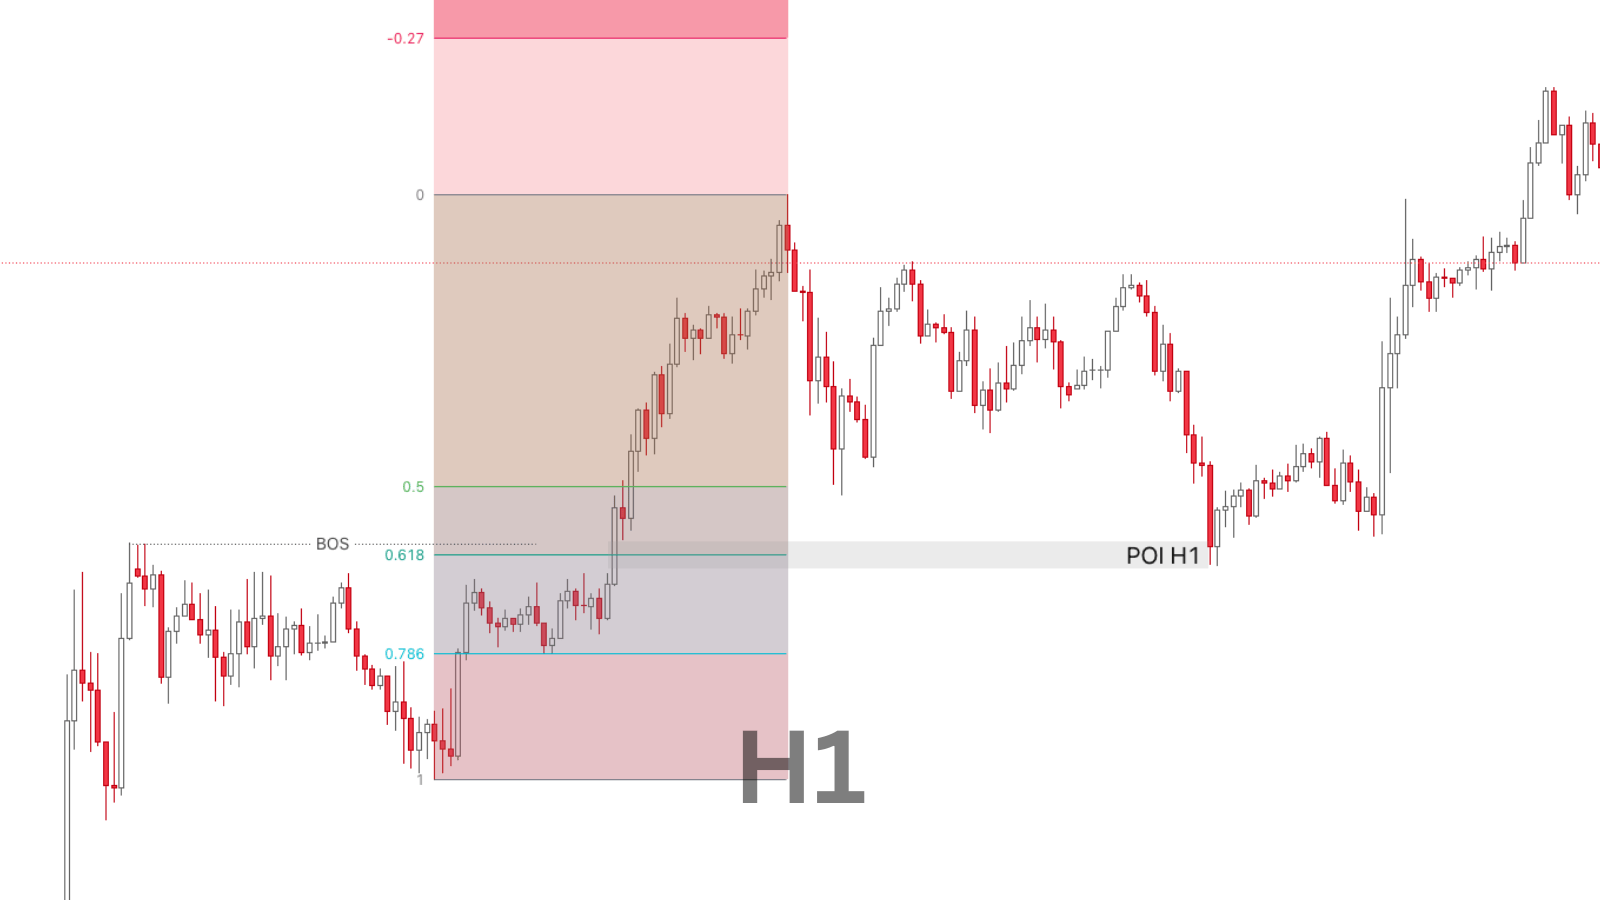 POI on H1
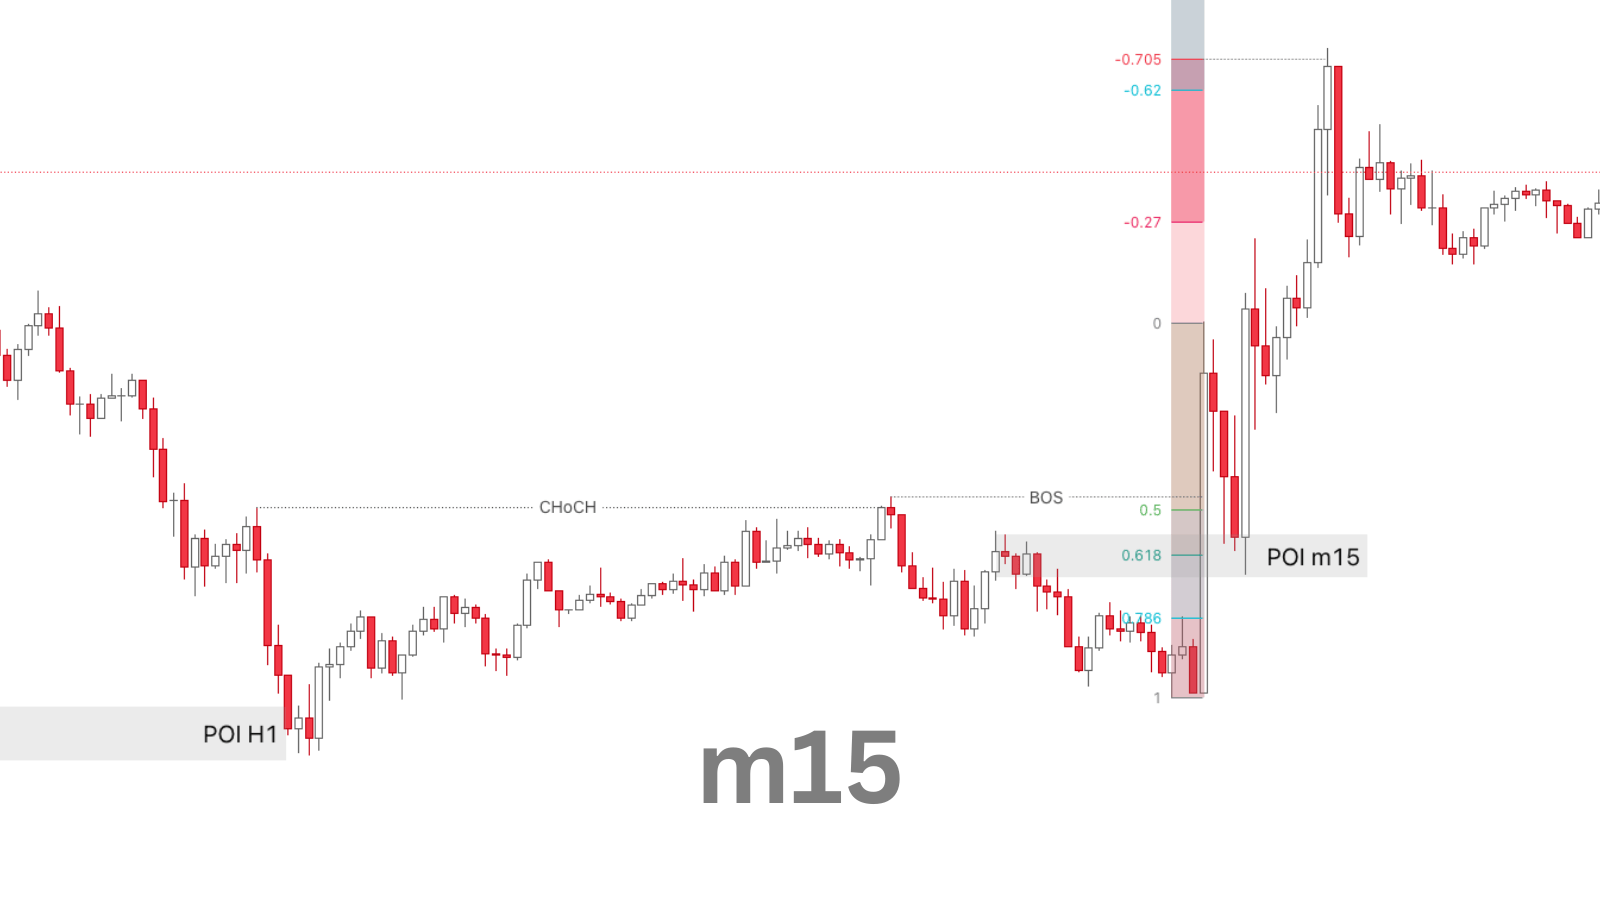 POI on m15
Note that the larger the timeframe (>m15), the higher the win rate.
5/5 - (10 votes)
Read structure 10x faster with JUKA
JUKA maps SMC structure — swings, BOS, CHoCH and inducement zones — automatically on any TradingView chart. No more hand-drawing structure for hours.
Get JUKA — $150