ICT Part 1: Block Types in ICT – OB, BB, RB, MB, VB, PB, OF
The Block types in ICT include: Order Block, Reclaimed OB, Breaker Block, Rejection Block, Mitigation Block, Vacuum Block, Propulsion Block. All of these blocks lie within an Order Flow.
These are all POI zones concentrating a large volume of trading orders from large institutions, so when price returns to tap into them, institutions tend to defend their positions.
What is an Order Block?
An Order Block (OB) according to ICT is the candle formed immediately before a strong move in the opposite direction, reflecting the presence of large institutions. The appearance of an Order Block usually signals the potential for a strong reversal or a continuation of the market trend.
In the ICT PD Array system, the OB plays a key role in helping traders identify entry points with a high probability of success.
Note: We can identify the entire candle or only the candle body as the OB.
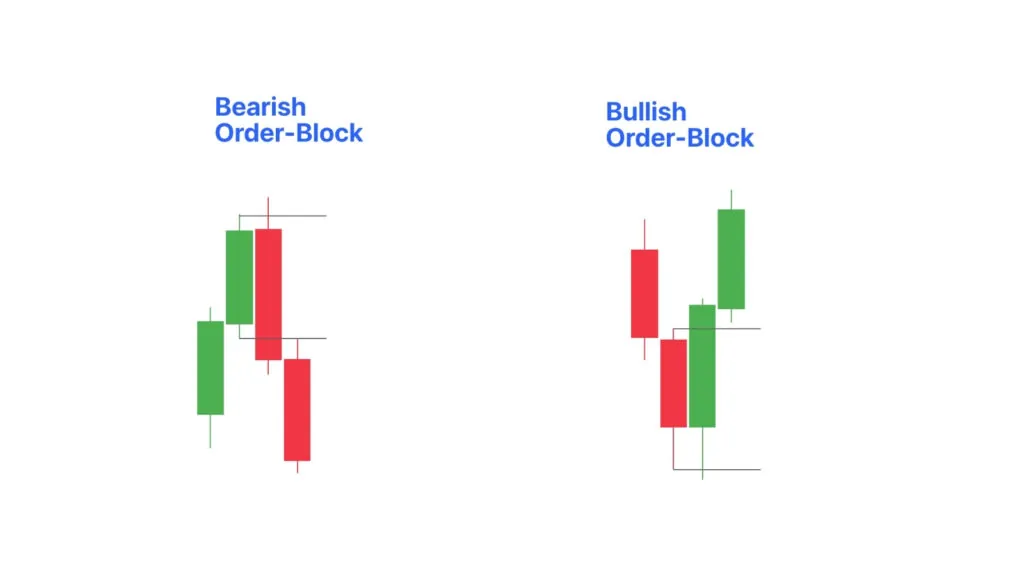 What is an ICT Order Block?
Bullish Order Block
A Bullish Order Block is the last bearish candle before a strong price increase occurs. Typically, it consists of two candles:
- First candle: Bearish
- Second candle: Bullish and creating strong momentum.
Conditions for identifying a valid Bullish Order Block:
- The second candle (the bullish candle) must sweep the liquidity of the previous candle's wick.
- That bullish candle must close above the high of the previous bearish candle.
- There is an imbalance on the LTF at the Order Block zone.
- An MSS appears on the LTF.
In summary: The second bullish candle needs to completely engulf the previous bearish candle, in both candle body and candle wick.
Bearish Order Block
A Bearish Order Block is the last bullish candle appearing immediately before the market makes a strong price drop. The typical pattern of a Bearish Order Block consists of two candles:
- First candle: Bullish
- Second candle: Bearish
Conditions for identifying a valid Bearish Order Block:
- The second candle (the bearish candle) must break the high of the previous bullish candle – i.e. price must exceed the high of the bullish candle, expressing a liquidity sweep action.
- This bearish candle must close below the low of the previous bullish candle, showing the real strength of the sell side.
- An Imbalance appears on the LTF at the Order Block zone.
- A Market Structure Shift appears according to ICT theory, also on a lower timeframe.
In summary: The second bearish candle needs to completely engulf the first bullish candle, from body to wick.
What makes a strong Order Block?
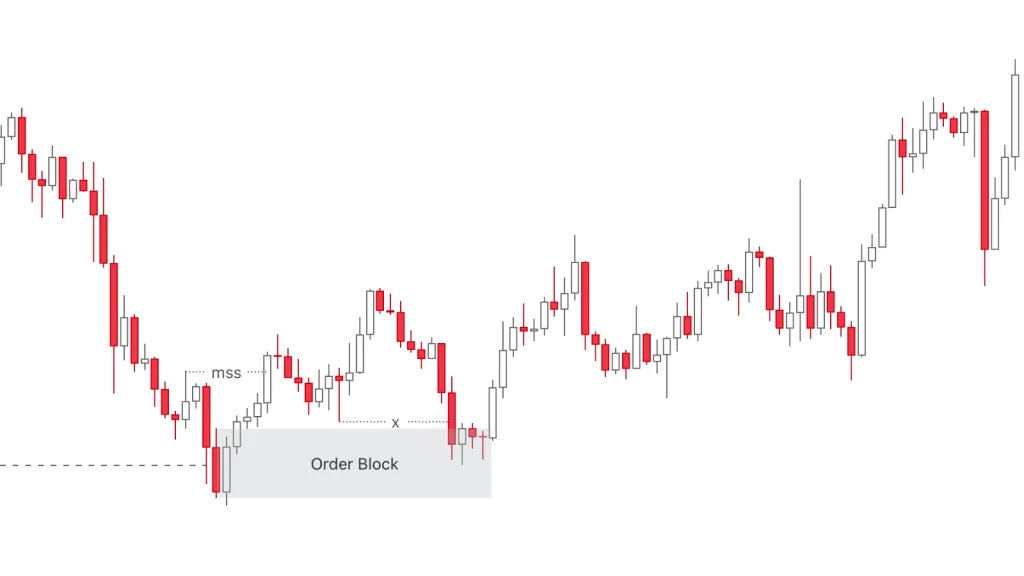 Example of a strong Order Block
A strong OB:
- Forms at a swing high/low, in zones of large liquidity.
- Sweeps the stop losses of retail traders before reversing.
- Has short-term liquidity created after that OB (IDM).
Order Blocks in ICT differ from those in Trading Hub, although they share the same nature.
In Trading Hub, a valid Order Block must be accompanied by an IMB. In my experience, we can absolutely use both types of OB to trade.
What is a Reclaimed Order Block?
A Reclaimed Order Block is an Order Block accumulated early by institutions to hedge against risk; we see a small counter-trend price displacement at this area.
Afterward price reaches a PD Array on the HTF and begins to reverse the trend; the Reclaimed OBs then become resistance/support zones for price movement.
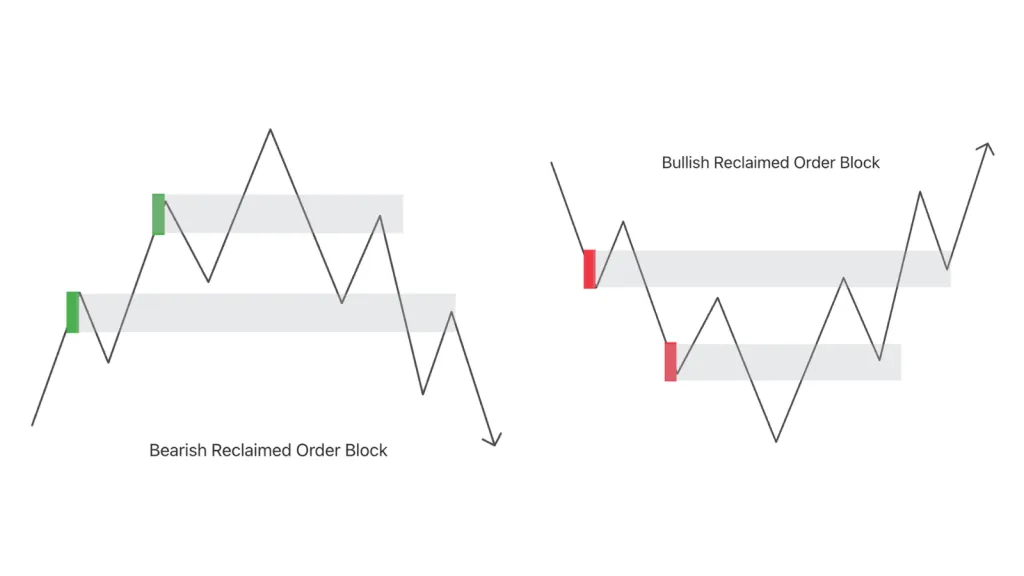 What is a Reclaimed OB?
- Bearish Reclaimed Order Block – a previous candle bar that was used by the MM to accumulate selling, creating a slight short-term drop. On the Sell side of the Curve, these OBs become resistance pushing price down.
- Bullish Reclaimed Order Block – a previous candle bar that was used by the MM to accumulate buying, creating a slight short-term bounce upward. On the Buy side of the Curve, these OBs will become support pushing price up.
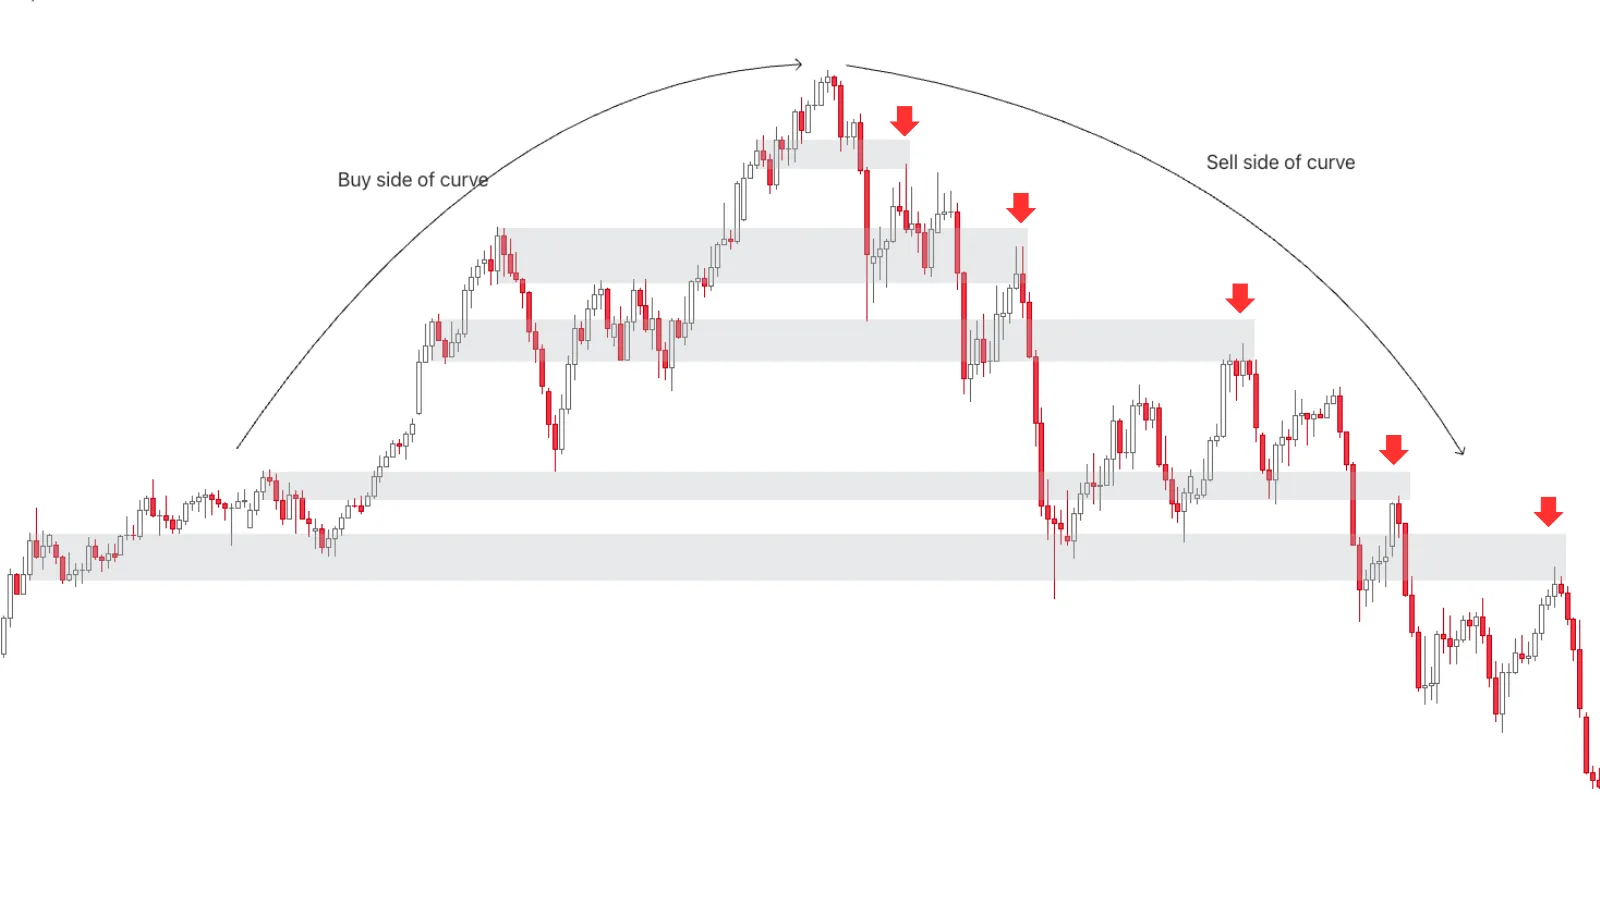 Example of a Bearish Reclaimed Order Block
Reclaimed OBs are used in the Market Maker Model (MMSM & MMBM) that we will learn in the following chapters.
What is a Breaker Block?
A Breaker Block (BB) in ICT is a failed Order Block, broken after a stop hunt or liquidity sweep phenomenon occurs.
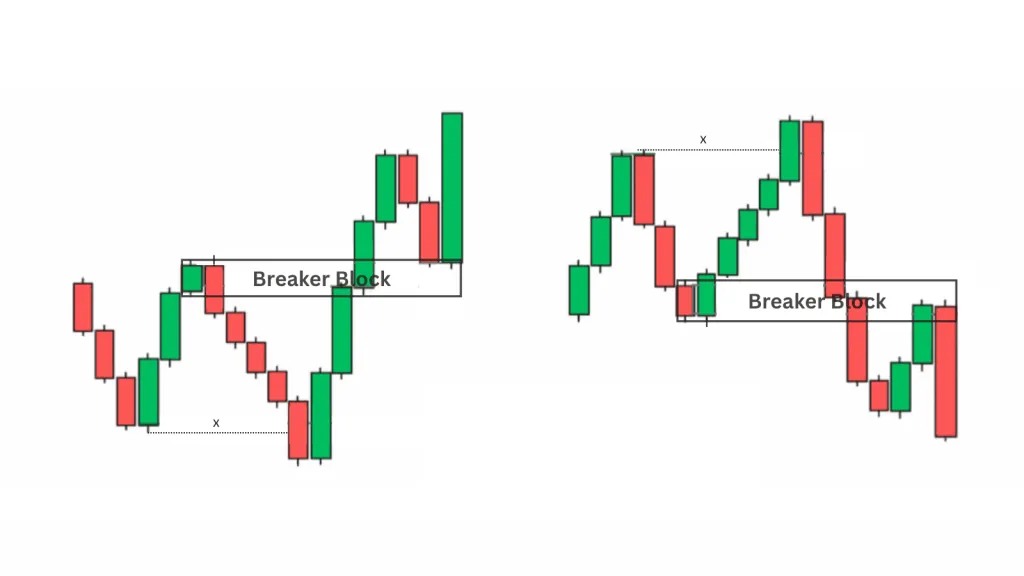 What is a Breaker Block?
It forms when an Order Block fails to hold price and is broken, then plays the role of a new support or resistance zone, creating conditions for price to continue moving in the opposite direction.
When an Order Block forms counter to the main market trend, the probability of failure of that Order Block is very high. And when it fails, it becomes a Breaker Block.
Operating mechanism:
- After sweeping stop-loss orders, Smart Money changes the price direction.
- Price breaks through the Order Block creating an MSS (structure break); the Order Block converts into a Breaker Block.
- After the trend reverses, price usually returns to tap into the BB to close the initial losing positions and reinforce the new trend.
Bullish Breaker Block
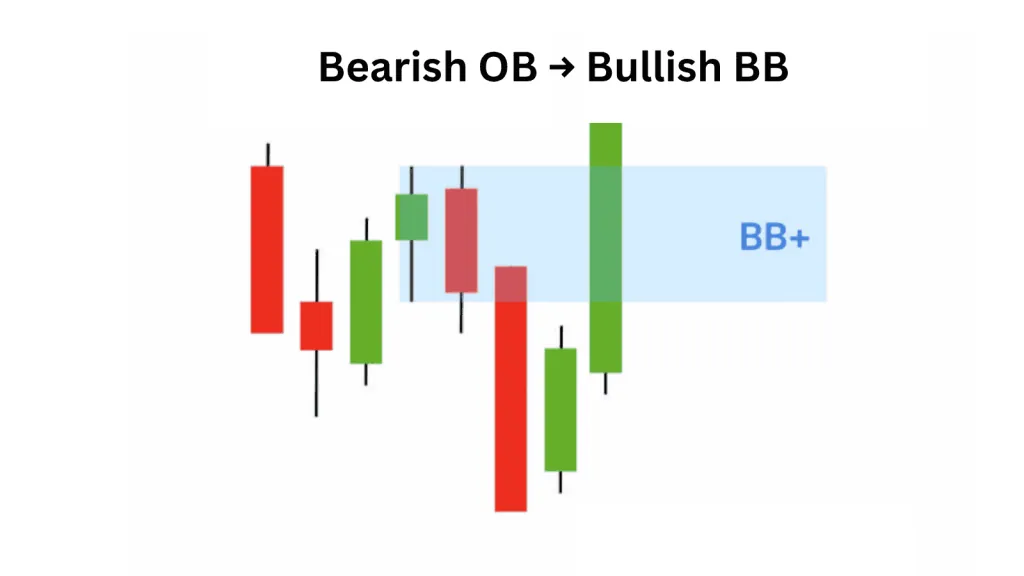 How a bullish BB forms
In a downtrend, price sweeps the liquidity of an old low (LL) and then reverses, breaking up higher than the nearest high (HH). At that point the Bearish Order Block becomes a new support zone helping price bounce up, called a Bullish Breaker Block.
Main structure: Low → High → Lower Low → Higher High.
Conditions to confirm a valid Bullish Breaker Block:
- Liquidity Sweep – the action of sweeping liquidity at the nearest high.
- The appearance of a valid Bearish Order Block.
- Price closes above the high of the Bearish Order Block.
- There is an MSS in the bullish direction on the LTF.
Bearish Breaker Block
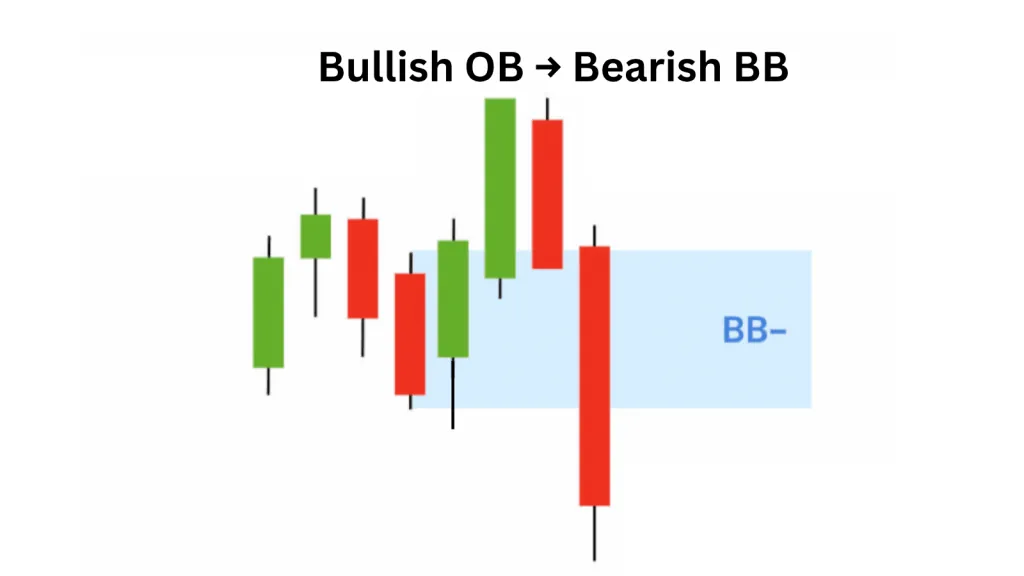 How a bearish BB forms
In an uptrend, price sweeps the liquidity of an old high (HH), then falls strongly, breaking through the nearest low (LL). At that point, the Bullish Order Block becomes a new resistance zone pushing price down, called a Bearish Breaker Block.
Main structure: High → Low → Higher High → Lower Low.
Conditions to confirm a valid Bearish Breaker Block:
- There is a Liquidity Sweep phenomenon – sweeping liquidity at the previous low.
- The presence of a valid Bullish Order Block.
- Price closes below the low of the Bullish Order Block.
- There is an MSS in the bearish direction on the LTF.
Trading strategy with Breaker Blocks
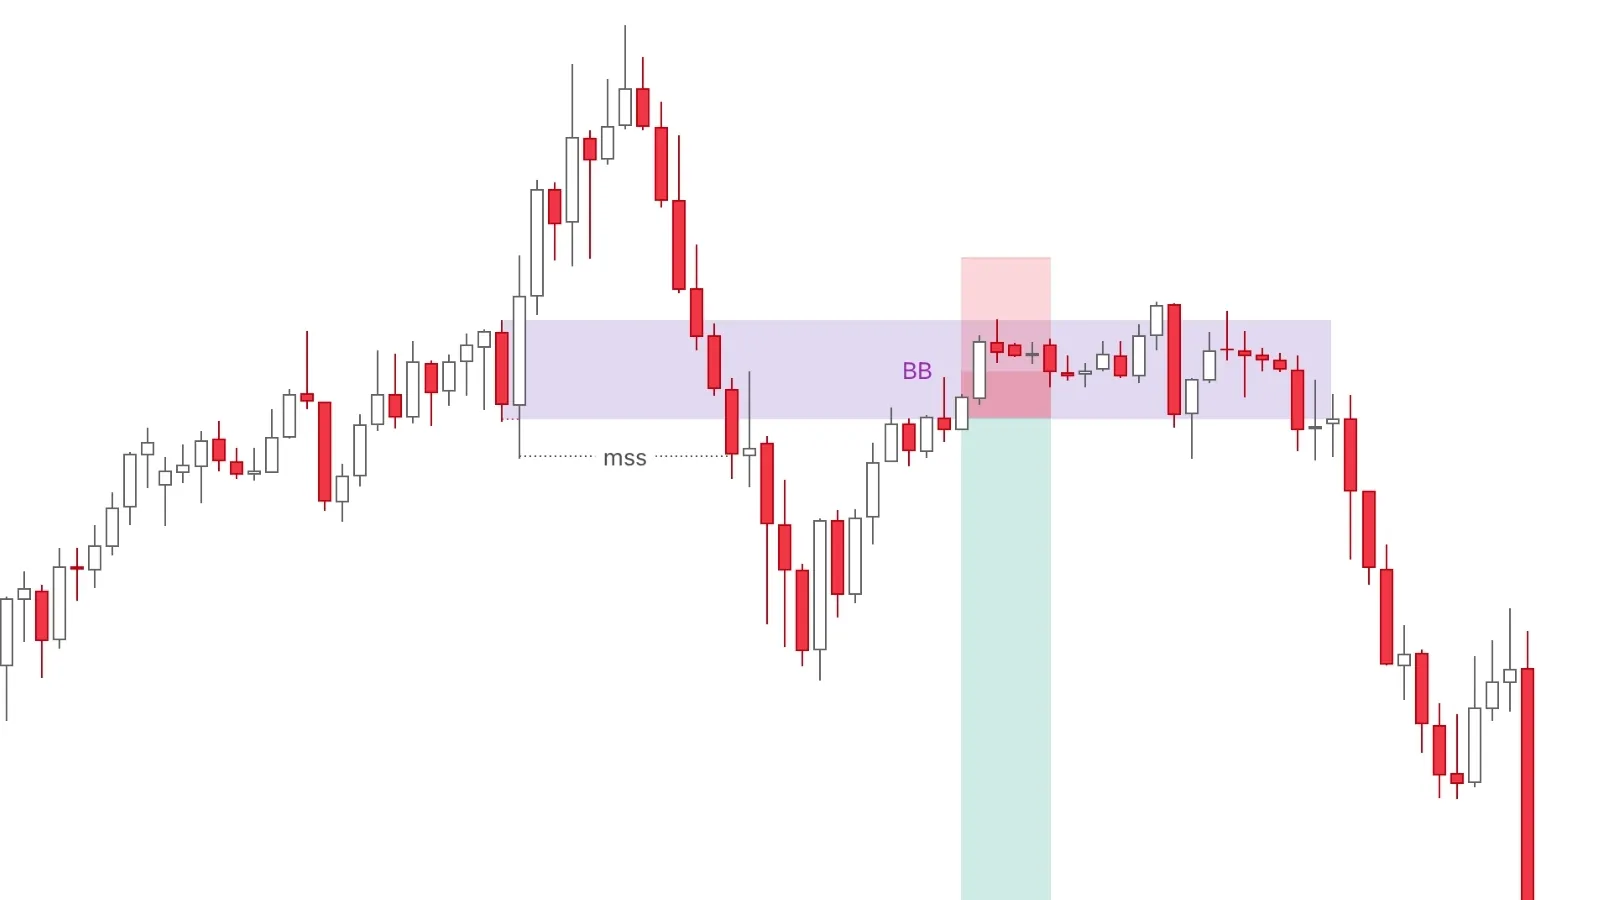 A Bearish BB becomes a resistance zone pushing price down
In a downtrend:
- A Bullish Order Block appears: It is a trap to lure the sell side in.
- Price breaks the low of the OB: A sign of a liquidity sweep and a change in market structure (Market Structure Shift).
- Role reversal: The Bullish Order Block fails → becomes a Bearish Breaker Block.
- Wait for price to tap into the BB again: This is the short entry.
- Place the Stop Loss: Above the high of the BB.
The reverse is similar for an uptrend.
What is a Rejection Block?
A Rejection Block (RB) in ICT is a candle pattern that occurs when price sweeps through an old high/low, creating a long candle wick and changing market structure (MSS).
The candle wick acts as a counter-trend Order Block.
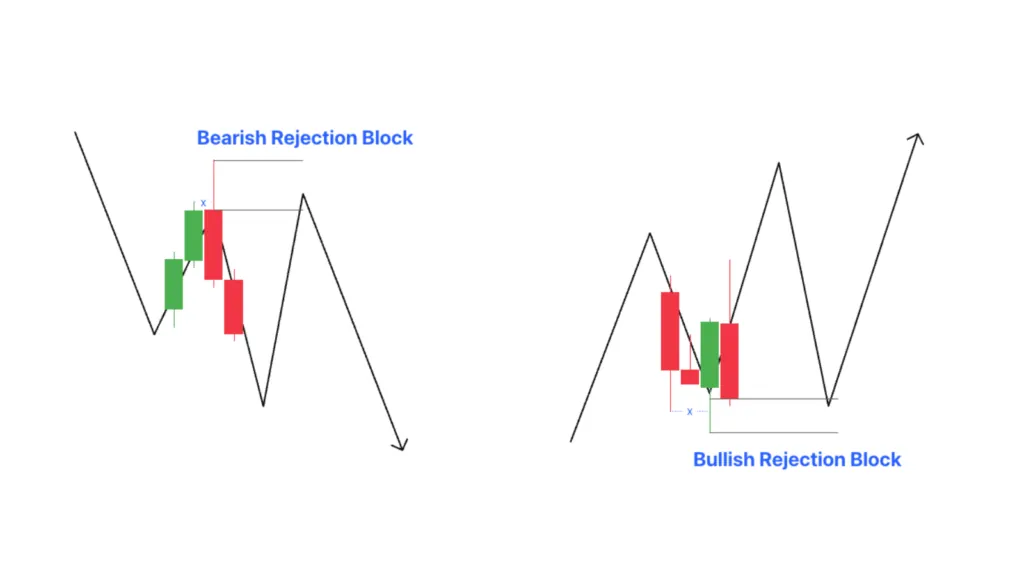 What is an RB?
Bullish Rejection Block
Identifying characteristics:
- Price sweeps through an old low (liquidity sweep).
- A low forms with one or more long lower candle shadows.
- Market structure shifts to an uptrend after the low forms.
How to trade:
- Identify the distance from the lowest wick to the lowest candle body — that is the RB.
- Wait for price to return to tap into the RB.
- Enter a buy order when price rejects and moves up out of the RB.
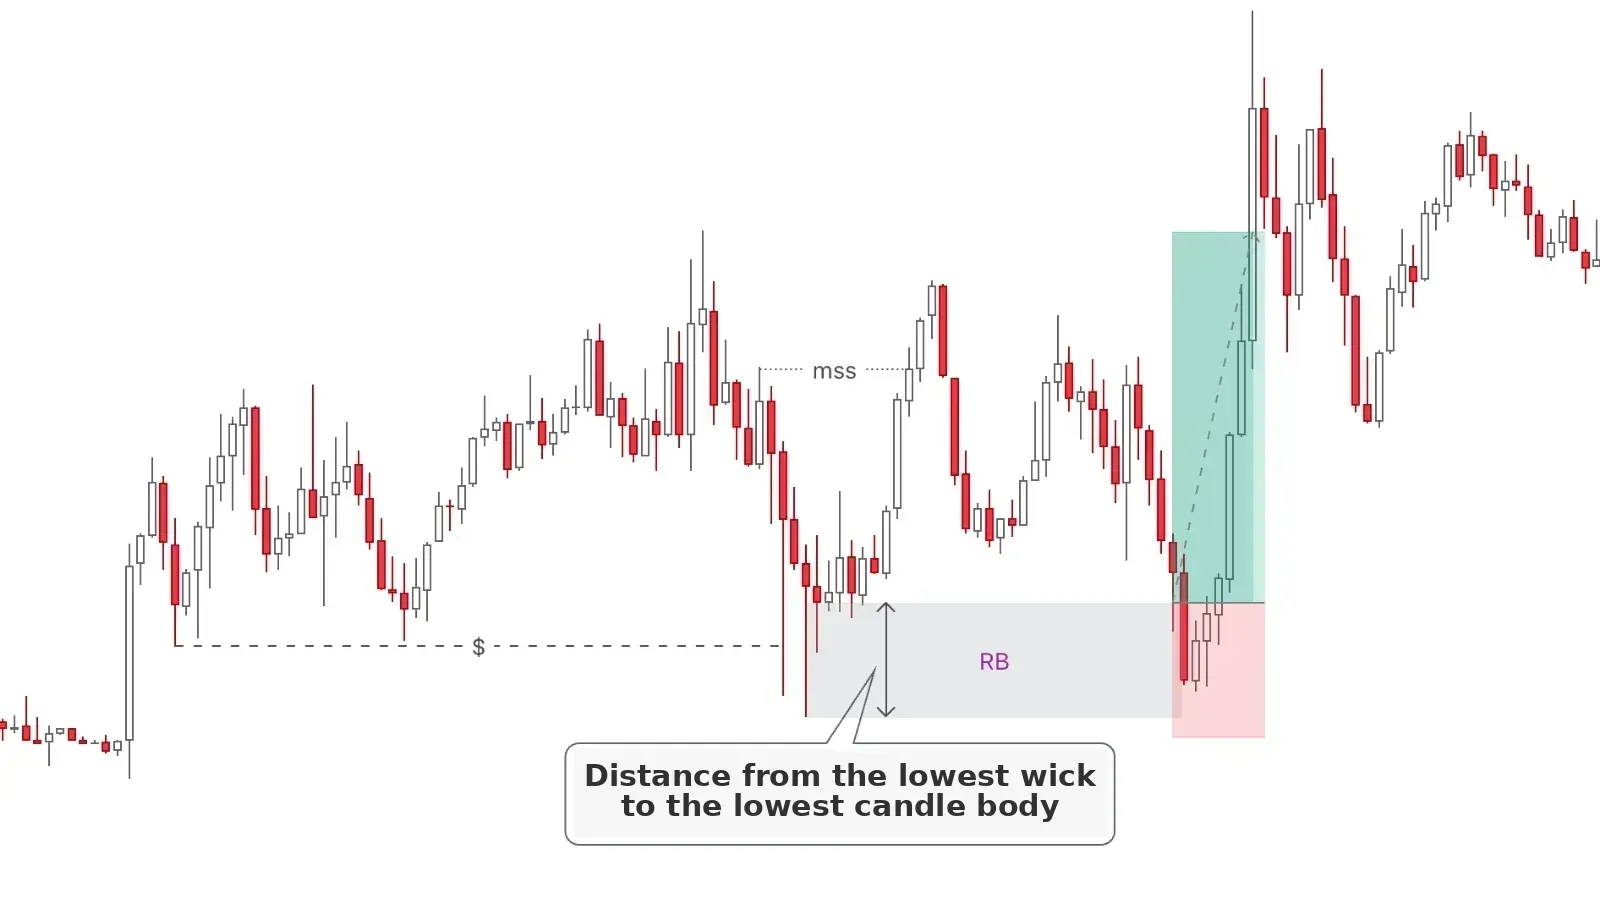 How to enter a trade with a Bullish Rejection Block
Bearish Rejection Block
Identifying characteristics:
- Price forms a high with one or more long upper candle wicks.
- Structure shifts to a downtrend after creating the high, expressing distribution from “smart money”.
How to trade:
- Identify the distance from the highest candle wick to the highest candle body — that is the RB.
- Wait for price to return to tap into the RB.
- Enter a sell order when price rejects and turns back down out of the RB.
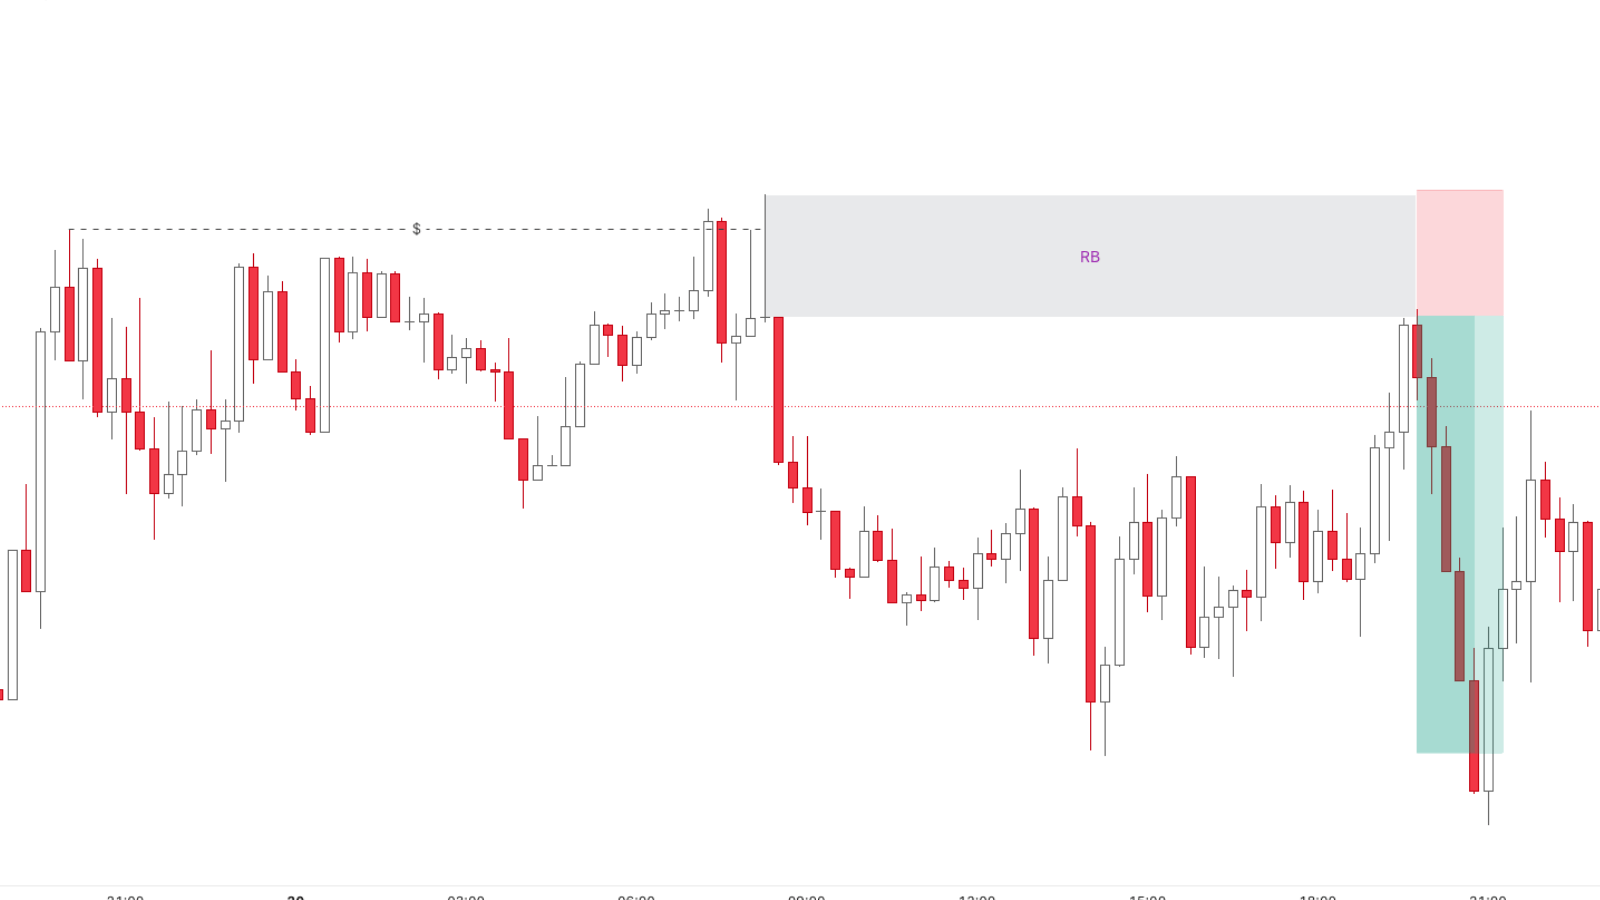 How to enter a trade with a Bearish RB
What is a Mitigation Block?
A Mitigation Block (MB) is a reversal pattern that forms when the market cannot create a higher high or a lower low.
A Mitigation Block is the result of a failed Swing, in contrast to a Breaker Block, which appears when a Swing breaks successfully.
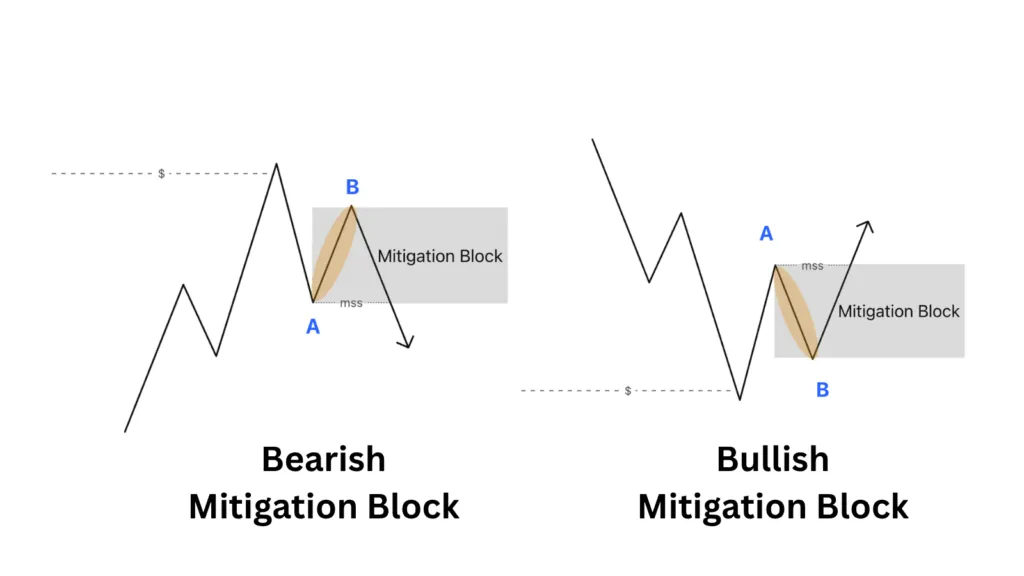 What is a Mitigation Block?
Bearish Mitigation Block
A Bearish Mitigation Block appears at the end of an uptrend, when price approaches a strong supply zone or buy-side liquidity from large institutions. Price creates a new lower high (LH), with no Liquidity Sweep.
Signs to recognize a Bearish Mitigation Block:
- Price creates an HH → then corrects down creating an LH.
- Price breaks the HL, confirming a change in market structure (MSS).
- The entire failed bullish wave becomes a Bearish Mitigation Block.
- A Bearish MB is a zone that price can return to test before falling further.
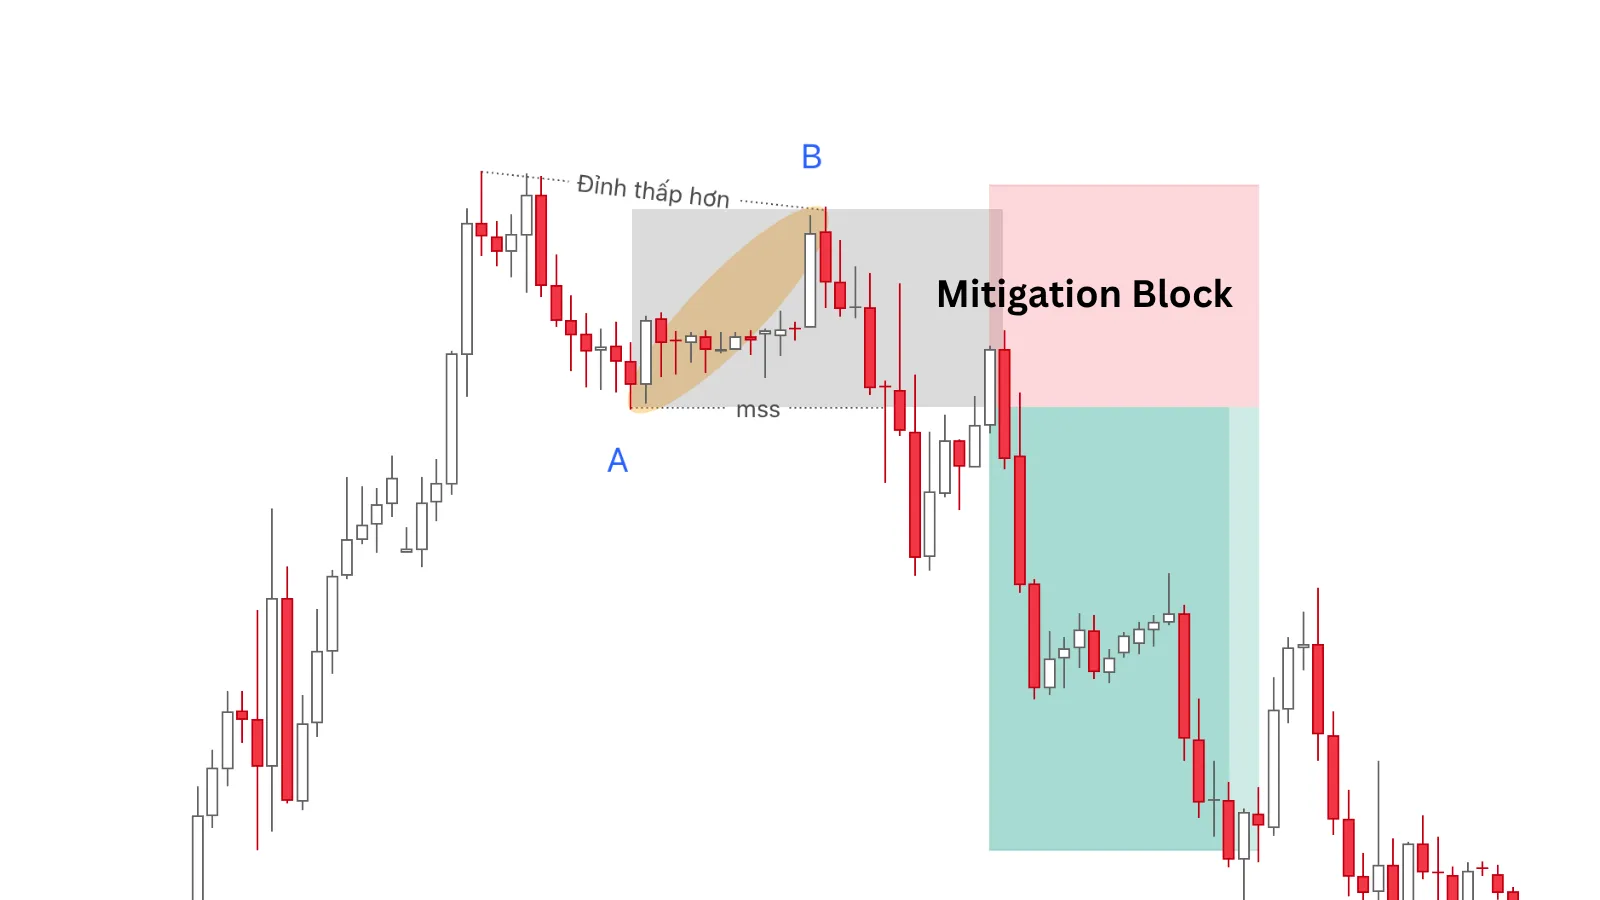
In the chart, the zone from point A (the broken HL) to point B (Lower High) is the Bearish Mitigation Block – a potential resistance zone for sell orders.
Bullish Mitigation Block
A Bullish Mitigation Block forms at the end of a downtrend, when price approaches a strong demand zone or sell-side liquidity from large institutions. Price creates a new higher low (HL), with no Liquidity Sweep.
Signs to recognize a Bullish Mitigation Block:
- Price creates an LL → then recovers up creating an LH.
- Price breaks the LH, confirming a change in market structure (MSS).
- The entire previous bearish wave becomes a Bullish Mitigation Block.
- A Bullish MB is a potential support zone for buy orders.
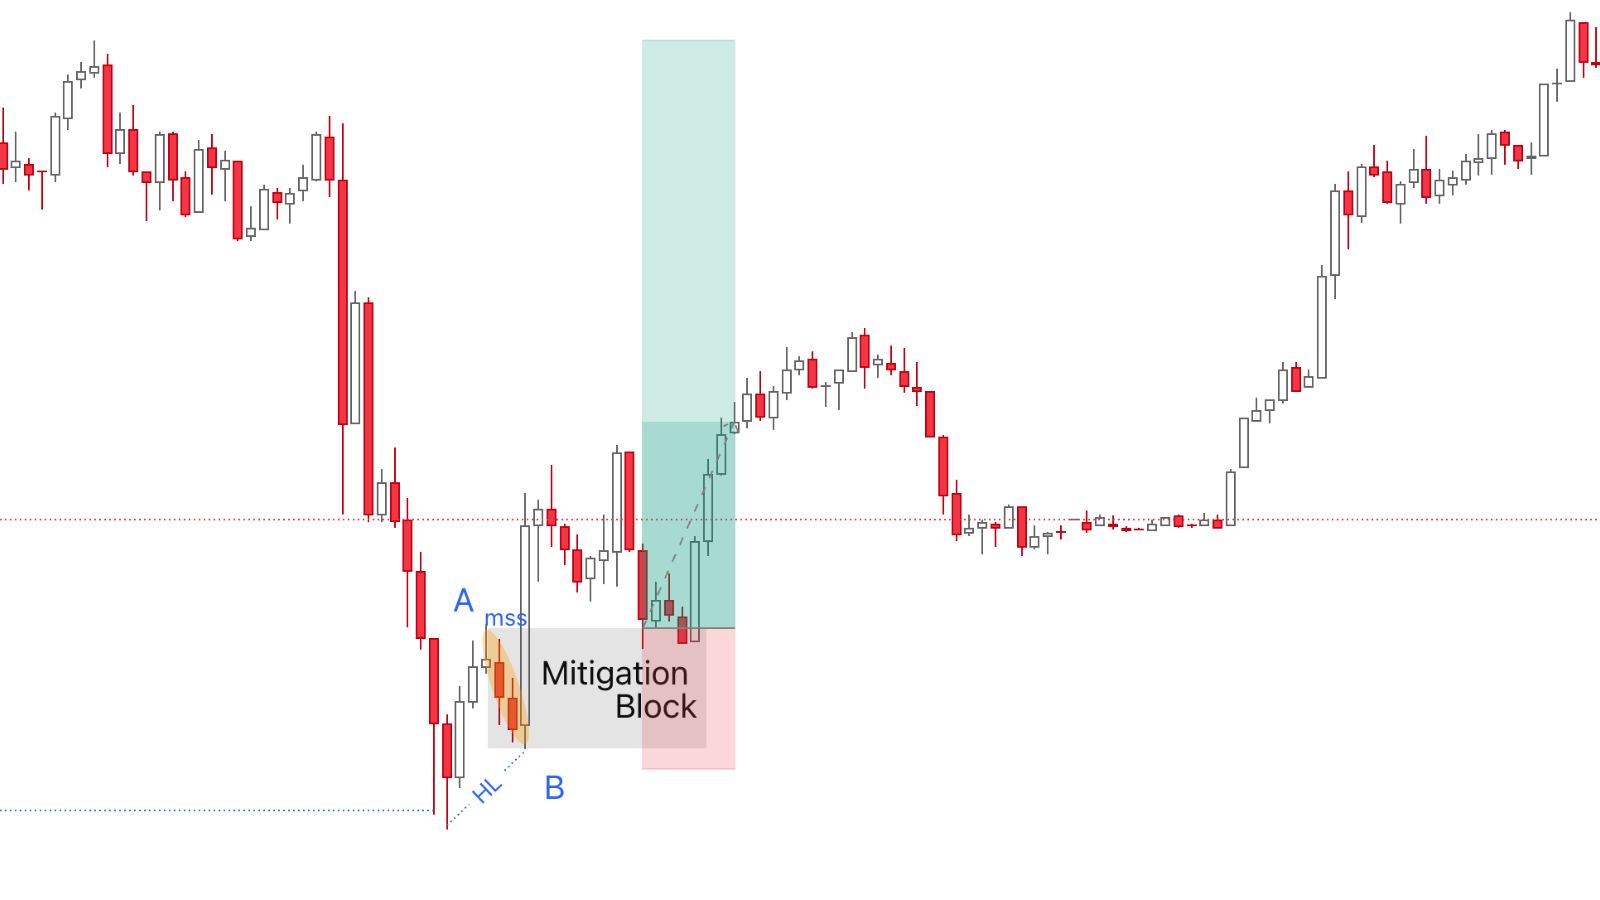 Entering a trade with a Bullish Mitigation MB
What is a Vacuum Block?
A Vacuum Block (VB) in ICT is a gap zone formed when the market experiences a high-volatility event, with no trades matched during that period because price moved too quickly, beyond traders' reactions.
This zone is called a Vacuum Block due to a severe shortage of liquidity. Such events can include:
- FOMC announcements
- NFP reports
- Geopolitical events such as war
- Session opens
- Weekend gaps
- …
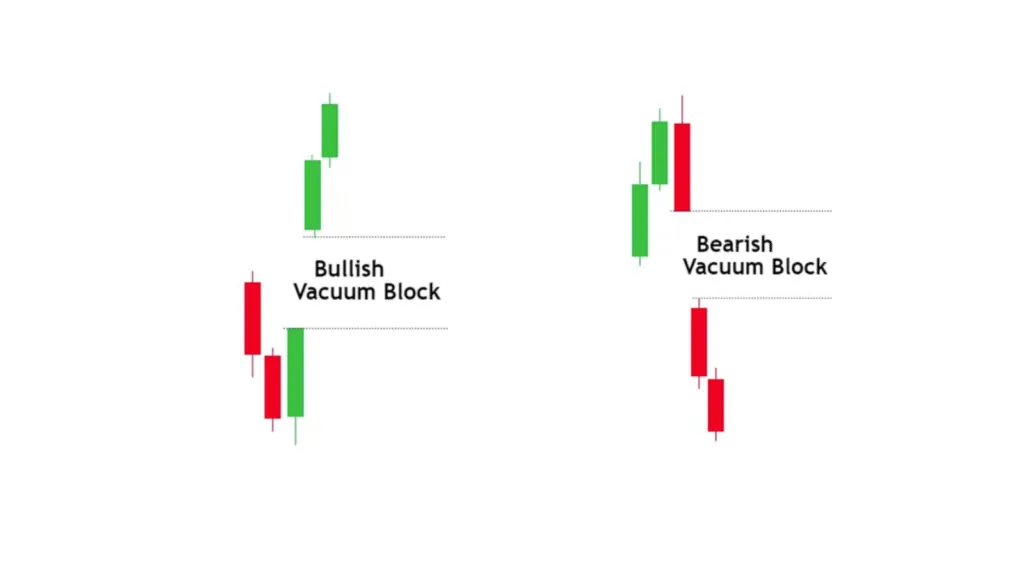 What is a Vacuum Block?
Volume Imbalance (VI): In the case where the bodies of two consecutive candles do not touch each other, but the wick parts intersect, we can call that a Volume Imbalance. VI shows a disparity in buy–sell volume.
Characteristics of the ICT Vacuum Block and Volume Imbalance
- Price may return to fill this empty zone (fill the gap) before continuing to move in the original trend direction.
- This is a zone with no order-matching activity, so the market needs to “reprice” to rebalance supply and demand.
- Price does not necessarily have to return to fill the gap, does not necessarily have to fill the gap completely, and may take many hours or many days to return to fill the gap.
- If price is in a prolonged continuous uptrend over many days, this gap may be an exhaustion gap, i.e. the final bullish impulse of a large trend.
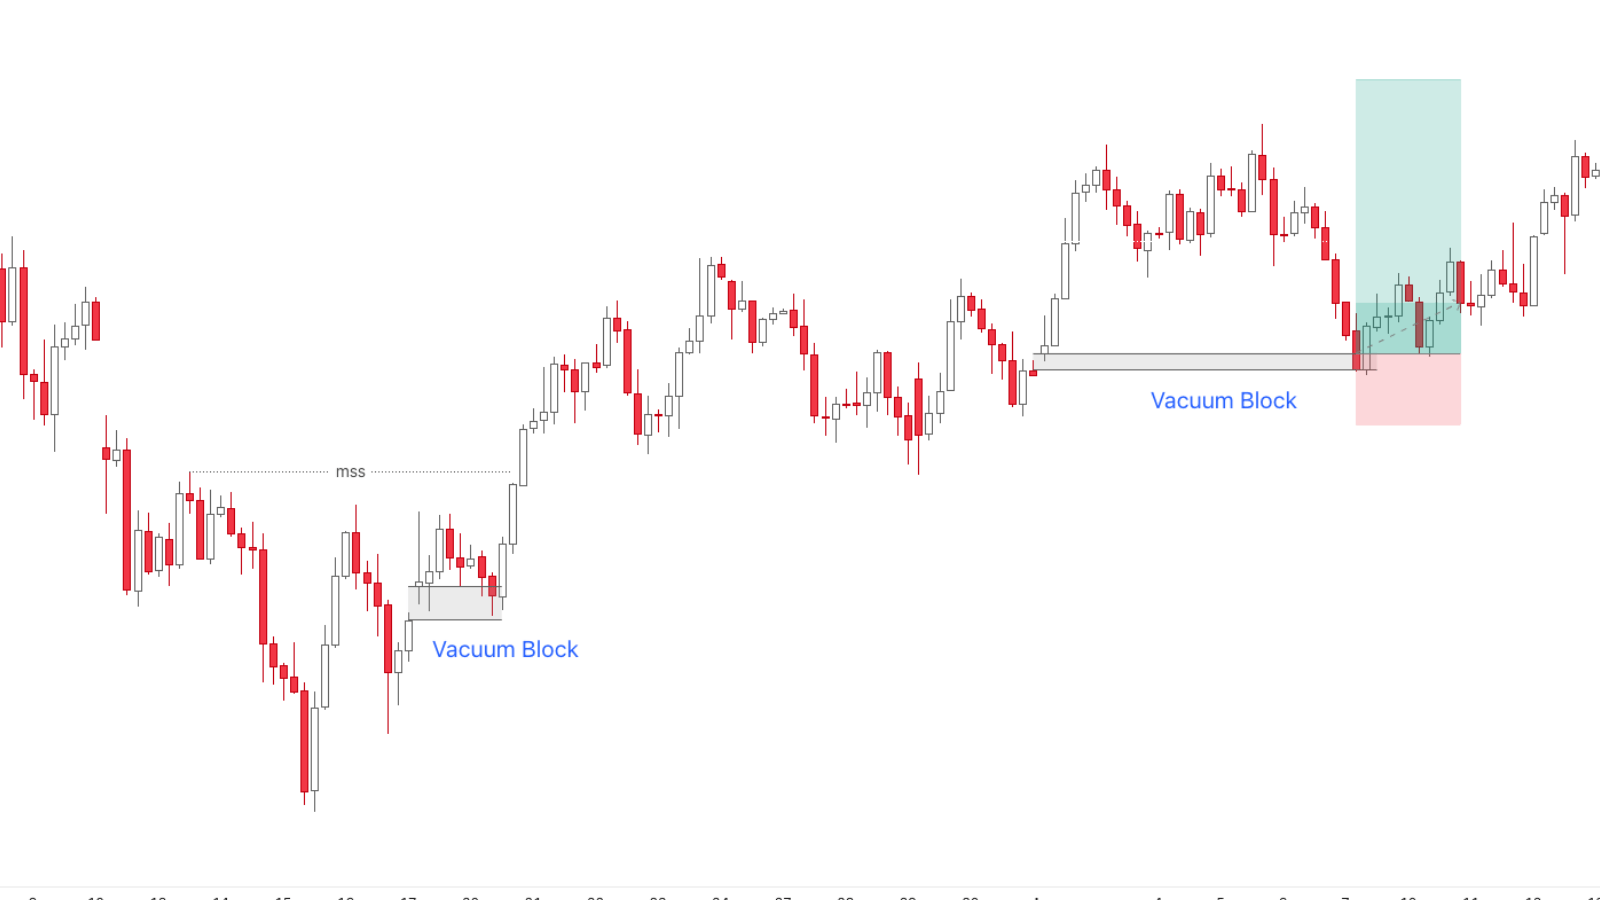 Trading with a Vacuum Block and Volume Imbalance
How will price fill the gap?
- If there is an Order Block inside the gap, price may only need to reach it and then bounce up → leaving part of the gap unfilled, and price may return to fill the rest in the future.
- If the gap is filled, i.e. both the buy side and the sell side have been active in the gap zone, then there will be no reason for price to fall deeper than the low of the first bullish candle in the gap.
When the gap is filled and price continues the previous trend, we do not want price to return and break the low of the candle that filled the gap.
Compared with an OB, a VB/VI is more similar to an FVG because both are imbalance zones, while an OB is a balanced zone with price acceptance.
What is a Propulsion Block?
A Propulsion Block (PB) is a candle that penetrates into an Order Block, then acts as a potential support/resistance zone preventing price from advancing deeper into that Order Block.
A Propulsion Block expresses the presence of Smart Money, keeping price from breaking the previous OB zone.
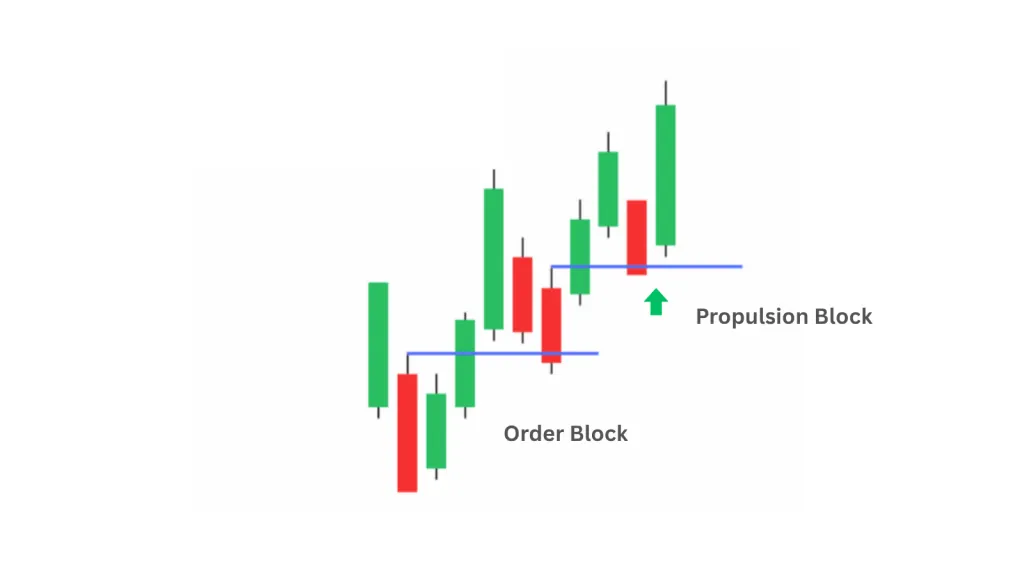 What is a Propulsion Block?
- In an uptrend: The Propulsion candle drops down tapping into a Bullish OB, proving there is selling pressure, but immediately afterward a bullish candle closes above that candle.
- In a downtrend: The Propulsion candle rises up tapping into a Bearish OB, proving there is buying pressure, but immediately afterward a bearish candle closes below that candle.
Characteristics of a Propulsion Block:
- Price usually returns to test and touch the PB and then reacts with an immediate rejection.
- Price should not break through the 50% mean threshold of the PB candle body; that is the failure threshold, and price may advance deeper into the previous OB.
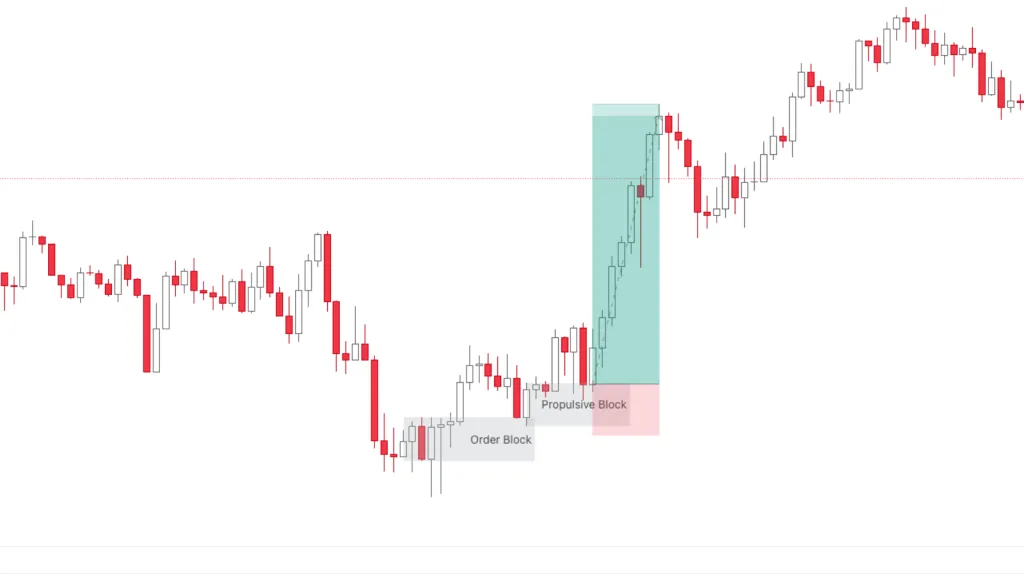 Entering a trade with a Propulsion Block
A Propulsion Block has characteristics similar to a Single Candle Mitigation (SCOB) in Trading Hub 3.0.
What is Institutional Order Flow?
Institutional Order Flow is the flow of large-volume buy/sell orders from financial institutions. Analyzing Order Flow (OF) helps us determine whether the sell side or the buy side is controlling the market.
Institutions create or adjust Order Flow to push price to their zones of interest, POIs (PD Array).
When price moves close to their POI zone, institutions place large orders to:
- Trigger liquidity
- Change the direction of Order Flow
- Create a strong push (displacement)
This is exactly what leads to trend reversals or continuations.
How to identify Order Flow
In Bearish Order Flow:
- Price creates new Lower Highs and Lower Lows
- Bullish structure is broken (MSS), or a high is swept after price touches a bearish POI.
- Manipulating buy-side institutions attract buy liquidity in; after enough liquidity, they open large sell positions.
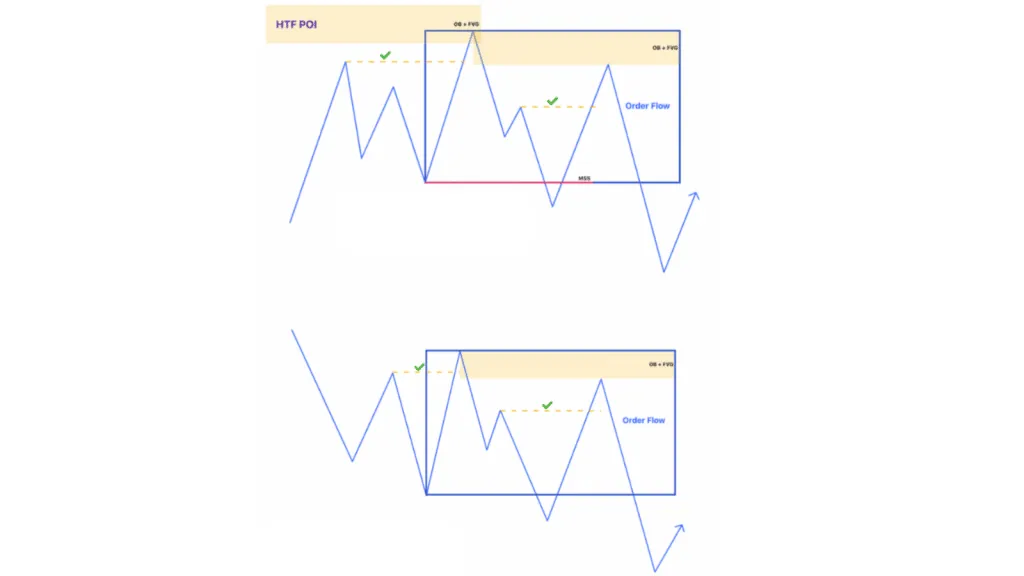 Bearish Order Flow in ICT
Bearish OF is confirmed when price leaves the OF zone and holds below this zone.
In Bullish Order Flow:
- Price creates new Higher Highs and Higher Lows
- Bearish structure is broken, or a low is swept after price touches a bullish POI.
- Manipulating sell-side institutions attract sell liquidity out; after enough liquidity, they open large buy positions.
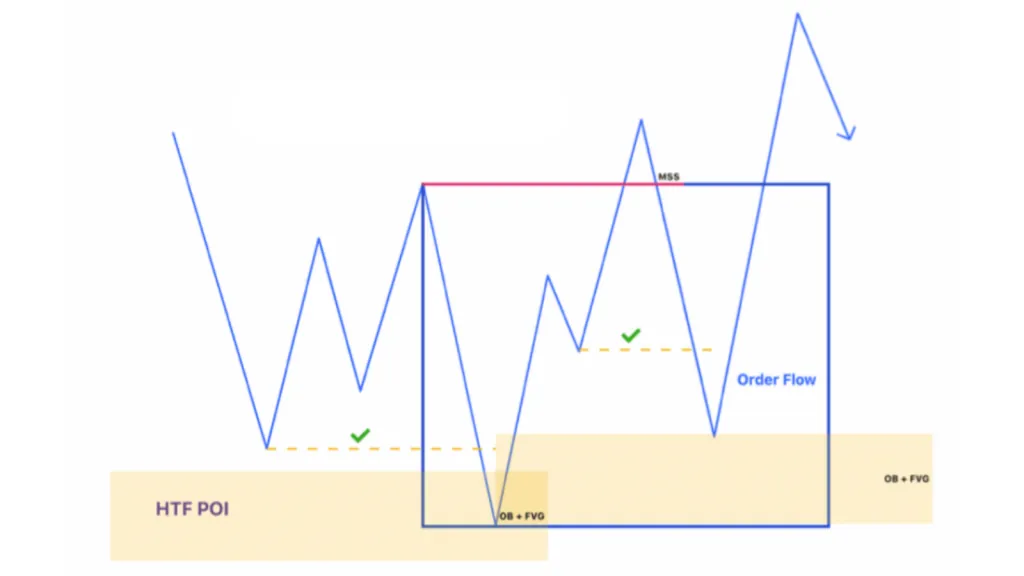 Bullish Order Flow in ICT
Bullish OF is confirmed when price leaves the OF zone and holds above this zone.
The logic of Order Flow: The nature of price manipulation
The most important thing to understand Order Flow is:
Order Flow is created from price manipulation by Smart Money to take liquidity and open large positions.
Specifically:
- A strong price impulse (with no pullback) shows that price has taken liquidity → this is precisely a sign of Order Flow.
- When Order Flow forms, the large capital flow is holding two positions at once: a manipulation position (currently losing) and a main position in the direction they want to push price.
Price must return to the Order Flow zone to:
- Handle the losing position
- Close the manipulation position
- Continue pushing price in the main direction, creating a strong trend
Therefore, Order Flow usually includes zones such as: Order Block, FVG.
On large timeframes (HTF), Order Flow looks very much like an Order Block.
How to use Order Flow
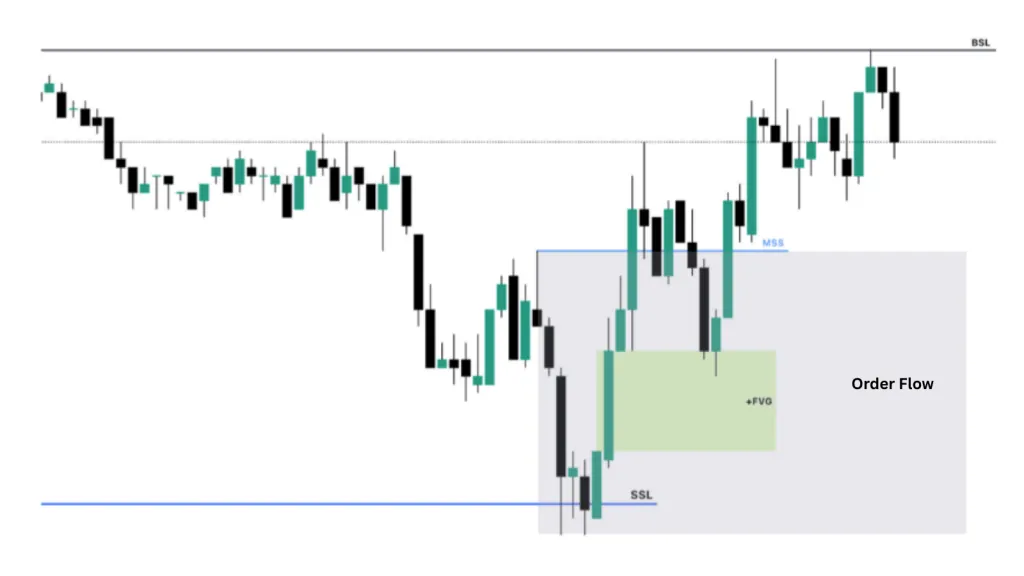 Using Order Flow
When price returns to OF, traders expect:
- Price to bounce in the direction of the Order Flow
- The main trend to be maintained
- A safer entry thanks to understanding Smart Money's intentions
This is also the foundation for forming Order Blocks.
Although Order Flow is a very strong zone, you should not enter directly at OF, because:
- The stop loss is usually very large
- Price usually sweeps the OF zone before moving in the right direction
- Confirmation (MSS, displacement…) is needed to reduce risk
Traders should use OF as context to determine the main trend, or as a zone to wait for an entry confirmation on a smaller timeframe.
See more about OF in Trading Hub 3.0 in the article on OF.
5/5 - (14 votes)
Read structure 10x faster with JUKA
JUKA maps SMC structure — swings, BOS, CHoCH and inducement zones — automatically on any TradingView chart. No more hand-drawing structure for hours.
Get JUKA — $150