ICT Part 3: What Is a Liquidity Pool? What Are BSL & SSL?
Liquidity is the “lifeblood” of the market, the core factor that allows all buying and selling activity to take place smoothly.
Thanks to liquidity, traders can execute trades with low slippage and fast order matching.
Understanding liquidity will help retail traders like us to:
- Enter trades at advantageous positions and exit trades at the right time.
- Have a clear view of the next direction of price movement.
How the market works
First, we need to understand how the market works. There are always two opposing sides: institutions (Smart Money) and retail traders (Retail).
Characteristics of Smart Money:
- Operate with enormous trading volume.
- Have the ability to create supply/demand and move the market according to a plan.
- Always take advantage of liquidity from the stop-loss orders of retail traders.
Characteristics of Retail:
- Depend on the broker to match orders.
- Are easily manipulated by emotions and weak technical signals.
- React mechanically to support/resistance zones and are easily trapped.
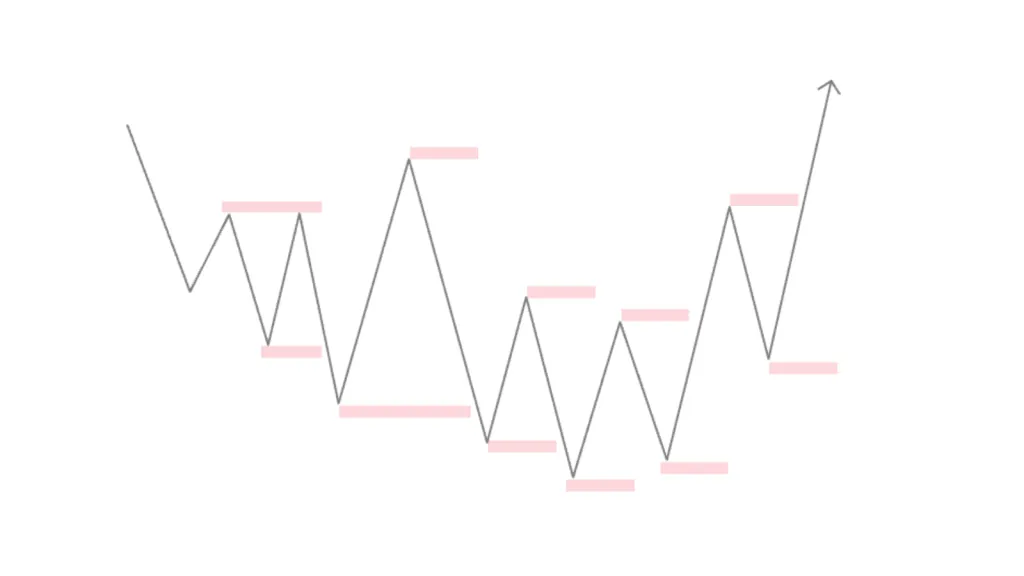 Liquidity in ICT
Institutions simulate clear support/resistance zones, making retail traders feel “safe” when entering trades with fixed stop losses.
But in reality, that is a liquidity trap where institutions can easily exit their orders with maximum profit.
When a stop order is triggered, it unintentionally creates an opposing order for institutions to use — exactly the source of liquidity they are looking for.
What is a Liquidity Pool in ICT?
A Liquidity Pool or Liquidity Zone is an area on the price chart where most of the stop-loss orders of retail traders are waiting, and this is the target that Smart Money usually aims for to sweep liquidity.
You need to observe where most retail traders are willing to buy or sell. And ask yourself: Where will Retail place their Stop Loss?
Usually, retail traders will:
- Buy above an old high after a breakout, or sell below an old low after a breakout.
- If they bought earlier, they will place a sell stop below the old low as a stop loss to guard against risk. If they sold earlier, they will place a buy stop above the old high as a stop loss.
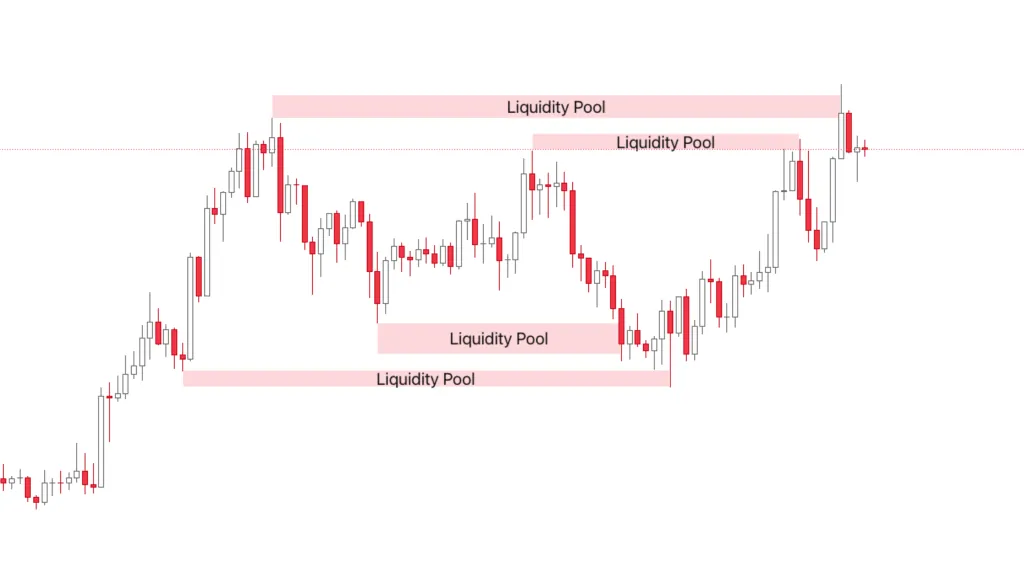 What is a Liquidity Pool?
Therefore, old highs contain a liquidity pool above them, including stop-loss orders and buyers ready to enter after a break of the high.
Similarly, old lows contain a liquidity pool below them, including sell stop orders or sellers selling at market price after a break of the low.
What is Draw on Liquidity?
Draw on Liquidity is the concept referring to price being “drawn” toward a specific liquidity zone, like a magnet attracting price before it continues or reverses.
Identifying the draw on liquidity helps traders know the next target of price.
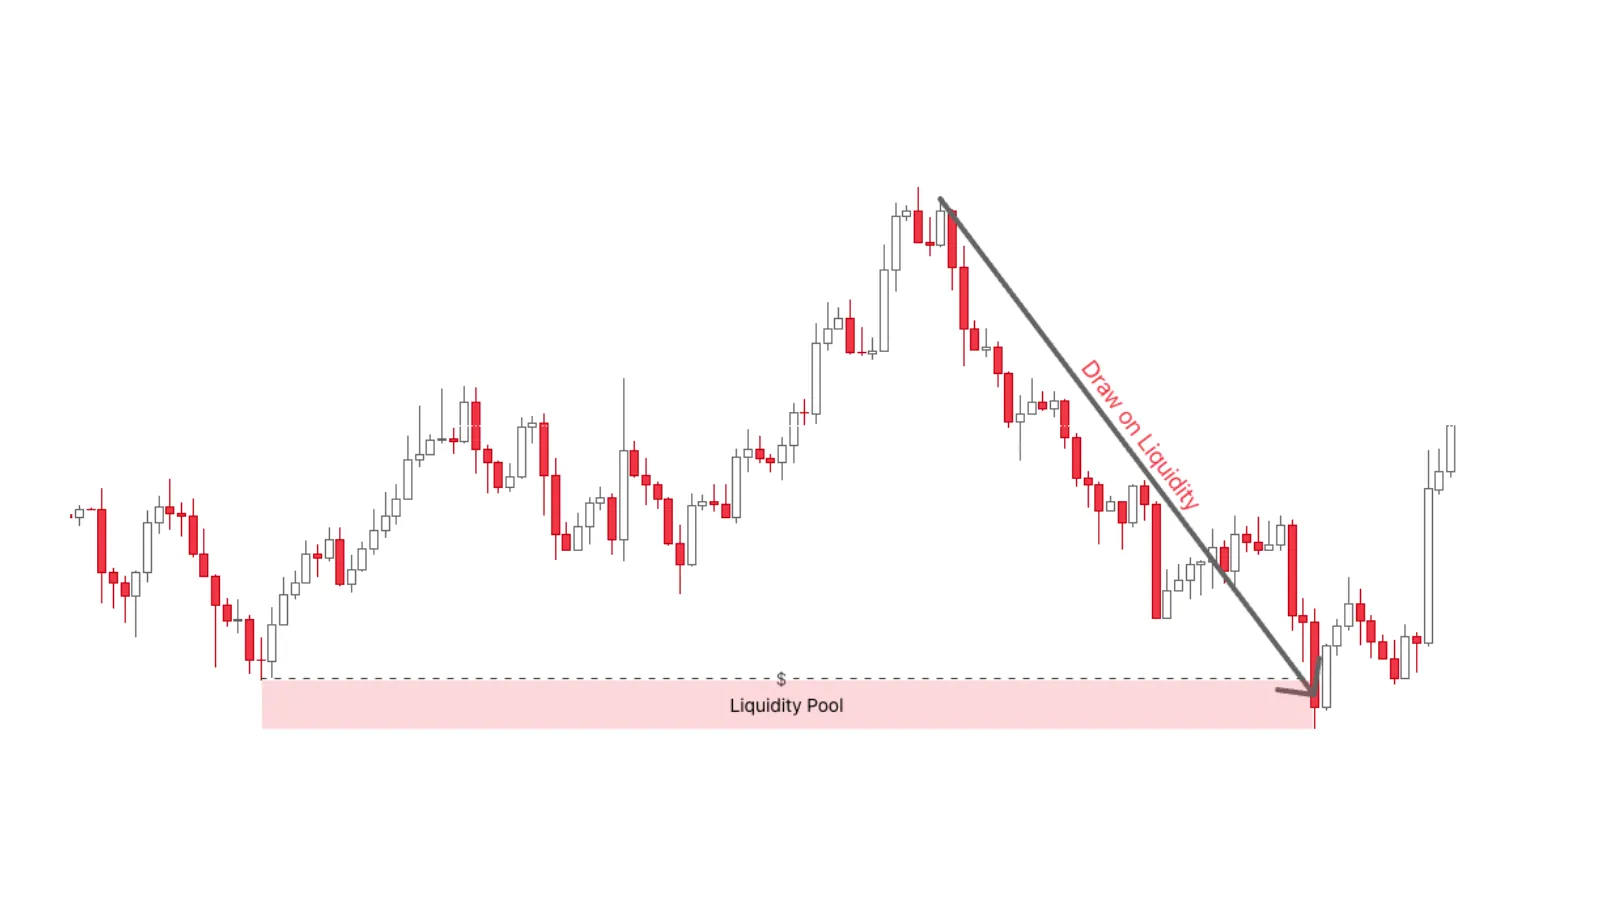 What is Draw on Liquidity?
The nature of Draw on Liquidity:
- The market always moves from one liquidity zone to another liquidity zone.
- Liquidity here is where stop-loss orders and buy/sell stops of retail traders are concentrated.
- When liquidity is swept, price will usually be drawn to the next liquidity zone.
Types of liquidity in the market
According to the ICT method, the market has several forms of liquidity as follows:
- Buy Side Liquidity (BSL) & Sell Side Liquidity (SSL): Buy-side and sell-side liquidity.
- Major Liquidity: Formed around session, day, week, and month highs/lows. This is where institutions “plant their flag.” E.g. PDH/PDL, PWH, PWL, Session High/Low…
- Equal High (EQH) & Equal Low (EQL): Price zones with equal highs or equal lows, easily targeted by institutions.
- Trendline Liquidity: Liquidity behind a trendline, usually swept before a reversal.
- Internal Range Liquidity (IRL) & External Range Liquidity (ERL): Internal liquidity and external liquidity.
In the following parts, we will study each type of liquidity above.
What are BSL and SSL?
Buy side Liquidity (BSL) and Sell side Liquidity (SSL) are the highs and lows where most pending buy and sell orders are concentrated.
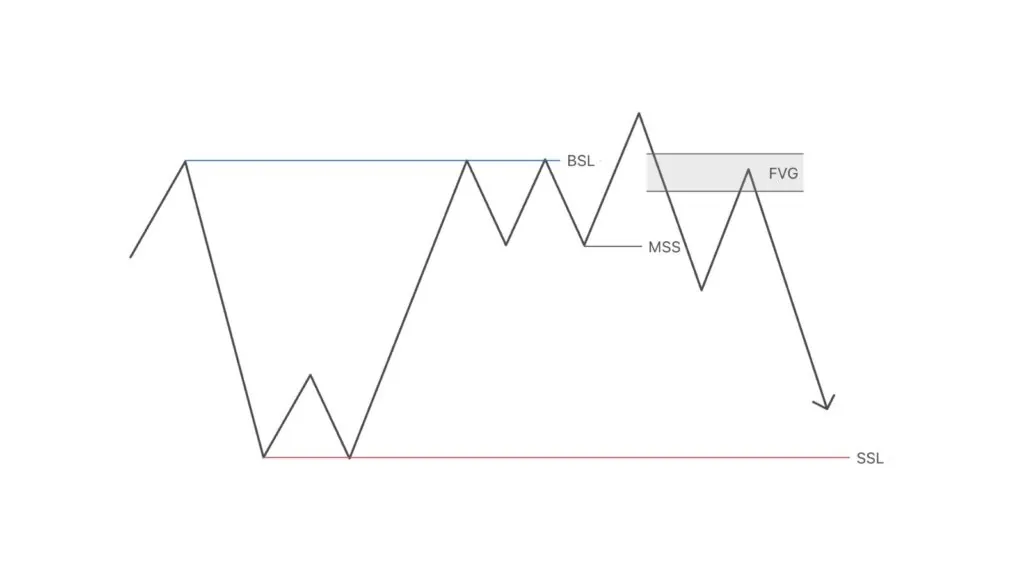 What are BSL and SSL in ICT?
What is BSL?
Buy side liquidity (BSL) according to ICT is where buy stop buy orders are waiting.
When traders execute a sell order, they usually want to protect the position by placing a stop-loss order in case price moves against them.
A buy stop order right above the sell price level to protect capital and guard against loss.
What is SSL?
Sell side liquidity (SSL), according to ICT, is the accumulation of pending sell stop orders.
When traders open a buy order, they usually place a stop-loss order to protect the position from the risk of loss.
A stop loss is precisely a sell stop order that acts as a protective mechanism, triggered if price falls below a certain level.
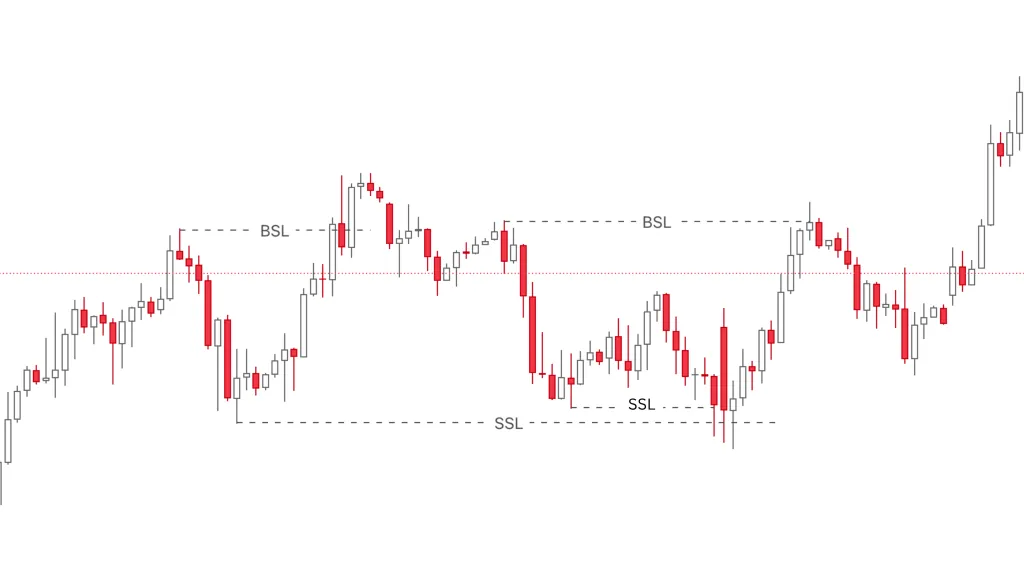 BSL and SSL liquidity in ICT
Strategy with BSL and SSL?
BSL and SSL are zones containing latent liquidity, where smart money always heads to carry out their stop hunt plans.
Price will always seek liquidity to either continue expanding the trend or reverse strongly.
MMs usually push price in a false break through BSL/SSL to deceive retail traders.
In particular, round price levels (such as 1.1000, 1.2500…) are usually points of large liquidity concentration, where significant profit can be brought to institutions if exploited at the right time.
After sweeping clean the liquidity in these zones, price can return to important order blocks, where Smart Money orders have been placed.
Therefore, the simple strategy of ICT is: Always trade according to the price behavior that has formed. If we see price reversing at SSL or BSL, we trade in the reversal direction. Conversely, if price continues to break through the liquidity zone, we trade in continuation of the trend.
Applying entry models at positions like those above will help us increase our probability of winning (read the following articles).
5/5 - (14 votes)
Read structure 10x faster with JUKA
JUKA maps SMC structure — swings, BOS, CHoCH and inducement zones — automatically on any TradingView chart. No more hand-drawing structure for hours.
Get JUKA — $150