ICT Part 6: Weekly Profile
Market Profile
Market Profile analysis provides a unique perspective on market behaviour by focusing on the relationship between price and time.
Is the market trending up, forming a reversal pattern, or consolidating in preparation for a breakout scenario?
It gives traders deep insights into:
- Market structure
- Price distribution
- Trading activity taking place over a specific period of time
The list of Market Profiles we will learn in this series includes:
- ICT Weekly Profile.
- ICT Intraday Profile.
- ICT Daily Bias.
- ICT Advanced Market Structure.
- ICT Market Maker Buy & Sell Models.
- ICT Judas Swing.
- IRL to ERL Price Move.
- HRLR to LRLR.
What Is a Weekly Profile in ICT?
A Weekly Profile is a set of model frameworks that help traders identify typical price behaviours within a trading week.
Each model has distinct characteristics that support forecasting the market's trend and reversal timing.
However, note that these are not fixed predictions, but rather templates for better understanding how price tends to move.
Learning the Weekly Profile patterns gives traders a framework of thinking to understand and adapt to market trends.
1. Classic Expansion
An ICT Weekly Profile model in which price forms the weekly high/low on Monday + Tuesday.
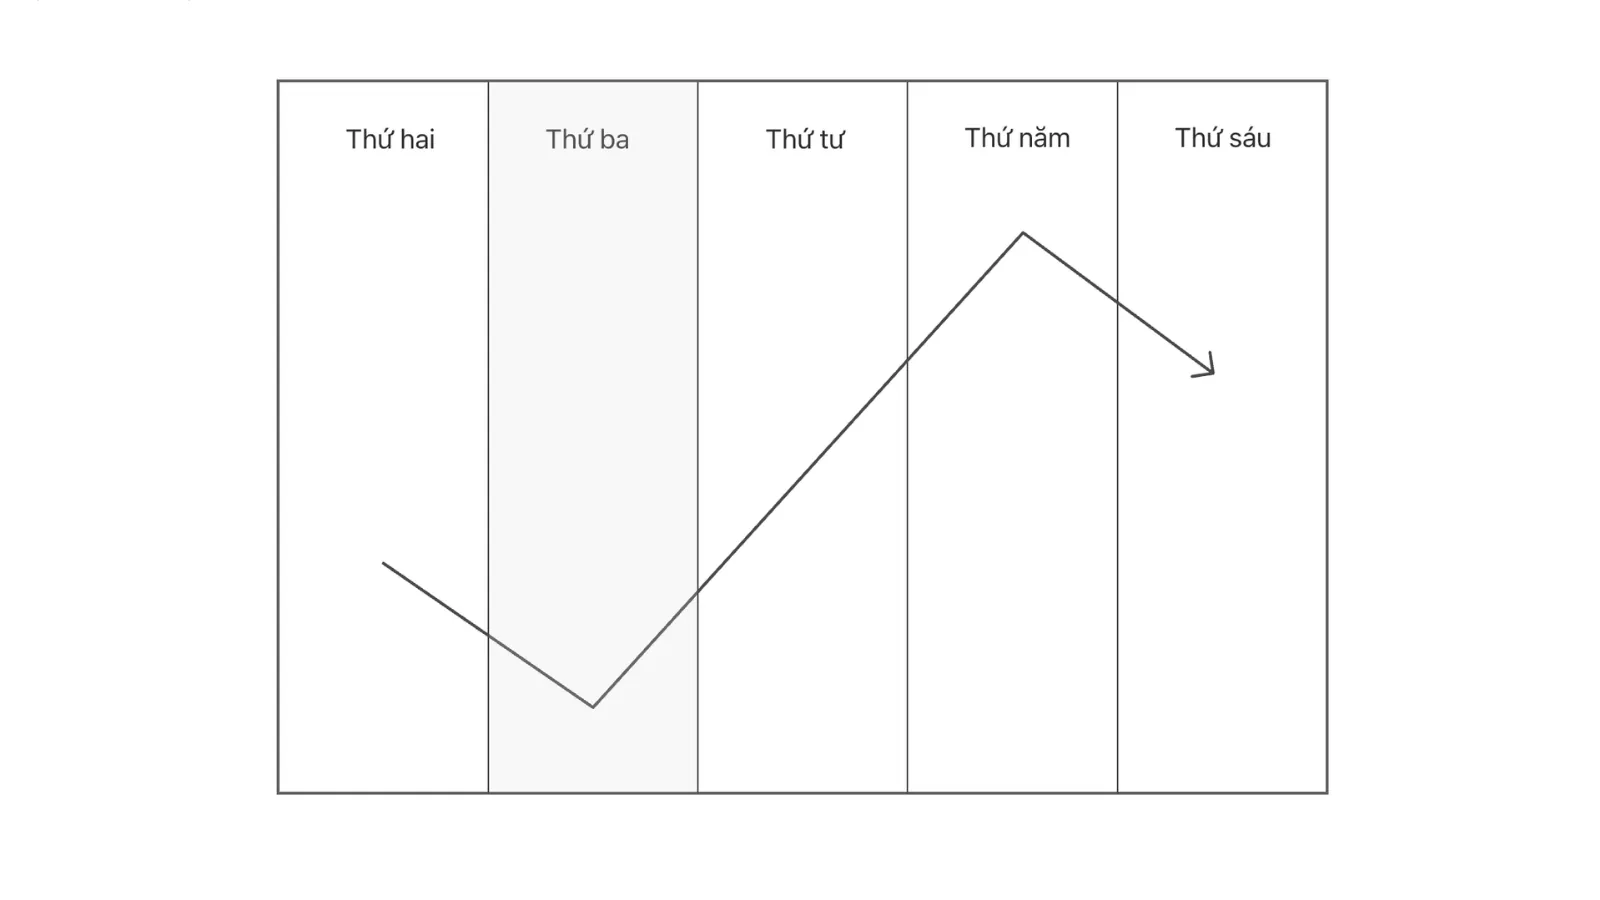 Weekly low on Tuesday
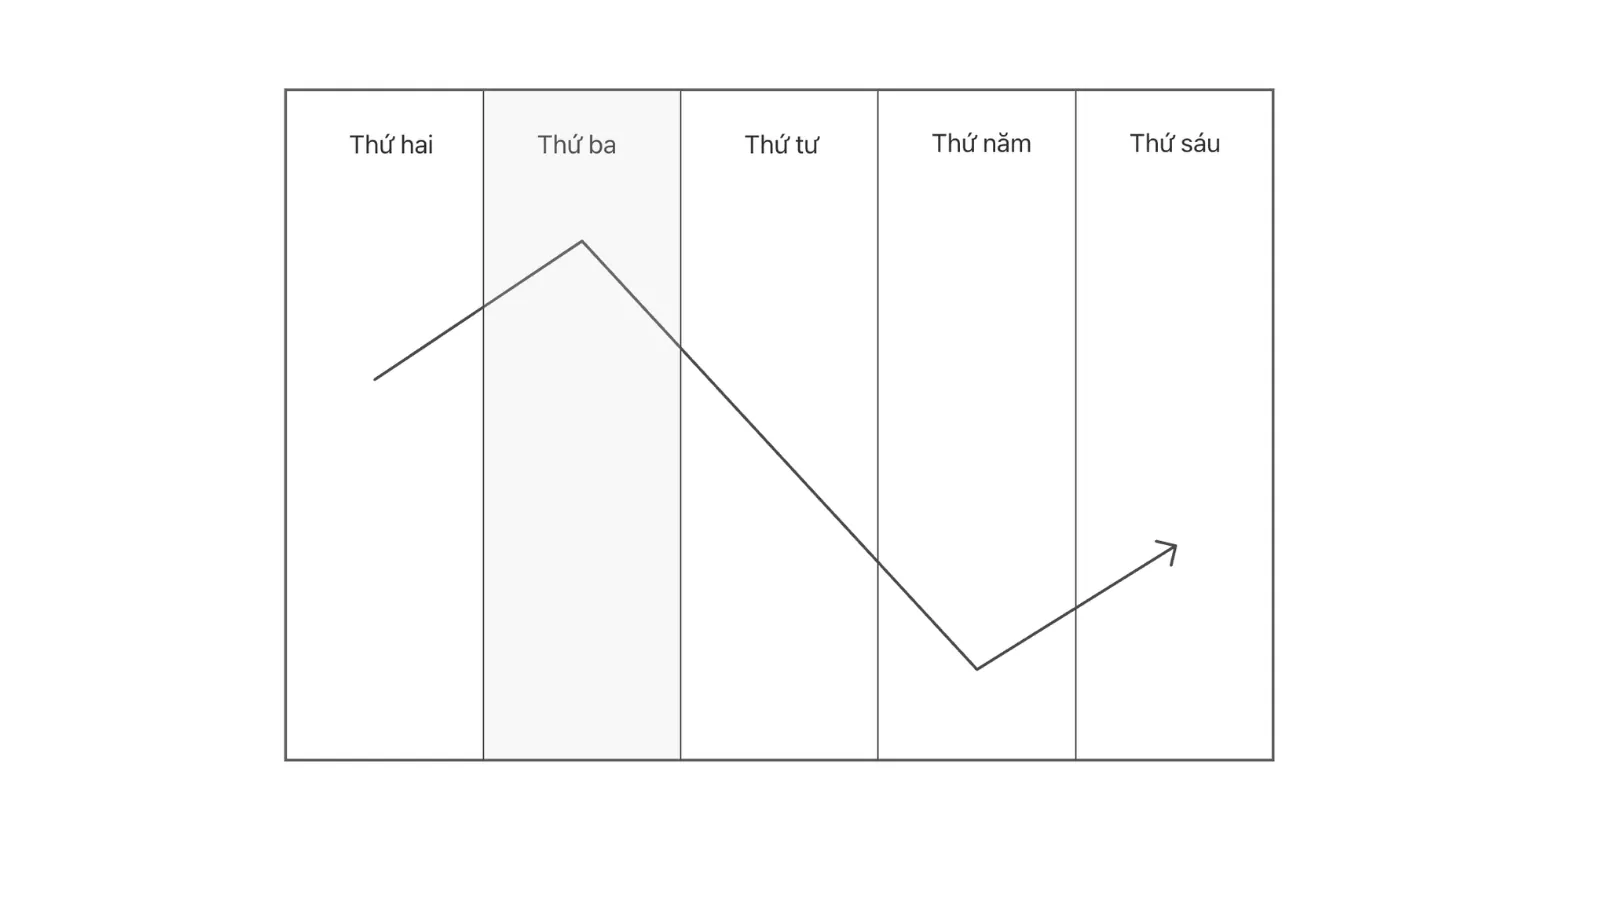 Weekly high on Tuesday
Bullish Profile
Monday + Tuesday form the weekly low:
- Monday: price ranges higher than the discount area on a larger timeframe.
- Tuesday: if on Monday price does not drop back to the HTF discount, then on Tuesday price will almost certainly drop suddenly to discount and form the weekly low.
- Wednesday and Thursday: price expands, creating upward displacement and leaving behind Bullish FVGs.
- Friday: price pulls back to tap the FVGs again to rebalance price.
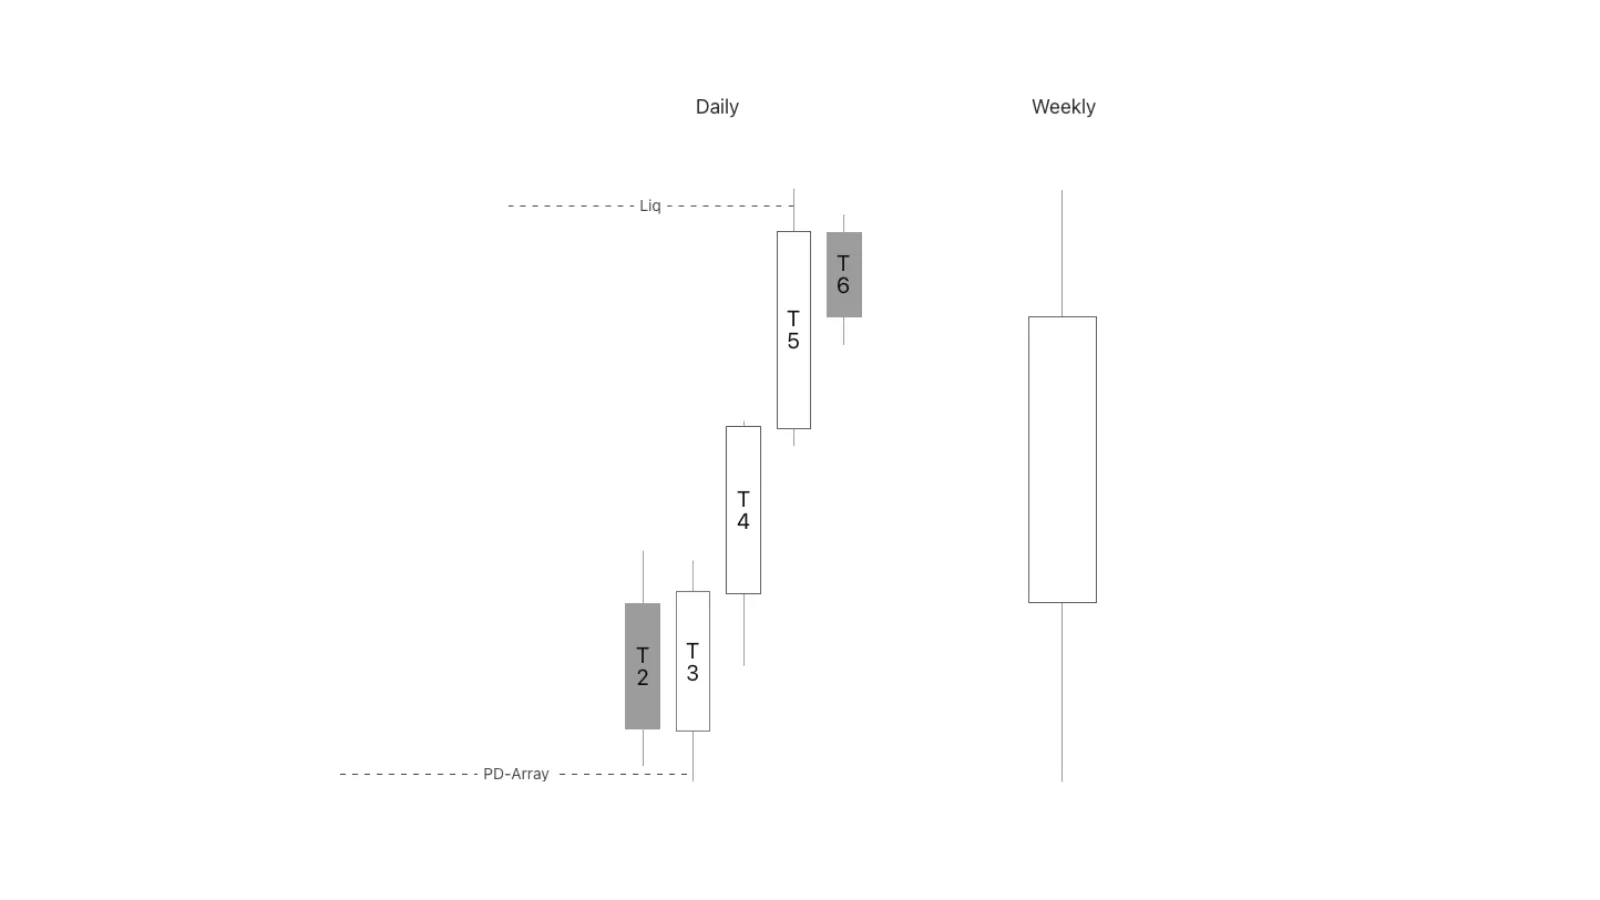 Tuesday forms the weekly low
Bearish Profile
Monday + Tuesday form the weekly high:
- Monday: price ranges below the premium area on a larger timeframe.
- Tuesday: if on Monday price does not form the weekly high at the premium area, then on Tuesday price will push up and touch the premium area to form the weekly high.
- Wednesday & Thursday: price expands, creating downward displacement and leaving behind Bearish FVGs.
- Friday: price pulls back to tap the FVGs again to rebalance price.
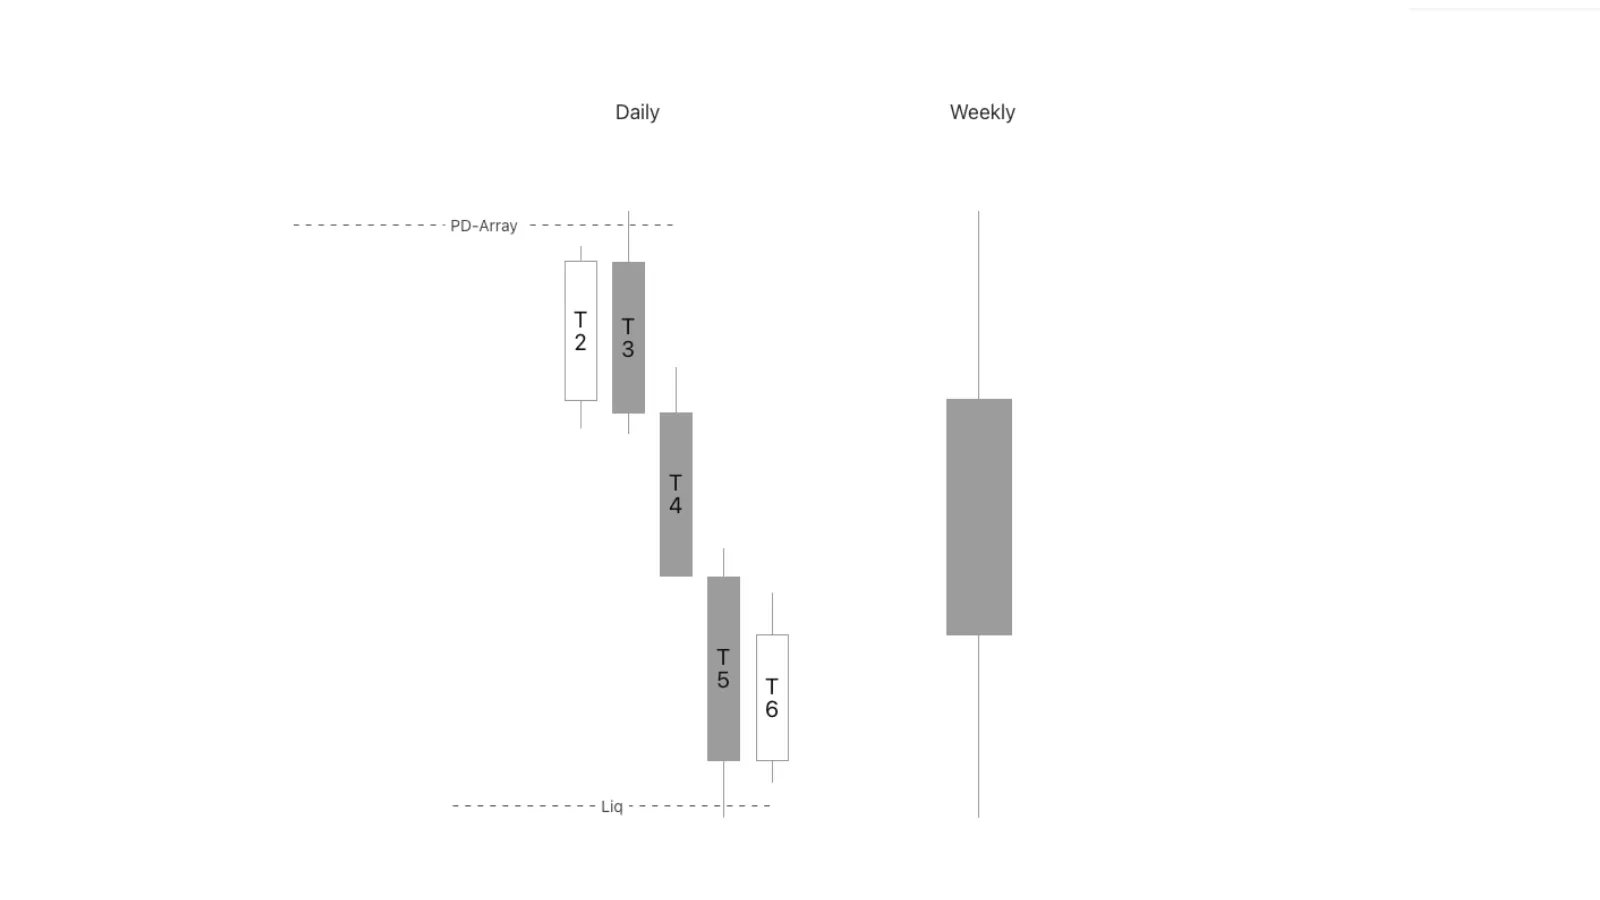 Tuesday forms the weekly high
This model usually occurs during the London or New York session.
💡Note that on Monday price usually moves sideways and collects data, so it is not a suitable day for trading. However, if price manipulates right from Monday — that is, price moves up to sweep stop-losses inside an HTF PD Array — it is very likely that price will expand right from Tuesday.
2. Midweek Reversal
An ICT Weekly Profile model that reverses in the middle of the week (Wednesday).
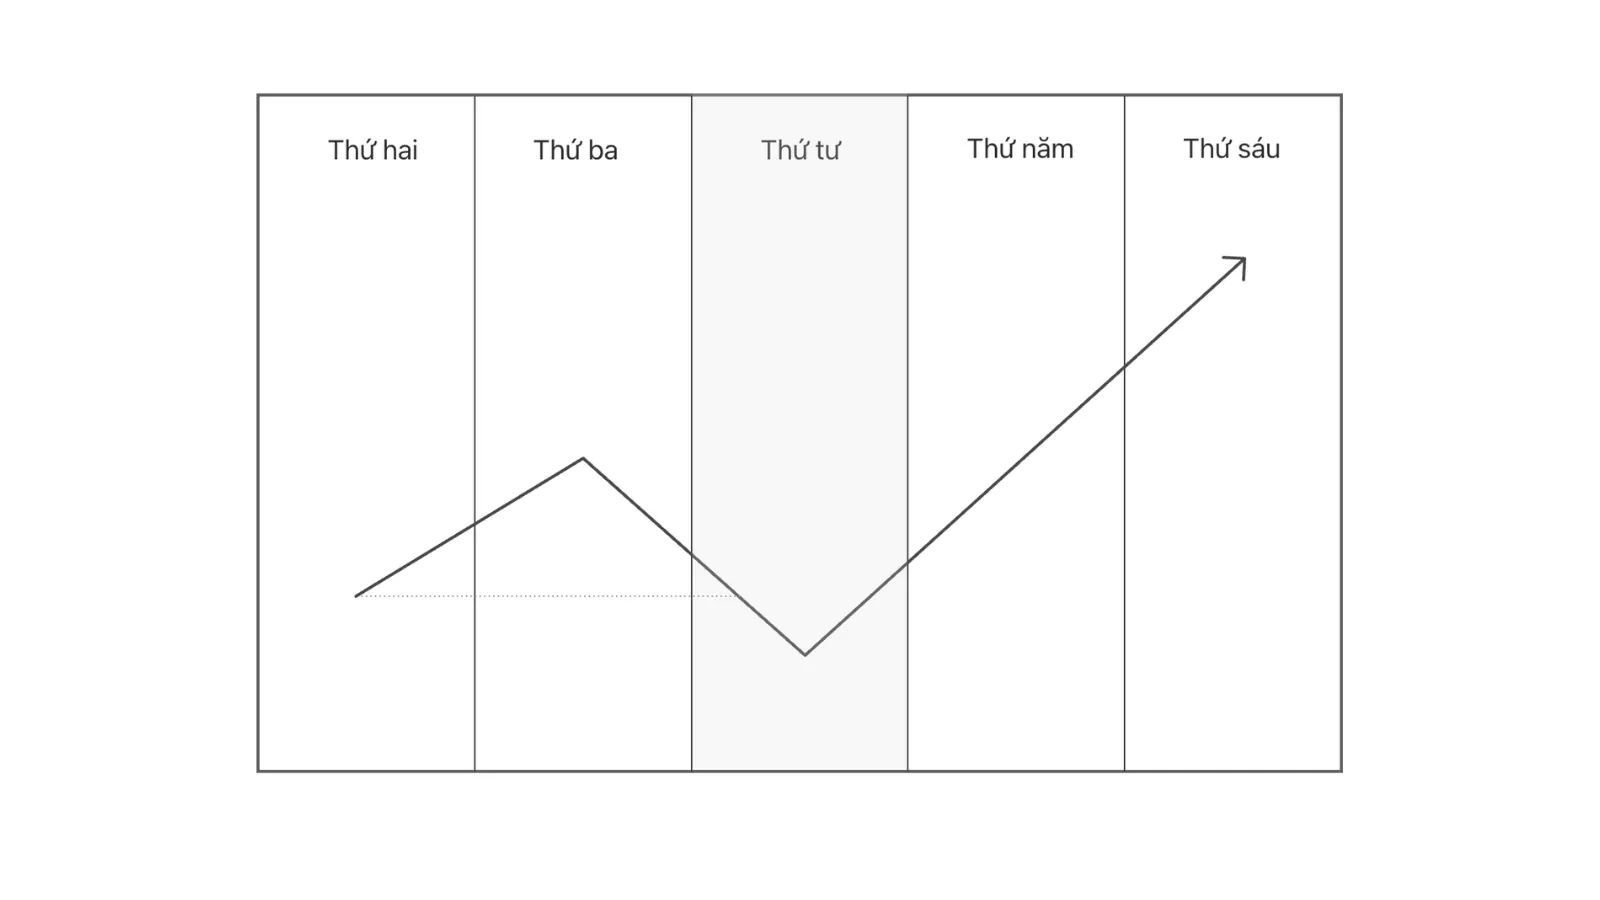 Weekly low on Wednesday model
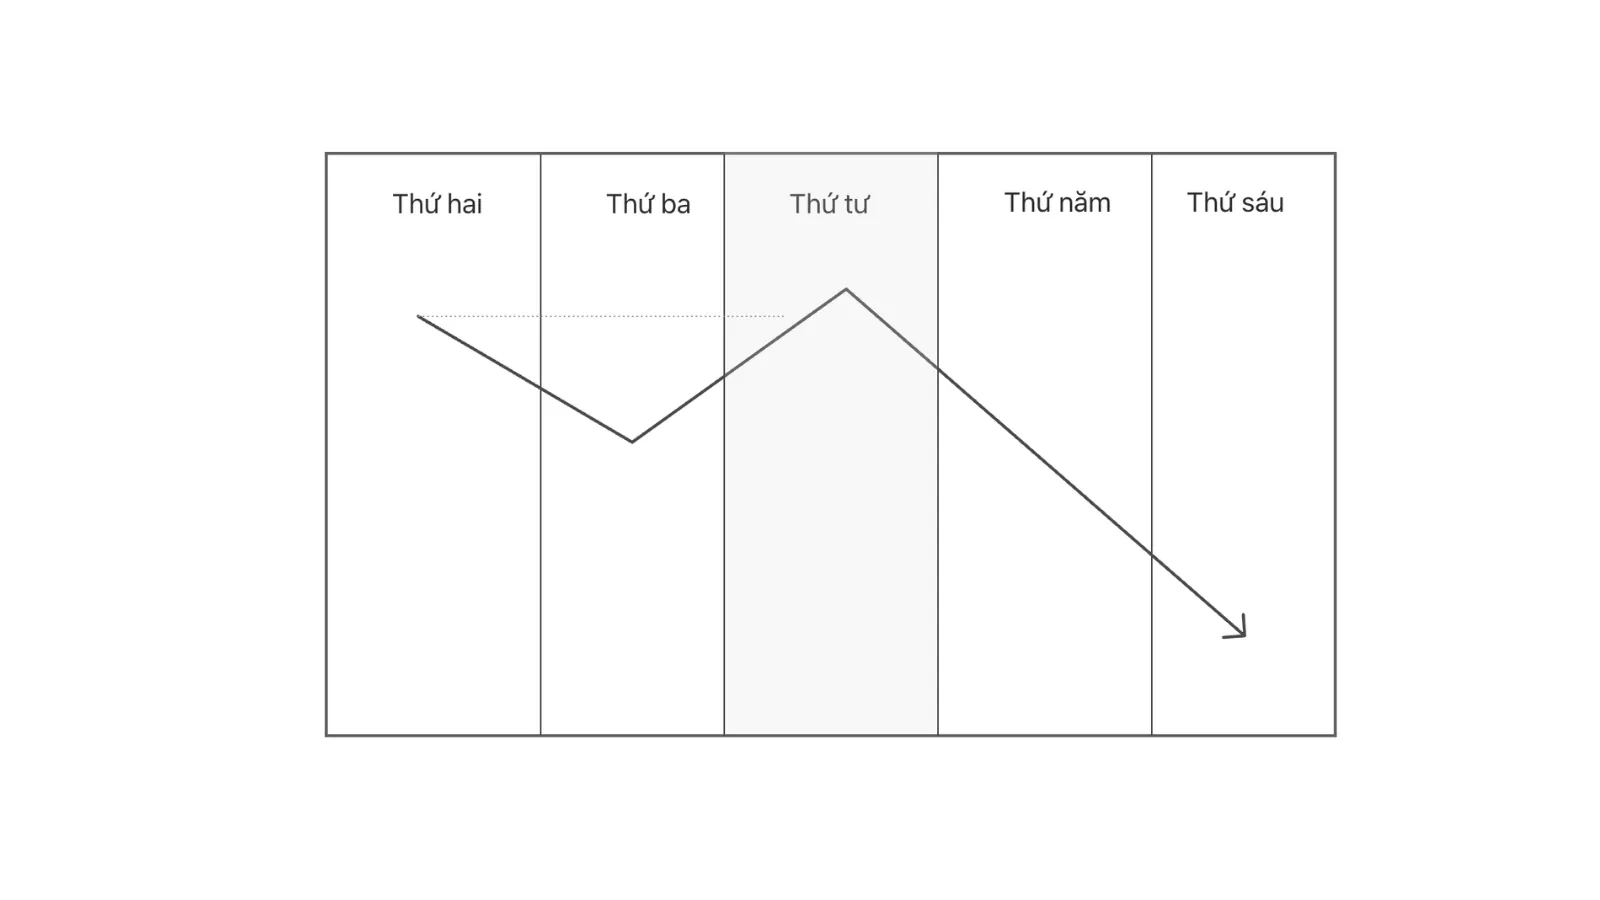 Weekly high on Wednesday model
Bullish Profile
- Monday and Tuesday: price ranges above the Discount array.
- Wednesday: price manipulates sharply lower through Monday's & Tuesday's lows, back to the discount array on the HTF to form the weekly low. Price triggers sell stops and then suddenly reverses strongly higher.
- Thursday & Friday: price expands strongly higher towards liquidity.
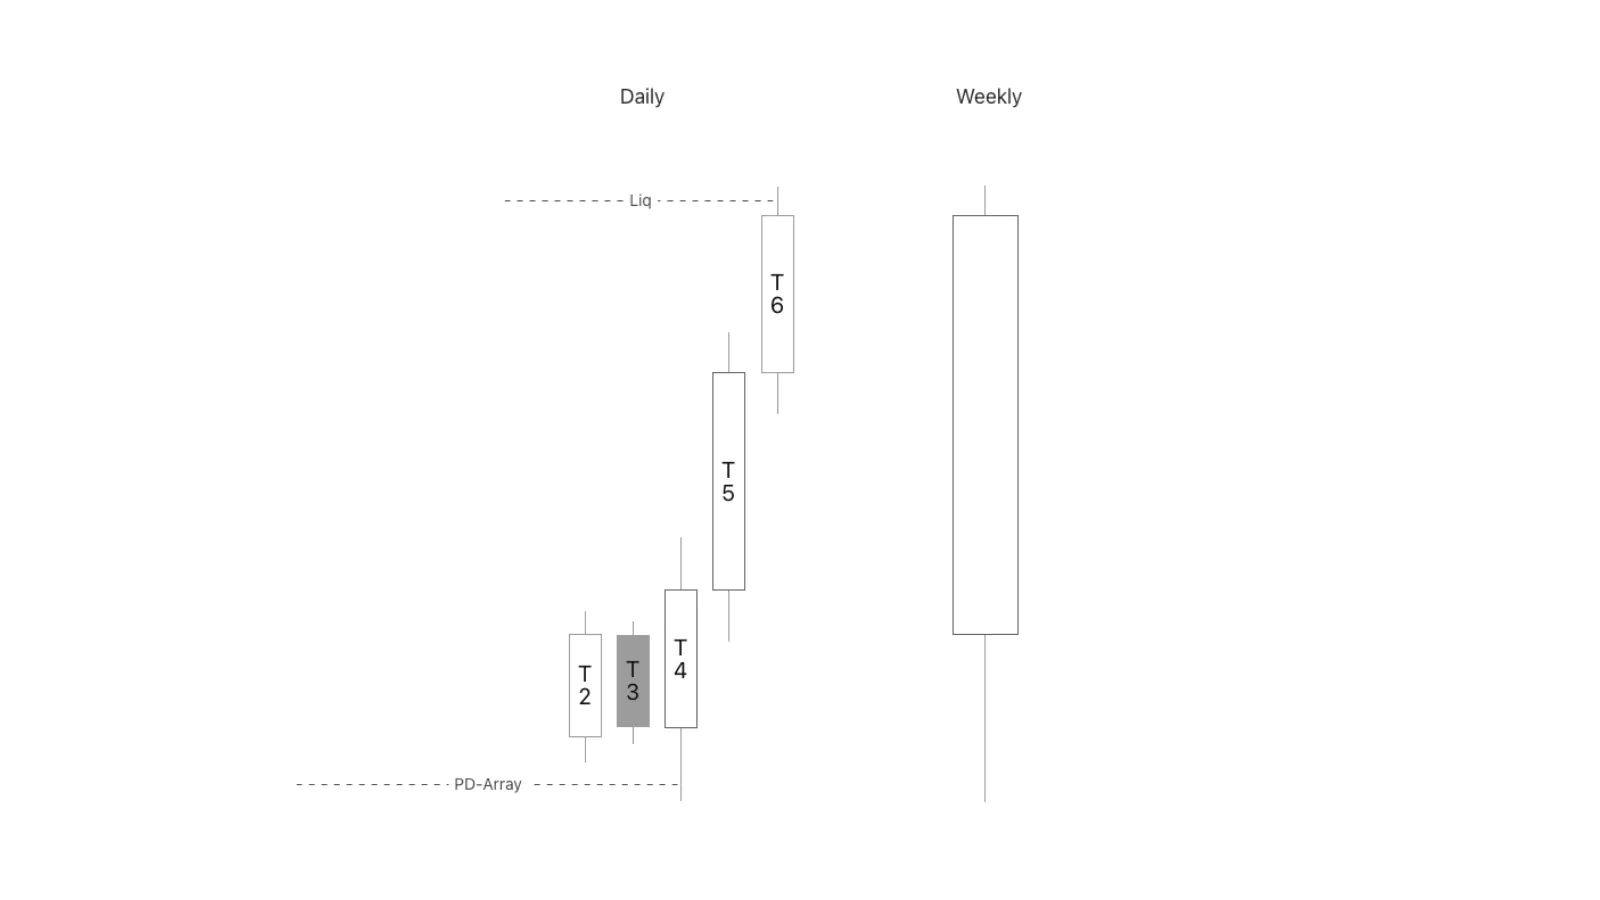 Wednesday forms the weekly low
Expect this model to occur if on Monday and Tuesday price ranges without touching the HTF Discount area.
Bearish Profile
- Monday and Tuesday: price ranges below the premium array.
- Wednesday: price manipulates sharply higher through Monday's & Tuesday's highs, up to the HTF premium area to form the weekly high. Price triggers buy stops and then reverses strongly lower.
- Thursday & Friday: price expands strongly lower towards liquidity.
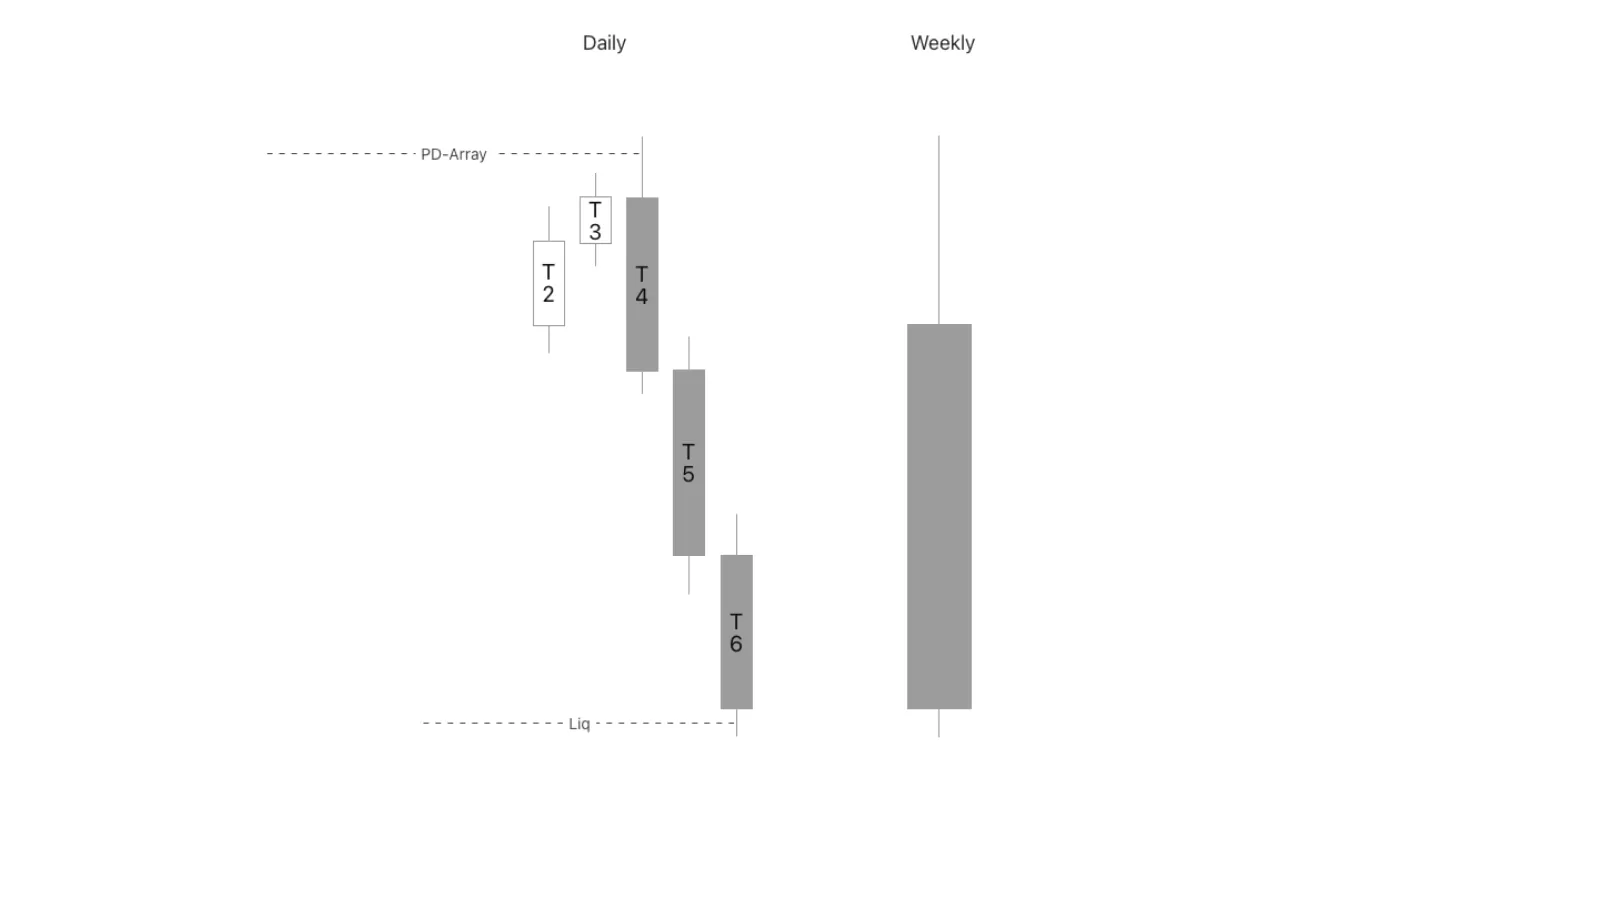 Wednesday forms the weekly high
Expect this model to occur if on Monday and Tuesday price does not touch the HTF Premium area.
💡If by Wednesday price still does not manipulate into a PD Array → there is no profile → do not trade, because price may not expand, unless SMT has already appeared at the start of the week.
3. Consolidation Reversal (Reversal After Consolidation)
An ICT Weekly Profile model that reverses after consolidation.
Price consolidates at the start of the week, reverses on Thursday, and expands on Friday.
This model is also called Seek and Destroy.
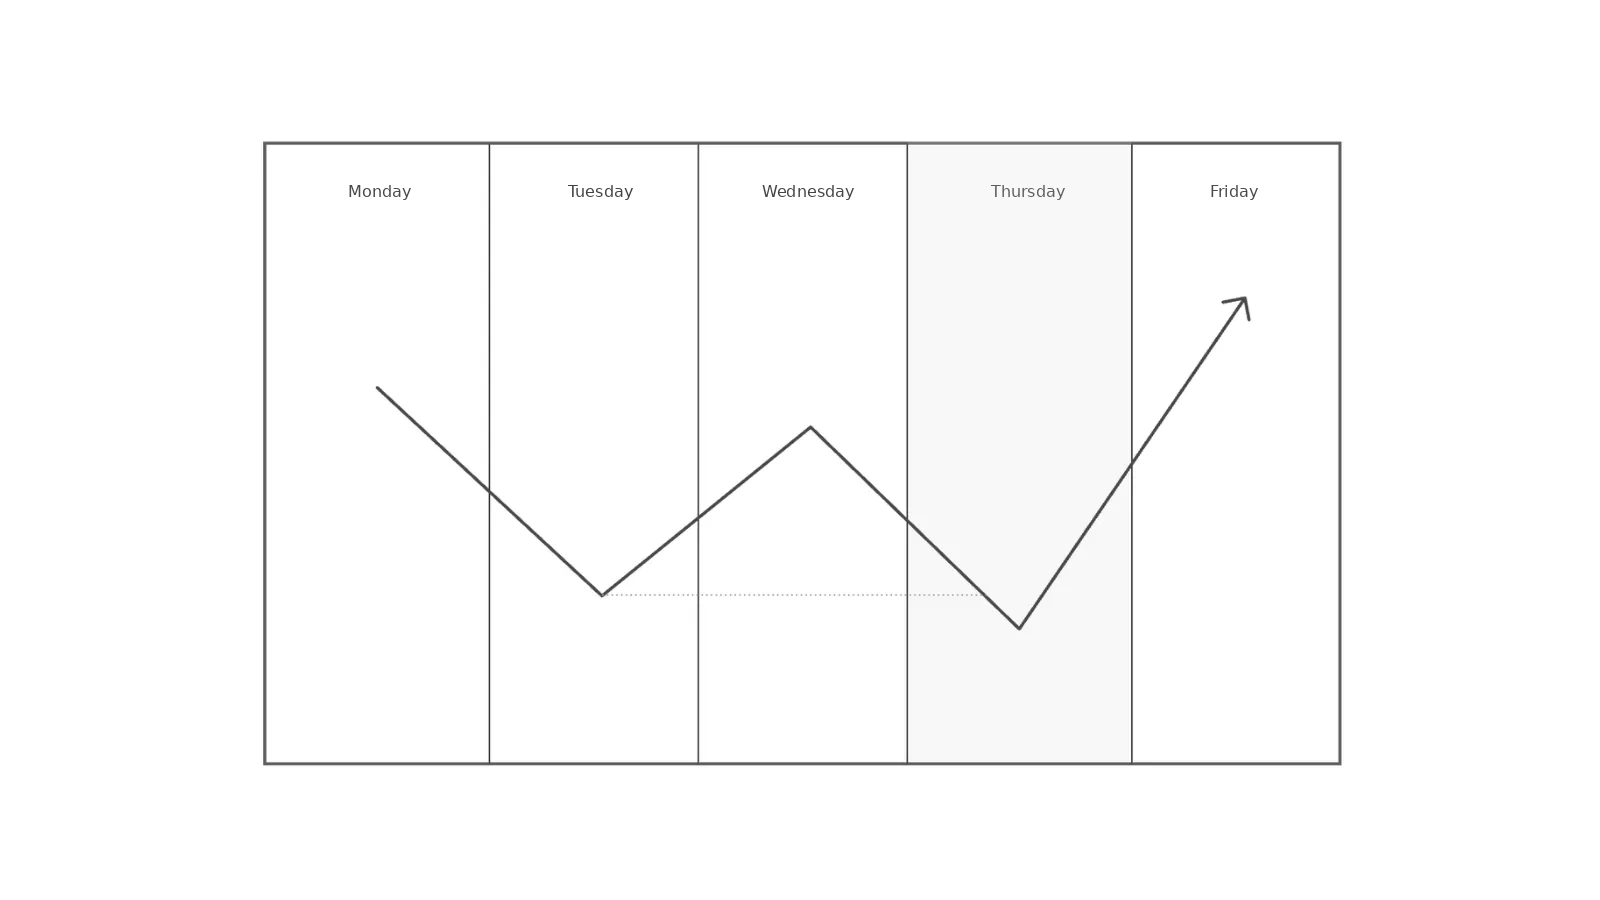 Weekly low on Thursday
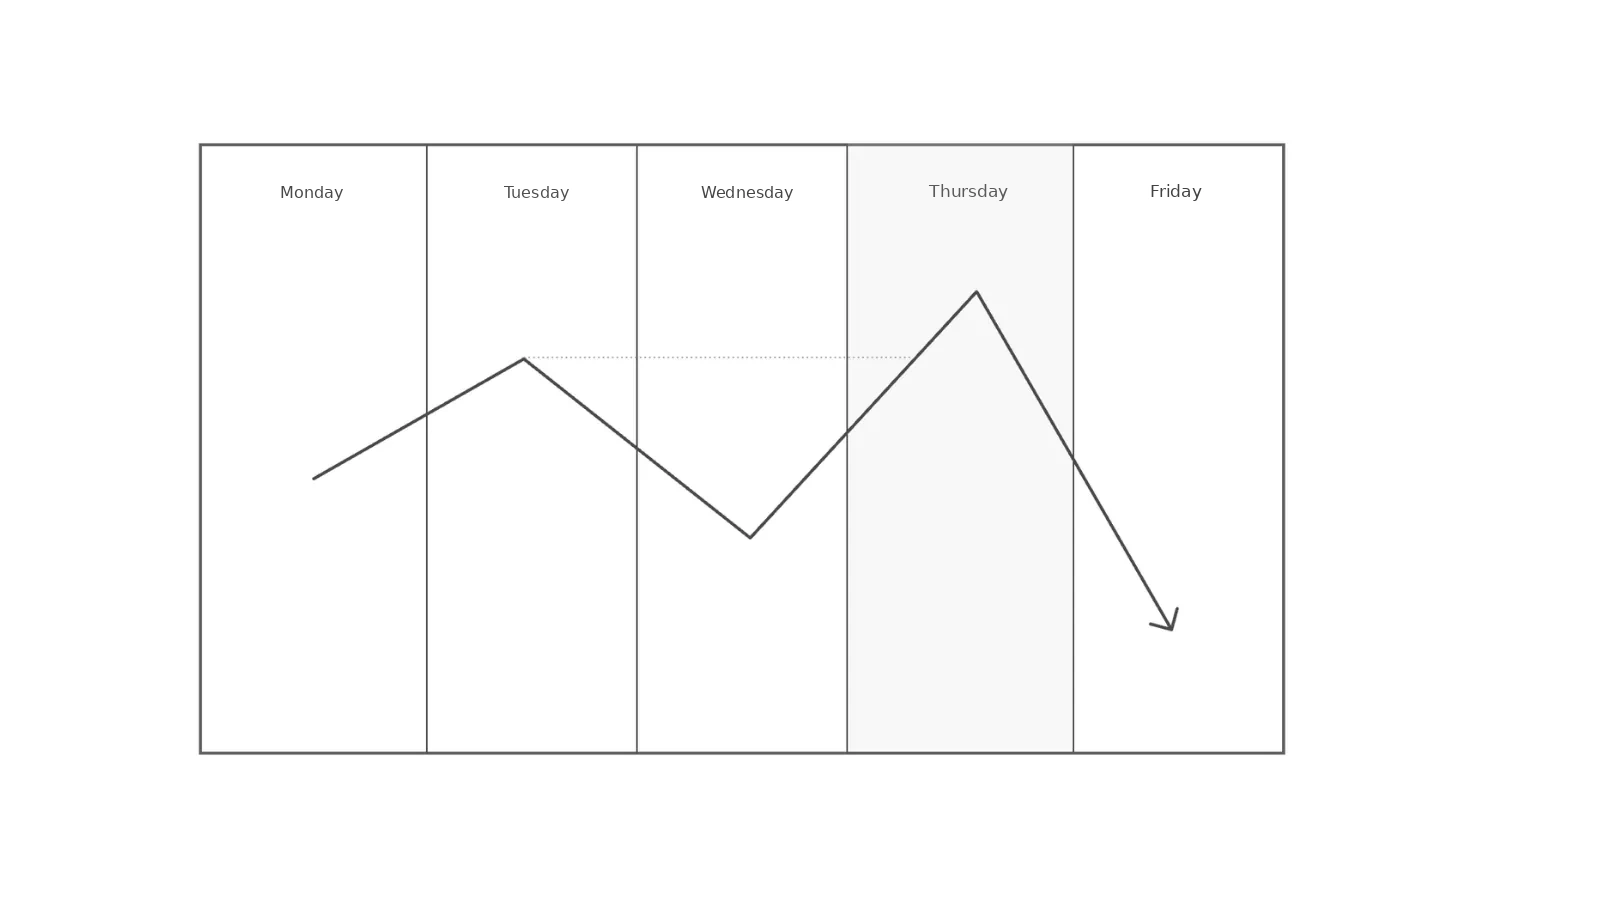 Weekly high on Thursday
Bullish Profile
- From Monday to Wednesday: price consolidates without returning to the Discount array, and may create false breakouts on both sides.
- Thursday: price manipulates with a sudden drop to the Discount array due to news, then reverses strongly higher.
- Friday: price expands strongly higher towards liquidity.
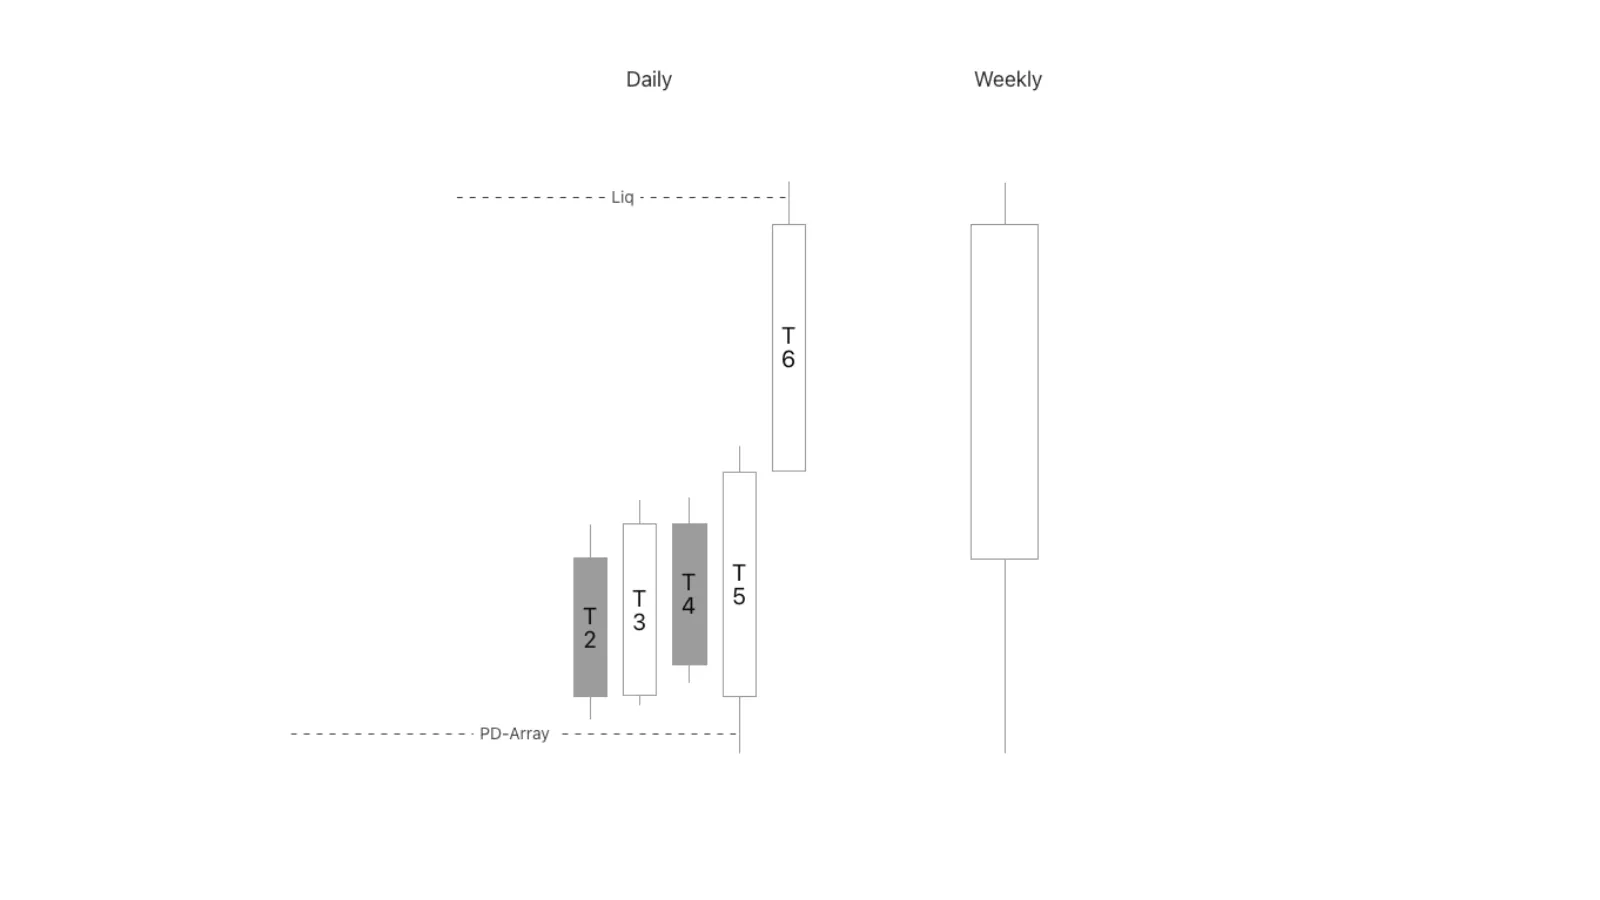 Thursday forms the weekly low
Bearish Profile
- Monday to Wednesday: price ranges below the Premium array but does not touch it, and may create stop-hunt traps at both the top and bottom (not necessarily).
- Thursday: price rises strongly into the premium array and then reverses lower.
- Friday: price expands lower towards liquidity.
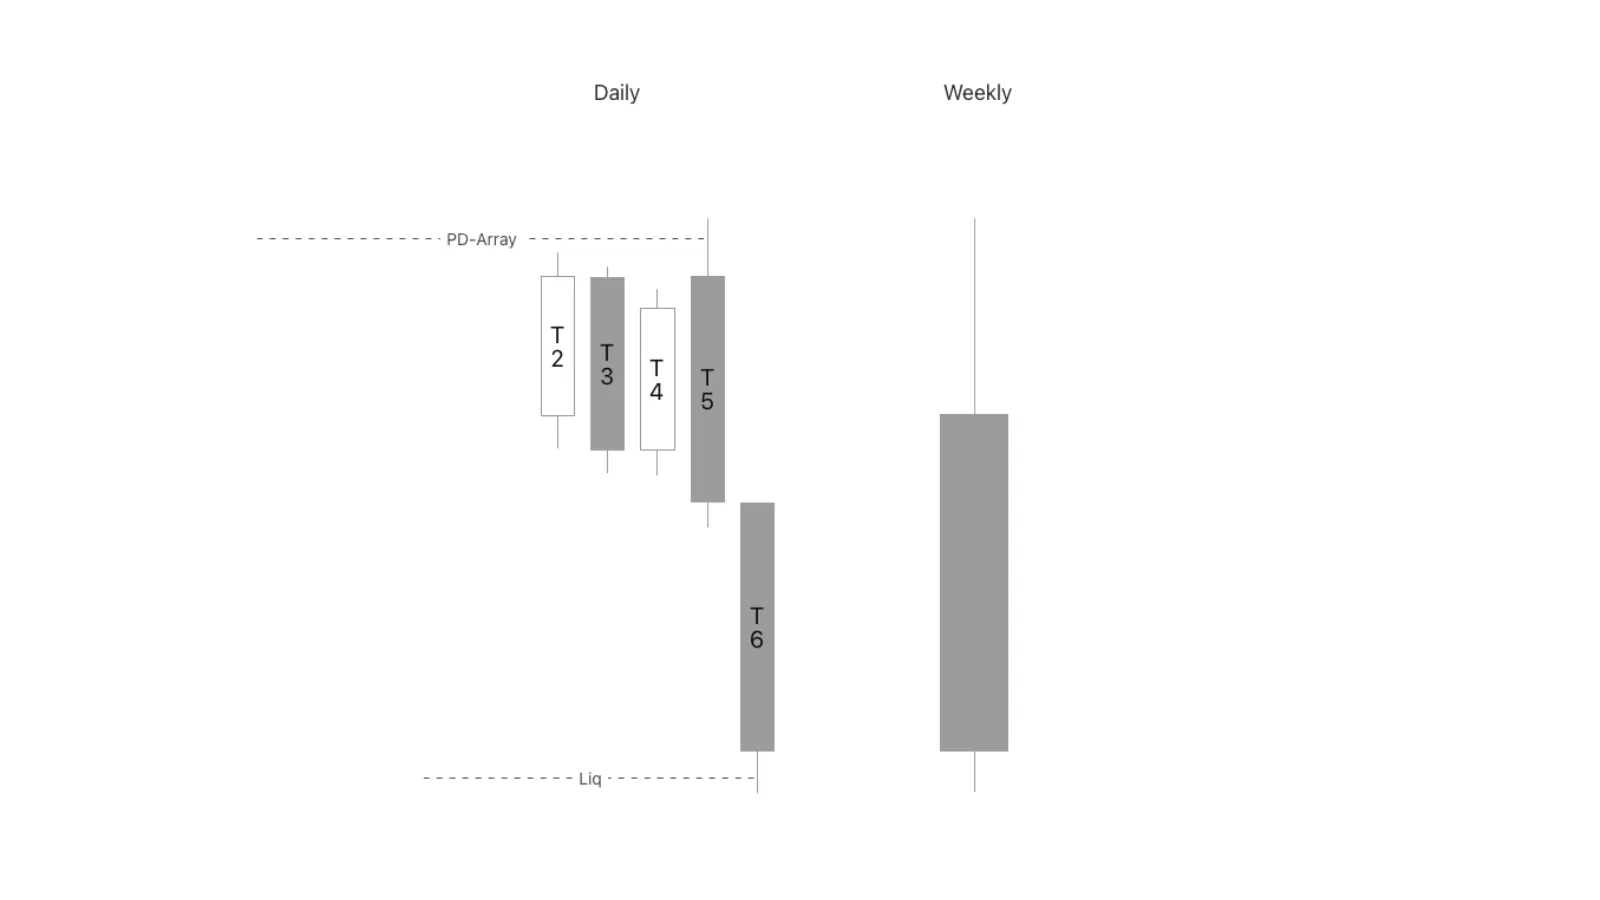 Thursday forms the weekly high
The Seek and Destroy model usually occurs in the summer months of July–August while waiting for important news such as interest rates and NFP.
4. Consolidation Midweek
An ICT Weekly Profile model in which price consolidates from the start of the week to the middle of the week, then expands and continues the trend.
This is a very difficult Profile to trade because no price manipulation appears as in the previous Profiles. Price leaves the PD Array right from Monday and does not return again.
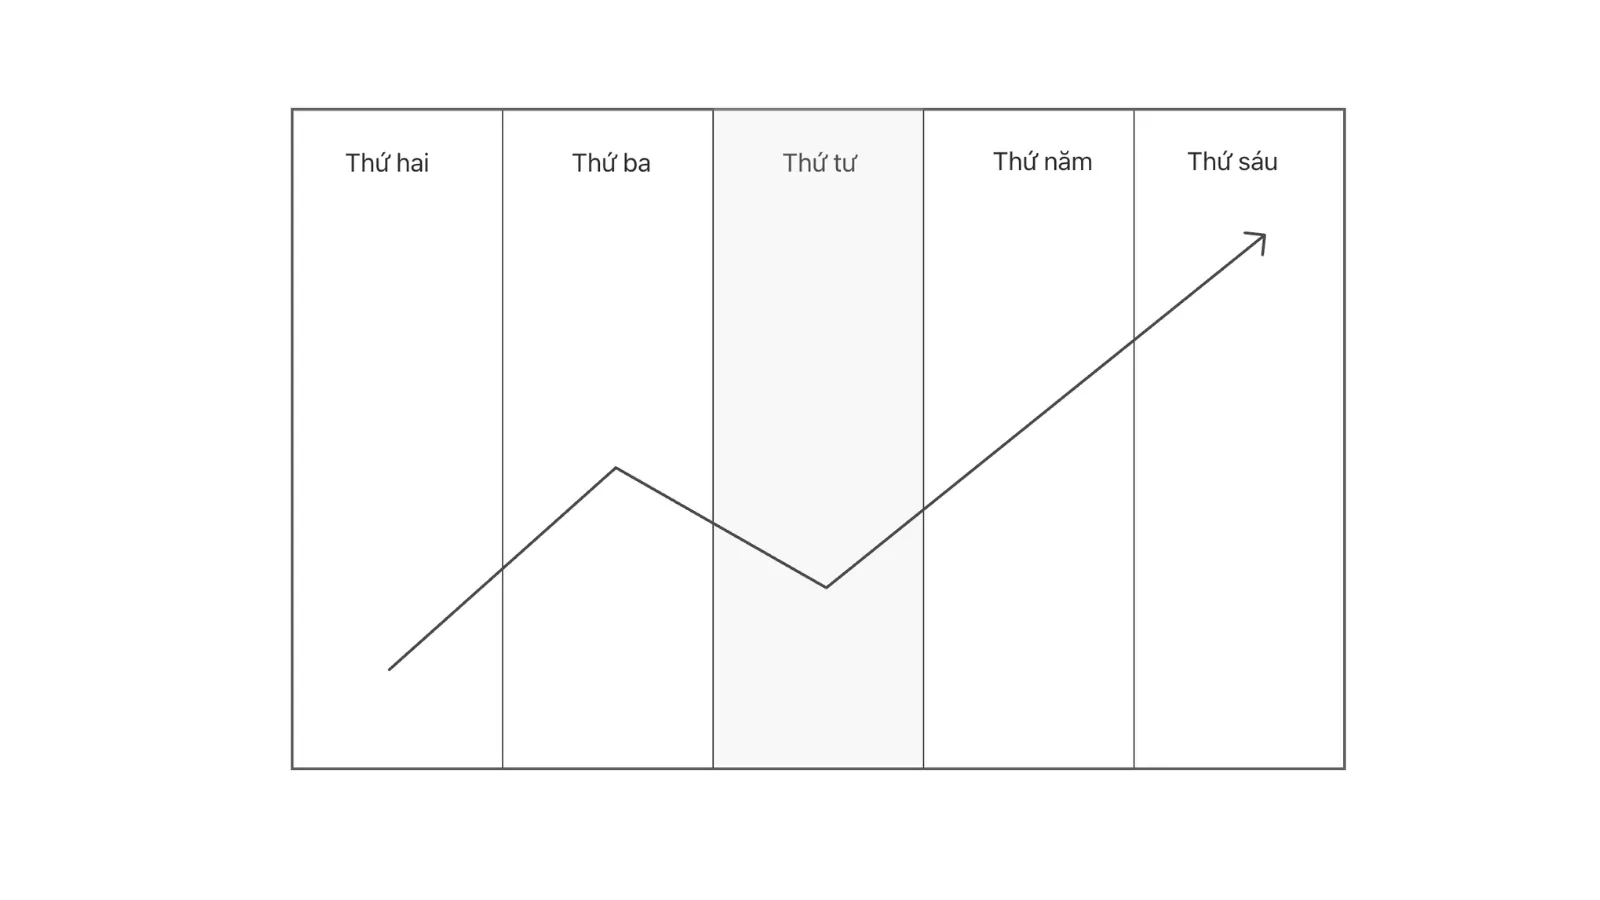 Midweek rally
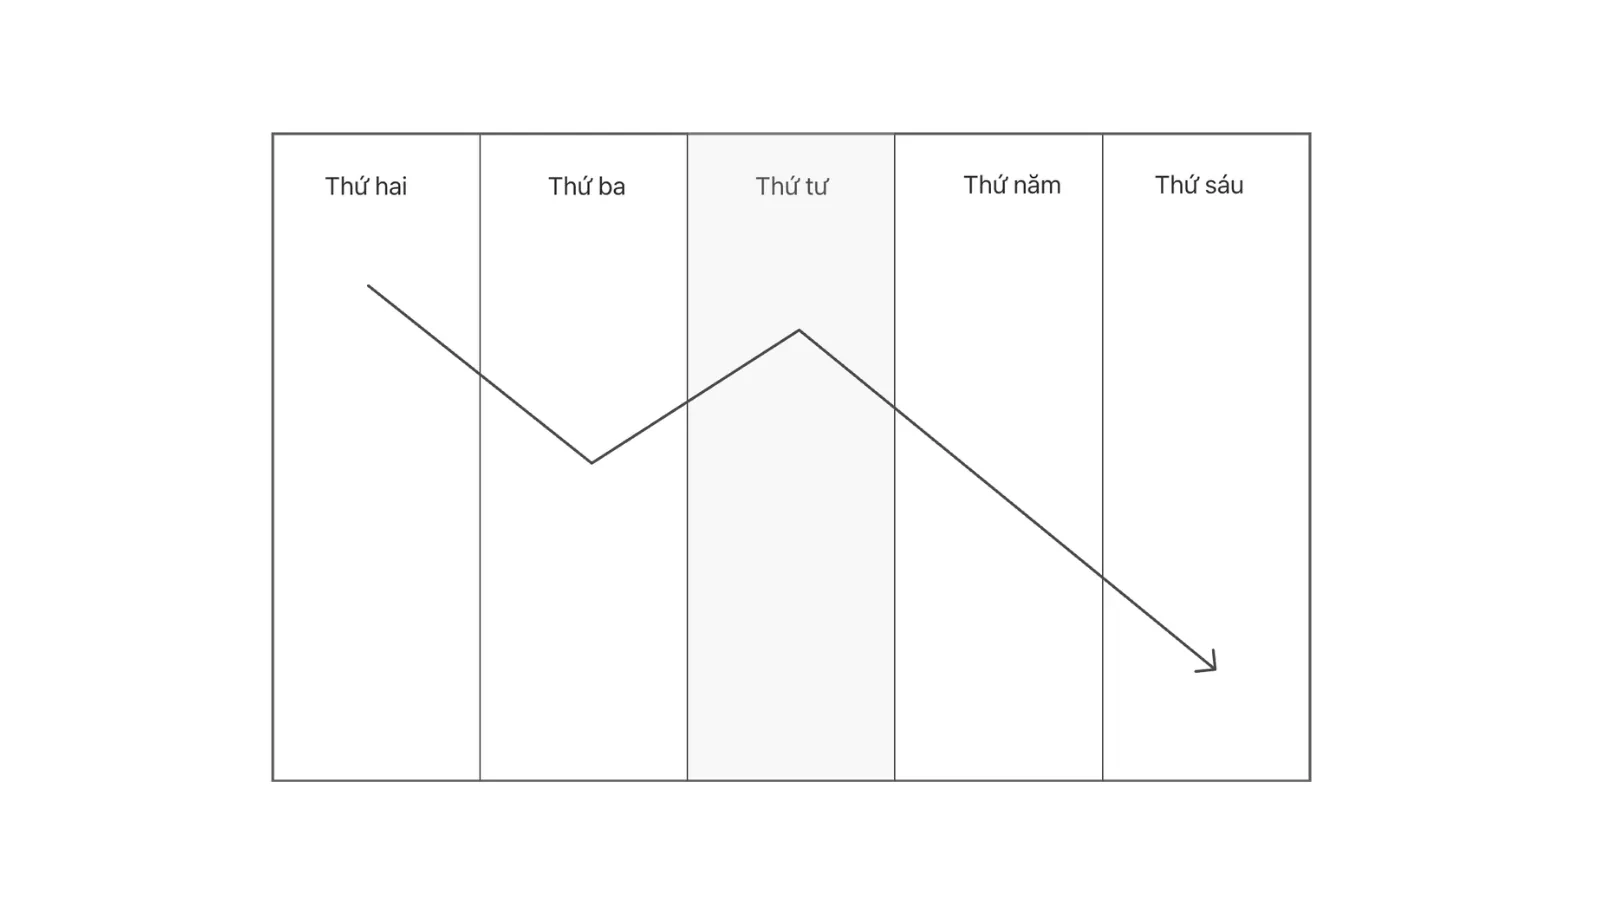 Midweek decline
Midweek Rally
- Monday to Wednesday: price consolidates and has not yet touched the premium array.
- Afterwards, it pushes up and expands on Thursday and Friday, breaking through the weekly high to touch the Premium area.
This model occurs when price has just left the Discount array and has not yet touched the Premium area, and at the same time there is no reversal signal, so it will likely expand up to the Premium area.
Midweek Decline
- Monday to Wednesday: price consolidates without yet touching the Discount array.
- Afterwards it drops strongly on Thursday and Friday back to the untouched discount array.
The signal appears when price has just rejected the Premium array without touching the Discount area, and there is no bullish signal. Price may continue to drop deeply to the HTF Discount area.
5. Following Expansion
A Weekly Profile model in which expansion continues the previous week's trend.
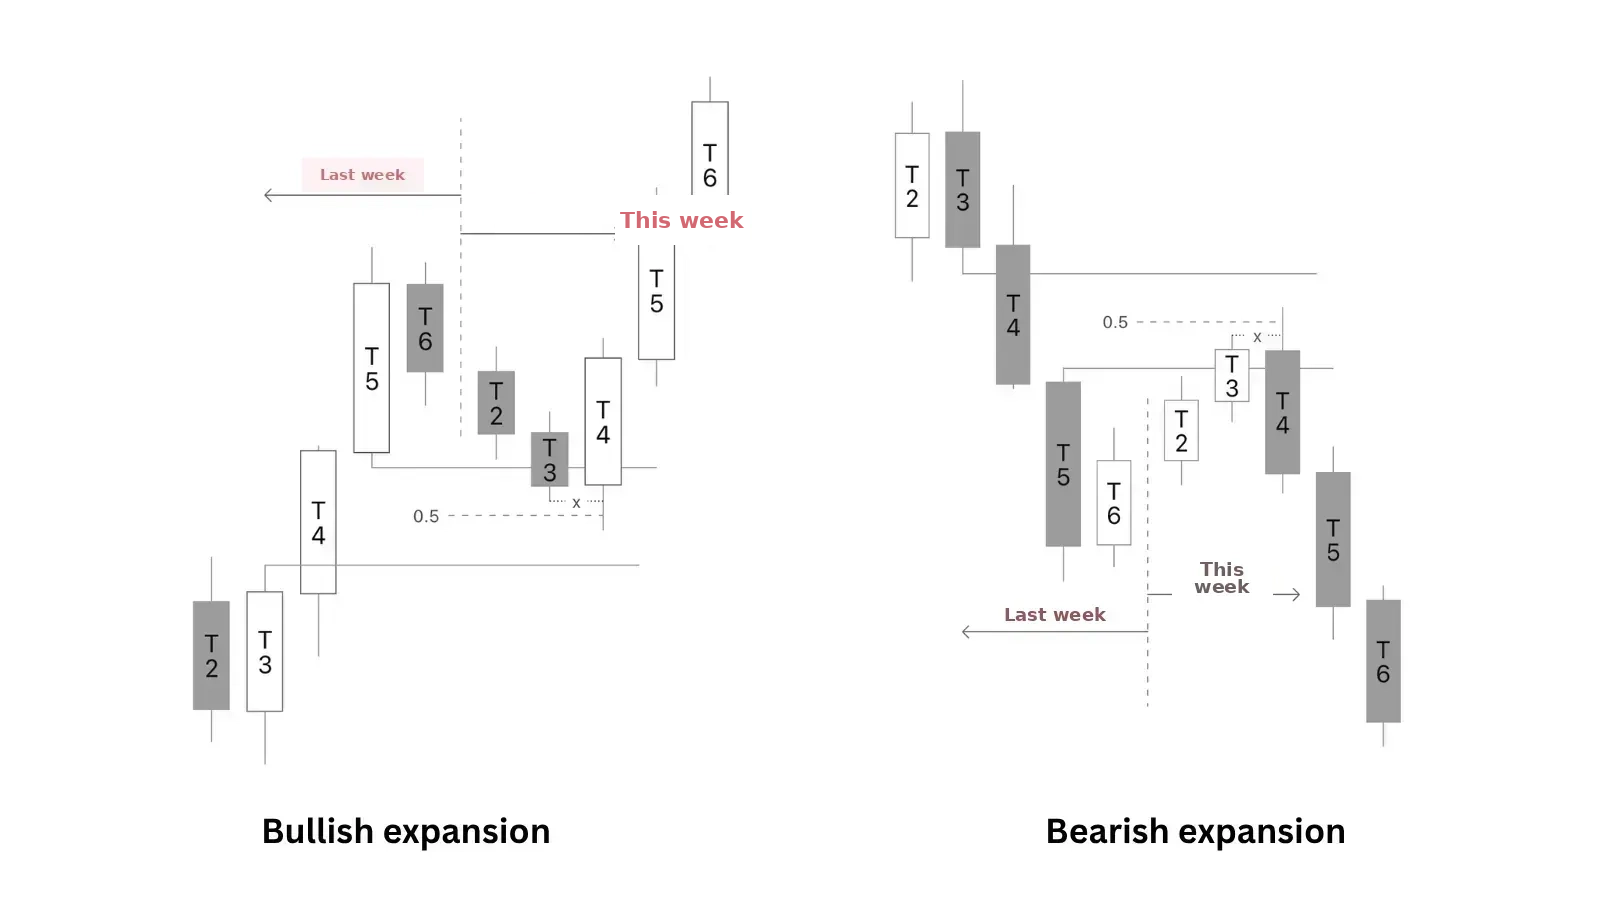 Following Expansion Weekly Profile
In the illustration:
- Previous week: we have a Weekly Profile in the Classic Expansion form → wait for price to pull back to the FVG of last week's displacement.
- Monday & Tuesday: price ranges above the PD area → no Profile yet.
- Wednesday: price has returned to the HTF PD area and taken Tuesday's liquidity → Midweek Reversal Profile.
Conclusion
The common characteristic of the Weekly Profile models is that three forms appear during the week: consolidation → manipulation → expansion (except for Following Expansion).
- Monday: not suitable for trading because Monday is a day for collecting data, and no Profile has formed yet.
- Tuesday to Thursday: price manipulates and forms Profile data → suitable for trading.
- Friday: not suitable for trading because it is the day that decides the shape of the Profile, relating to “book squaring”, profit-taking, or end-of-week liquidity manipulation. However, counter-trend trading is still possible if conditions are sufficient (TGIF setup).
The ICT Weekly Profile models help traders capture weekly price behaviour in a systematic and logical way.
By combining them with Premium/Discount Arrays on higher timeframes, you can forecast the timing of the weekly high/low, and thereby build a more effective trading strategy.
💡Advice: You should not use Profile models in isolation, but combine them with factors such as liquidity, time and economic news to optimise results.
Weekly Profile Example
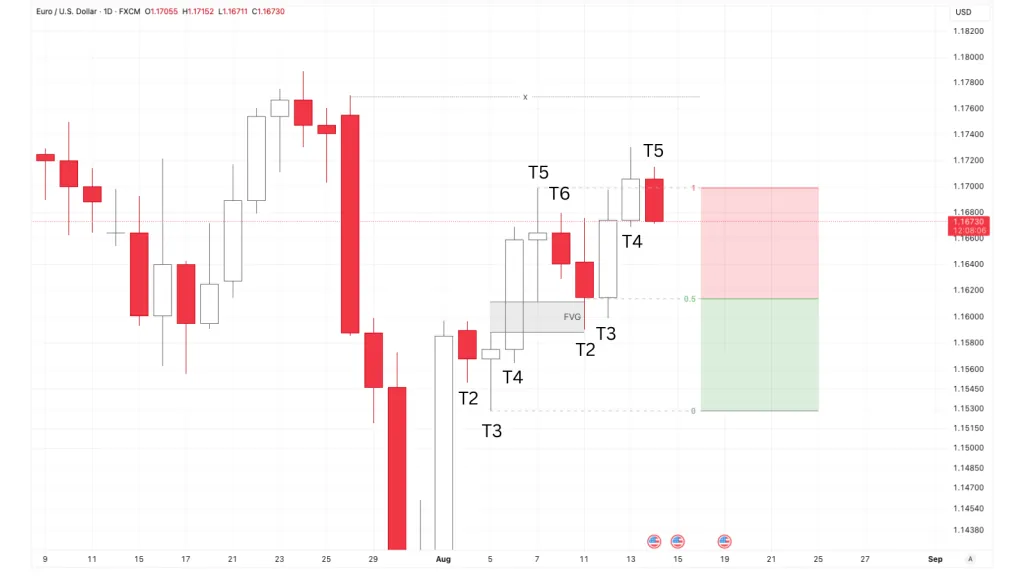 Weekly Profile Classic Expansion example on EU
Example of a Classic Expansion setup on EU posted in the Trading Hub 3.0 Discord group:
- Monday: price moves sideways during the day to collect data.
- Tuesday: price manipulates, dropping down to take Monday's liquidity.
- Wednesday + Thursday: price expands, rising strongly.
- Friday: price corrects, seeking the FVG.
- Into the next week, price follows with Following Expansion, continuing the trend.
Read structure 10x faster with JUKA
JUKA maps SMC structure — swings, BOS, CHoCH and inducement zones — automatically on any TradingView chart. No more hand-drawing structure for hours.
Get JUKA — $150