ICT Part 7: Daily Bias
What Is Daily Bias?
Daily Bias is a concept that helps determine the main direction of price movement during the day.
Understanding Daily Bias helps us recognise that price fluctuations are not random, but have a target and a direction.
Determining Daily Bias needs to be based on experience and on following specific rules.
Having a bullish bias does not mean you must buy every day, and having a bearish bias does not mean you must sell every day.
Traders need to be patient and wait for clear conditions that match their expectations.
This includes looking for Discount areas to buy and Premium areas to sell, all within the defined timeframe.
Determining Daily Bias
PDH & PDL
One of the key factors for determining daily bias is the previous day's high & low (PDH & PDL).
These levels act as reference points that help traders assess the strength of the current trend and anticipate the next trend.
 Daily bias based on PDH & PDL
PDL & PDH can also act as liquidity areas for a reversal:
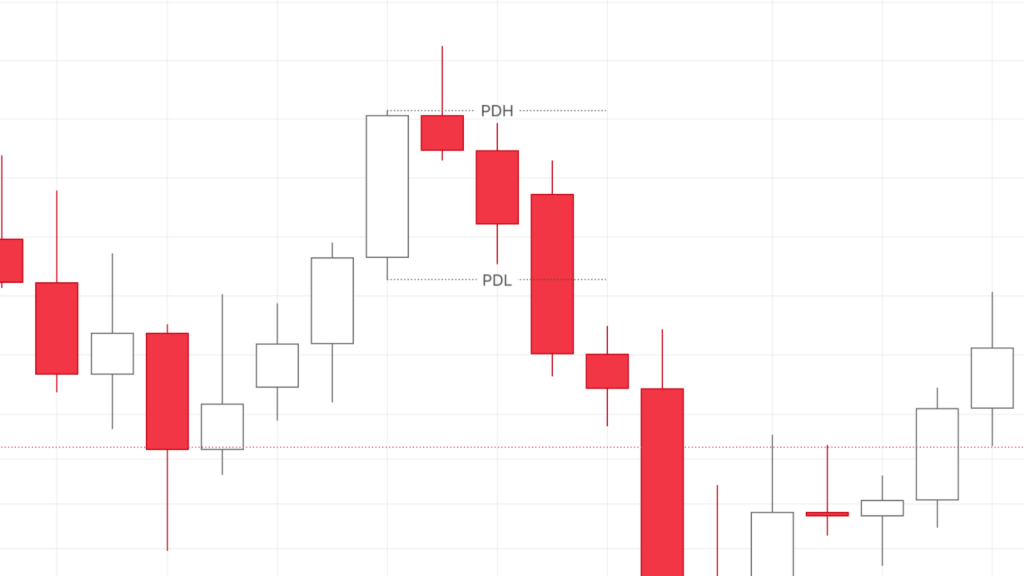
- If price takes PDH liquidity and cannot close with a candle body above it (a sweep), this may be a reversal. We can look for a sell entry down to PDL because price can no longer maintain its upward momentum.
- If price takes PDL liquidity and sweeps with a wick below it, this may indicate a reversal. We can look for a buy entry up to PDH because price cannot maintain its downward momentum.
The following example shows price sweeping the previous day's PDH with a wick and then dropping back to PDL.
 Daily Bias PDH PDL
This also applies to PWH/PWL and Swing Highs/Lows.
It is not always the case that price taking PDH/PDL liquidity gives such a bias; we need to combine it with liquidity and structure factors to arrive at an accurate bias.
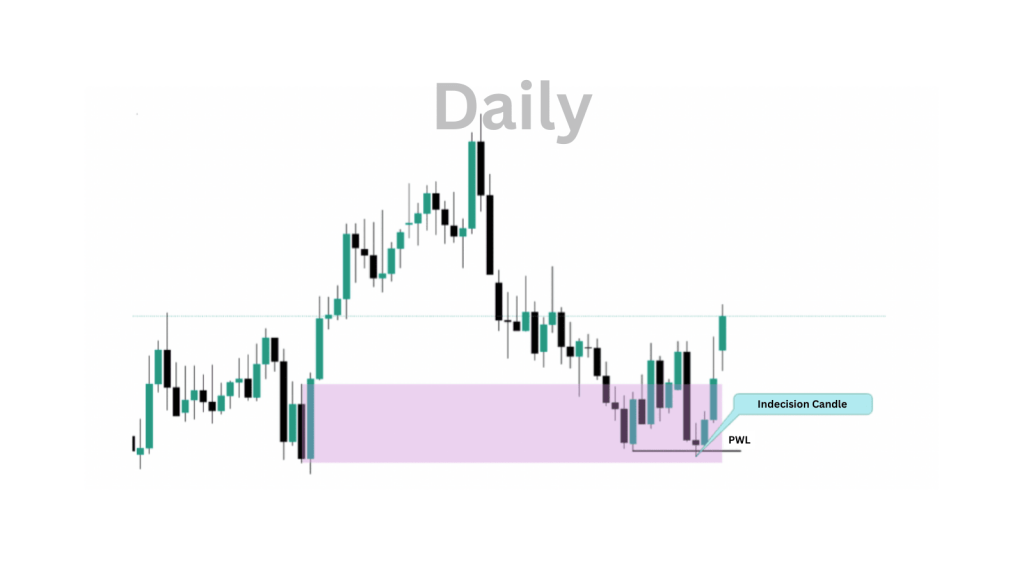
The example below shows price lying inside a POI on the D1 timeframe, and an Indecisive Candle (short body, long wicks) that swept PWL with its wick.
In this context, even though the Indecision Candle did not sweep PDL with its wick, the next candle still reversed.
 Indecision Candle sweeping PWL
Steps to Determine Daily Bias
The main idea of BIAS is to determine where the daily candle will move to by answering the questions: What has price already taken? Where can price be led to? What has still not been taken?
To determine Daily BIAS, you need to follow a systematic process, combining the following factors:
1. Analyse Market Structure
- Analyse the overall context by looking at higher-timeframe charts, determining the Weekly Profile.
- Analyse the previous day's price action, checking for confluence between daily and weekly.
2. Identify Liquidity
- Drop to a lower timeframe and identify internal liquidity (FVG) and external liquidity (PDH, PDL).
- Look for price shifts such as Displacement or No Displacement. Displacement is very important because it tells you your next bias.
3. Find the Entry Point
- From the Dealing Range, wait for price to correct back to a PD Array or OTE area, in confluence with POI areas.
- When price pulls back to PD/OTE, price must not displace to the opposite side.
- Have MSS confirmation on a lower timeframe (the higher the timeframe, the more valuable the confirmation).
Note that price does not always pull back to a PD Array.
Daily Bias Example
 Daily Bias on the D1 timeframe
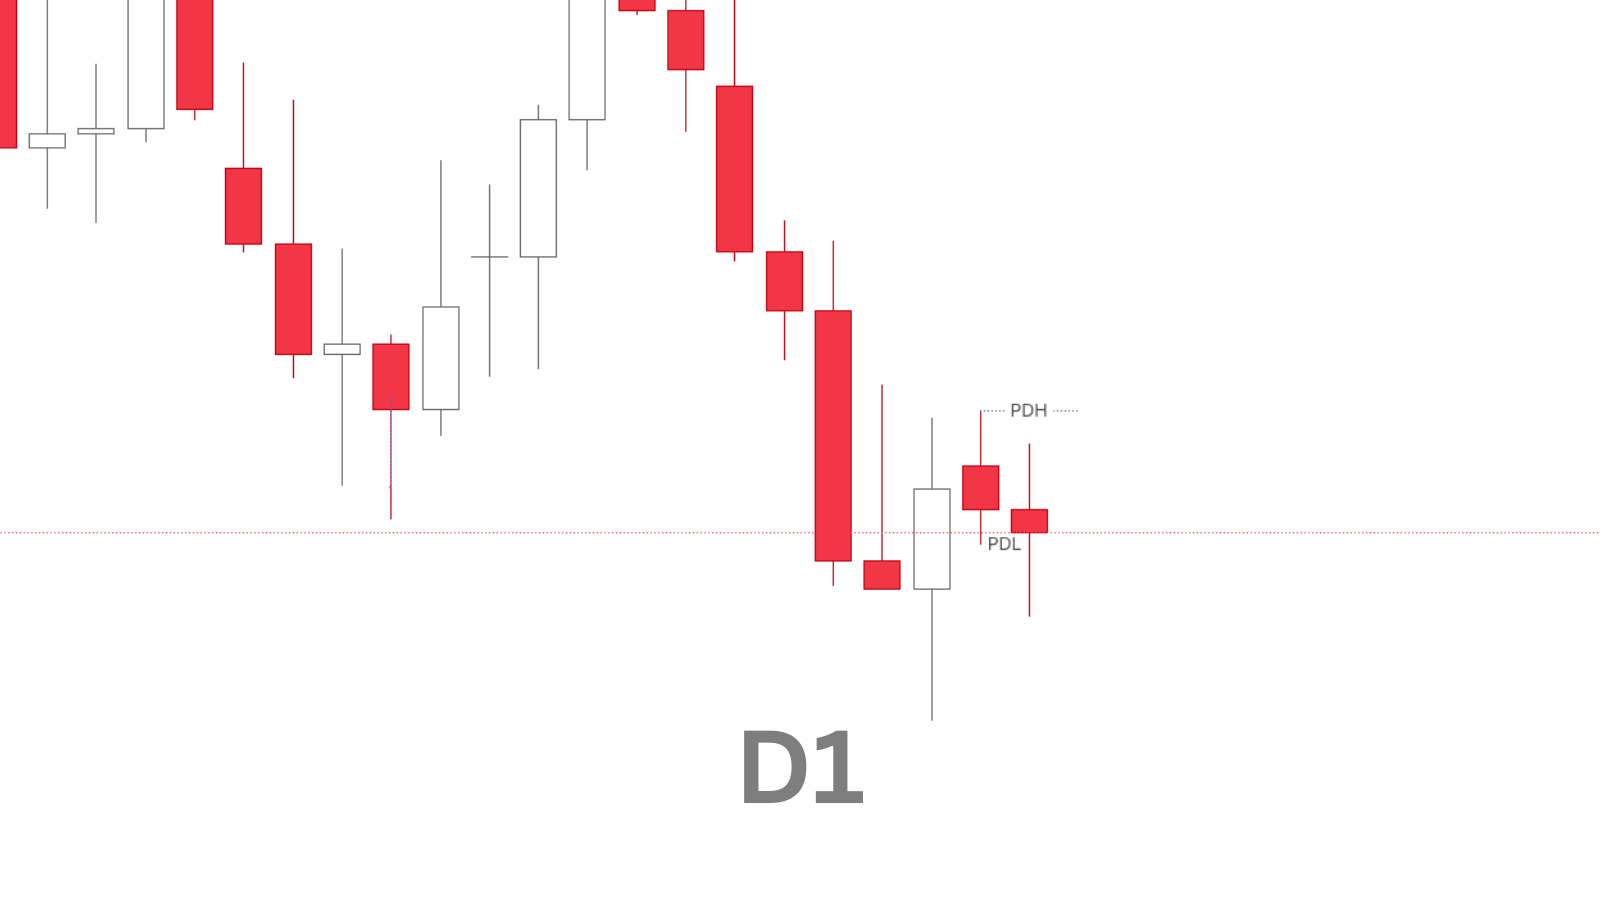
In the example in the image above, the third candle sweeps Monday's PDL on Tuesday, anticipating a Weekly Profile in which price runs a Classic Expansion, expanding on Wednesday and Thursday to PDH.
→ The next day's bias is bullish.
 Daily Bias on the H1 timeframe
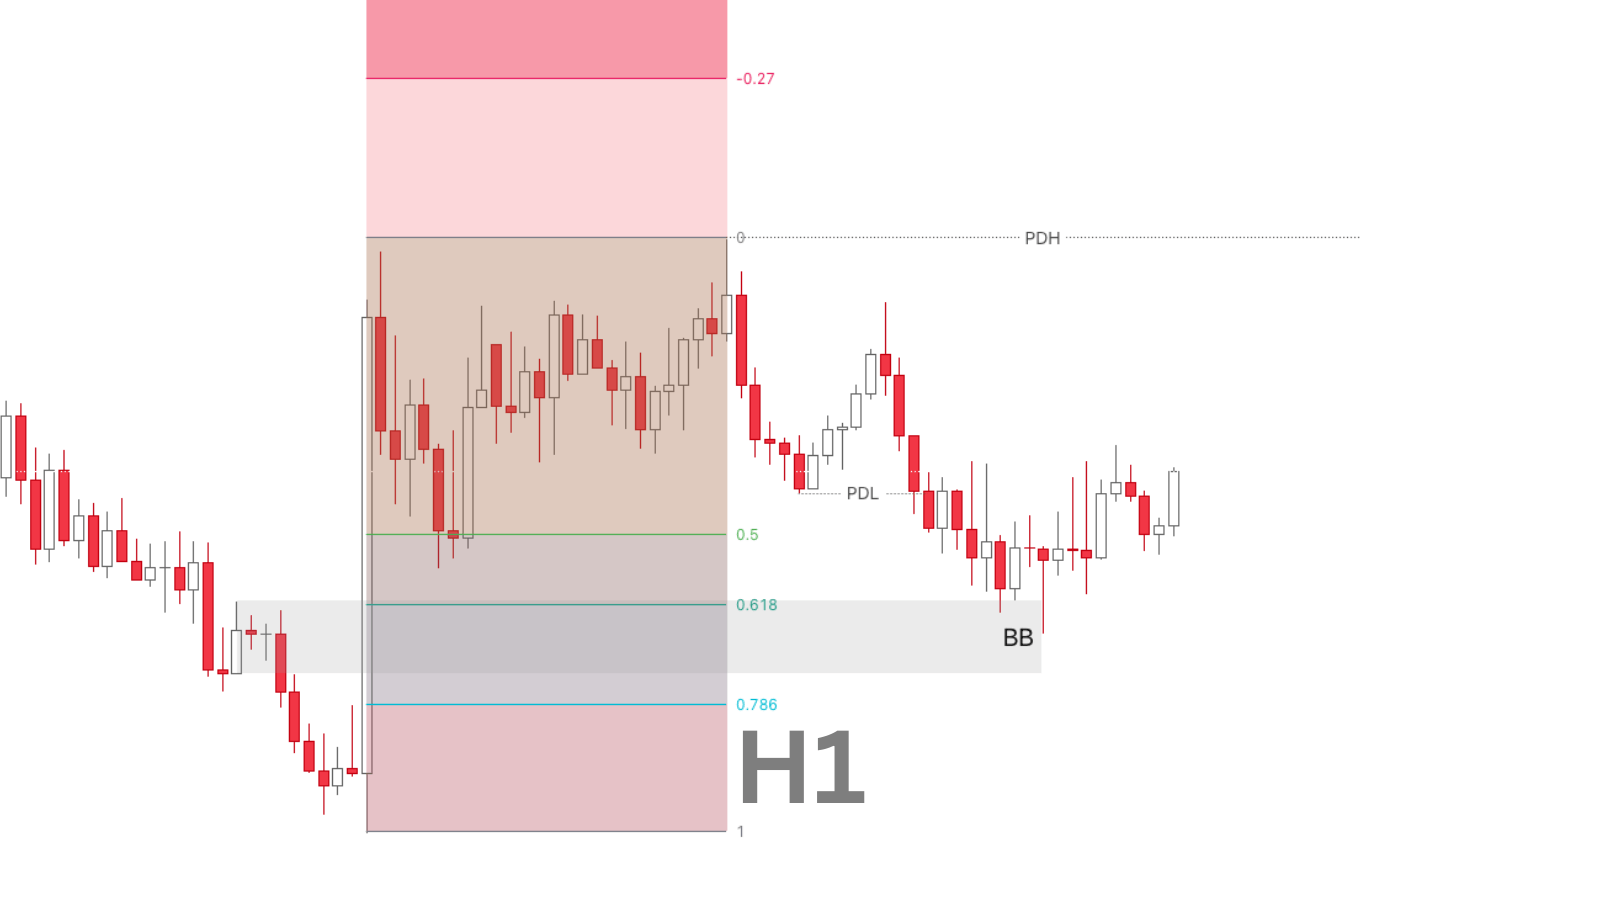
Dropping to the H1 timeframe, we notice that on Tuesday price came back to tap a Breaker Block at the sweet spot of the OTE.
→ This is exactly the price manipulation behaviour after the previous day's sideways phase.
Answering the three questions above:
- What has price taken: price has taken PDL, has tapped the BB, has returned to Discount.
- Where will price likely go: PDH.
- To find "What has still not been taken", drop to an even lower timeframe to check.
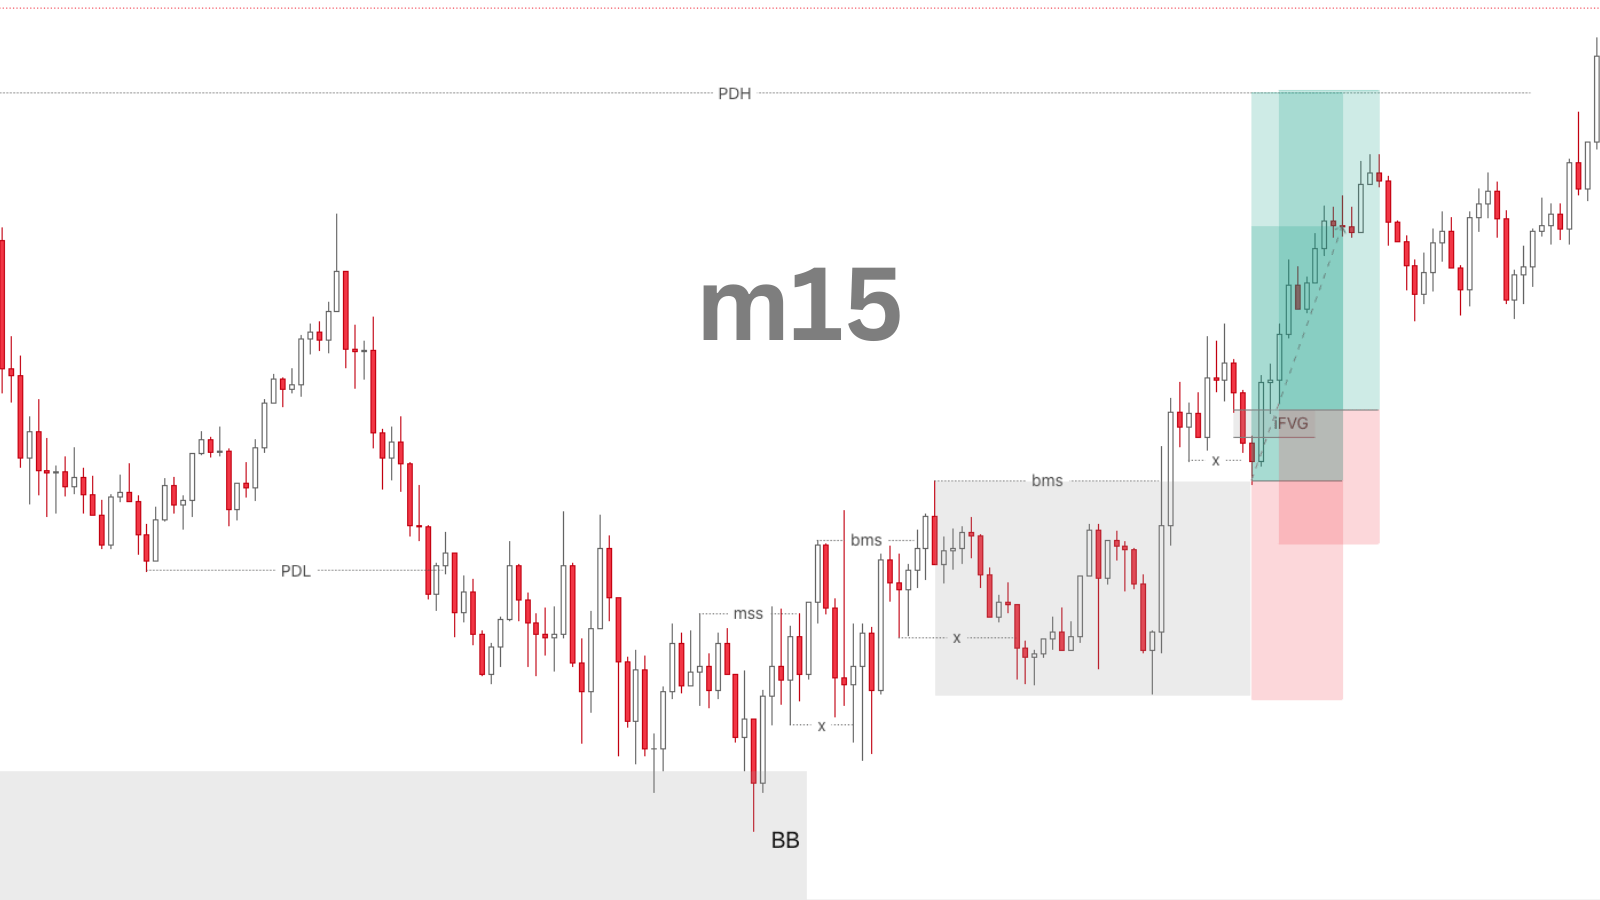 Daily Bias on the m15 timeframe
Drop to the m15 timeframe for CE, and notice that price displaces through BMS. There is still IDM liquidity in the OF area below that has not been taken (according to Hub 3.0).
→ Open an entry at Order Flow and take profit at PDH. Or you could also enter at an iFVG after price bounces back up, which would give a better RR ratio and be safer.
Read structure 10x faster with JUKA
JUKA maps SMC structure — swings, BOS, CHoCH and inducement zones — automatically on any TradingView chart. No more hand-drawing structure for hours.
Get JUKA — $150