ICT Part 8: Central Bank Dealers Range (CBDR)
In the ICT method, an Intraday Profile describes price behaviours over a specific period of the trading day, in order to determine the high of a sell day and the low of a buy day.
To grasp Intraday trading, you first need to learn about CBDR, a very useful timing concept.
What Is CBDR?
In ICT, CBDR (Central Bank Dealers Range) is a price range of the central bank dealers that takes place from 02:00 pm – 08:00 pm UTC-4 (New York time), used to predict the highest price of the day (HOD) or the lowest price of the trading day (LOD).
From 02:00 PM – 08:00 PM is the period when large banks and institutions (Smart Money) are analysing the open positions in the market, continuing into the Asian session.
During this period, they will “anchor price”, creating a balanced price area (the flout).
Through that, they will decide: continue pushing price up, or push it down to take liquidity (manipulate) in the next day's London and New York sessions.
 CBDR daily low
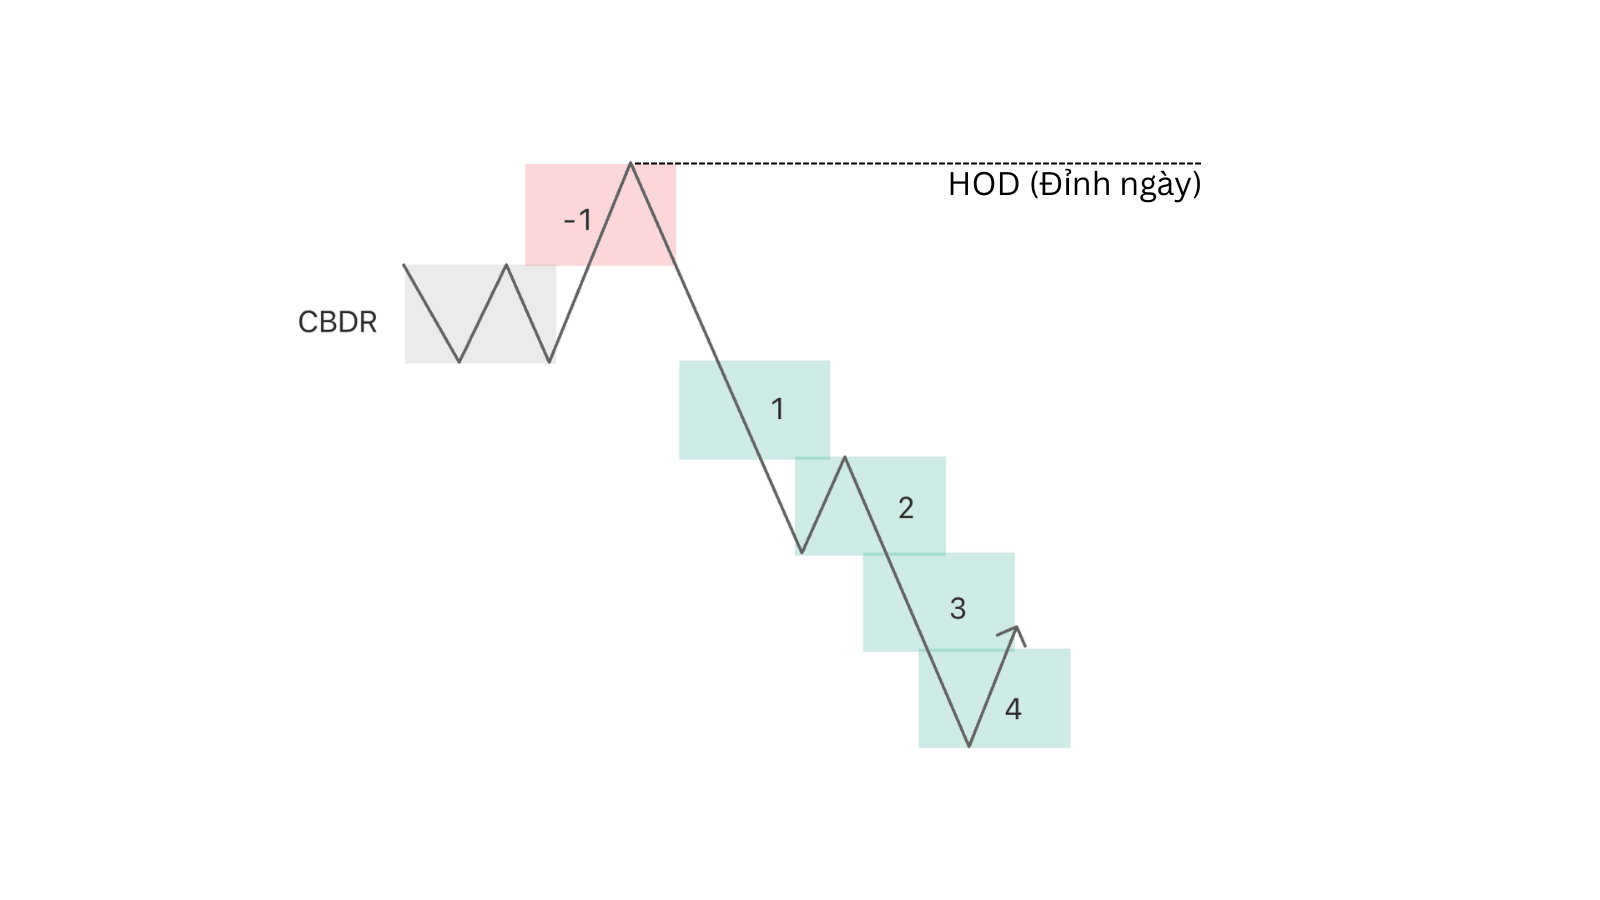 CBDR daily high
How to Identify CBDR
Conditions for a CBDR:
- Time: from 02:00 PM – 08:00 PM (New York), usually Tuesday – Thursday.
- Height: measured by the high and low of the CBDR (prioritise candle bodies over candle wicks).
- Optimal range: the CBDR should lie within 20–30 pips. If it exceeds 40 pips it will not be effective.
- Usually applied to the Nasdaq and S&P 500 indices, and can also be applied to major currency pairs such as EUR/USD and GBP/USD.
How to Use CBDR for Trading
On a trading day, Smart Money usually pushes price against the trend by 1–2 times the CBDR range to take liquidity, creating the LOD (low of day) or HOD (high of day) in the London session.
Then in the New York session, price will move in the main trend direction over a distance of up to 4 times the CBDR range.
In cases where there is no liquidity in the opposite direction, the market will push price straight away.
The suitable timeframe for trading with CBDR is m15.
| 4 Standard Deviation|
---|---|---
| 3 Standard Deviation|
Intraday Sell Profile (HOD) ↓| 2 Standard Deviation|
| 1 Standard Deviation|
| DBCR|
| 1 Standard Deviation|
| 2 Standard Deviation| Intraday Buy Profile (LOD) ↑
| 3 Standard Deviation|
| 4 Standard Deviation|
First, we need to determine whether the Daily Bias is bullish or bearish.
With a bullish bias, we will look for an Intraday Buy Profile. With a bearish bias, we will look for an Intraday Sell Profile.
To draw the CBDR, use the Fibonacci Standard Deviation tool, dragging the 1–0 range to correspond to the range of the Flout.
Intraday Sell Profile
On Bearish days, a valid Sell Profile is divided into two forms: Normal Protraction and Delayed Protraction, based on when the Protraction of the Intraday Profile occurs.
Normal Protraction – Sell Profile
This is the Profile form in which price pushes against the main trend in the London session to manipulate (Judas Swing).
The time markers of a Normal Protraction Sell Profile are as follows:
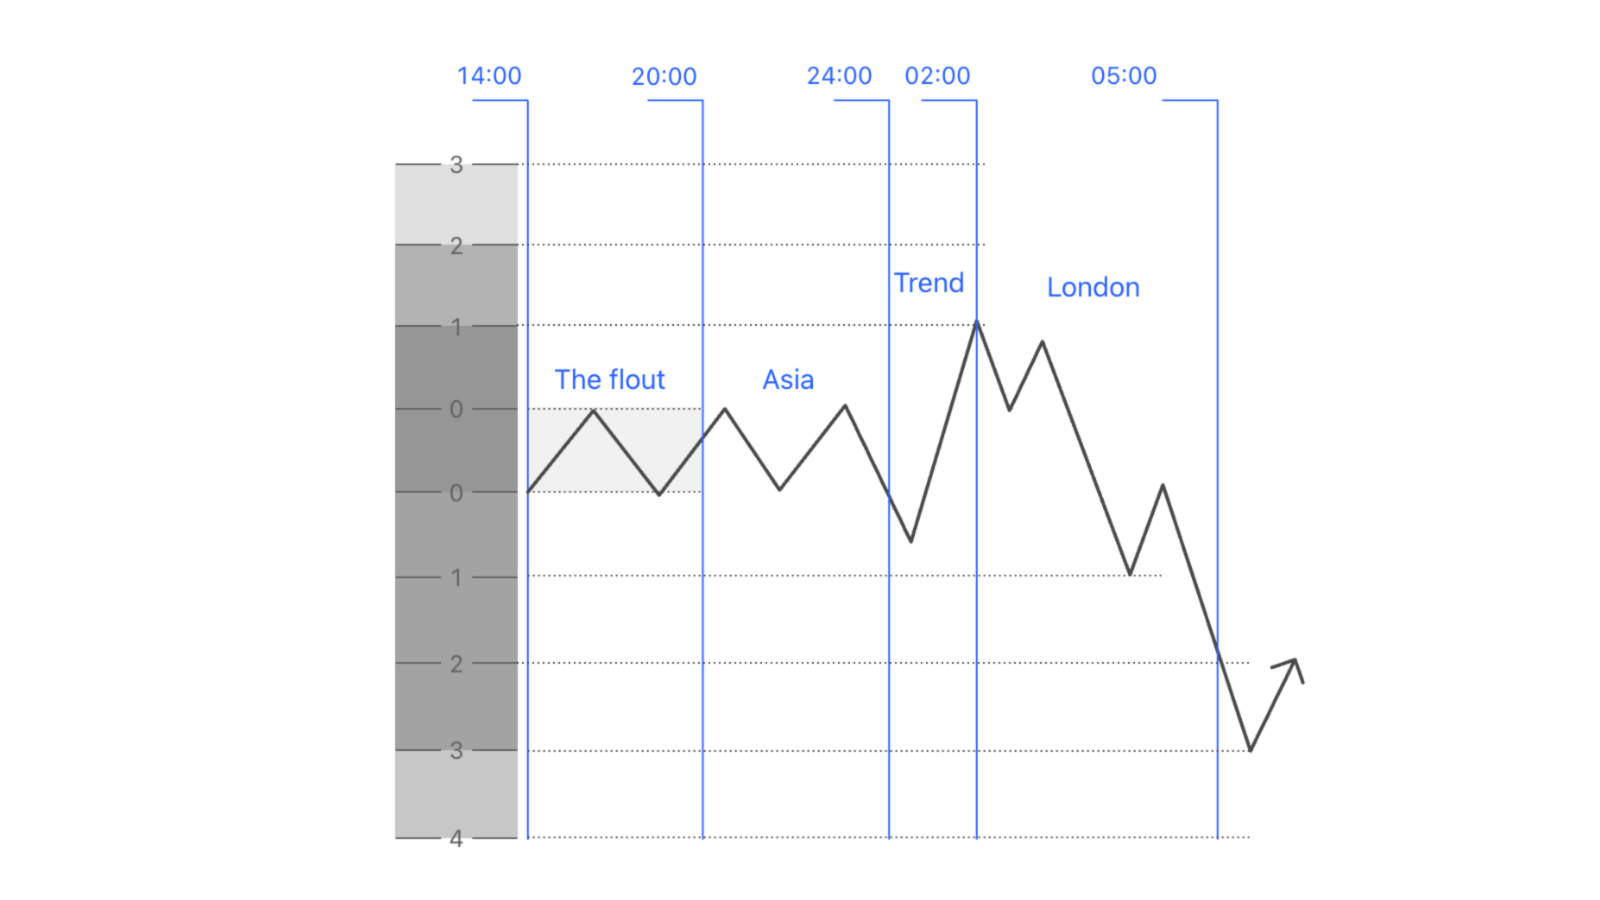
- 02:00 PM – 08:00 PM: CBDR < 40 pips.
- 08:00 PM – 12:00 AM: The Asian session lies within 10–30 pips.
- 12:00 AM – 02:00 AM: The Protraction phase pushes price up to take liquidity, with a Protraction length of 1–2 times The Flout.
Note: The time markers above are not always exact; they also depend on when the Judas Swing occurs (which will be covered later).
How to Trade a Normal Protraction – Sell Profile
When the conditions have been satisfied, you will see price being manipulated after 12:00 AM; a dip before the rise is also acceptable.
Steps to take:
- Wait for price to push up against the bias over a distance equal to 1–2 times the CBDR range excluding wicks (the Flout). This may be the HOD.
- Wait for MSS (you may drop to a timeframe ≤ m15) and identify a PDA to enter in the Premium zone.
- Stop-loss above the London session high. Take profit can target DOL liquidity or a Fibonacci level of 3–4 times the Flout.
Example of a Normal Protraction Sell Profile:
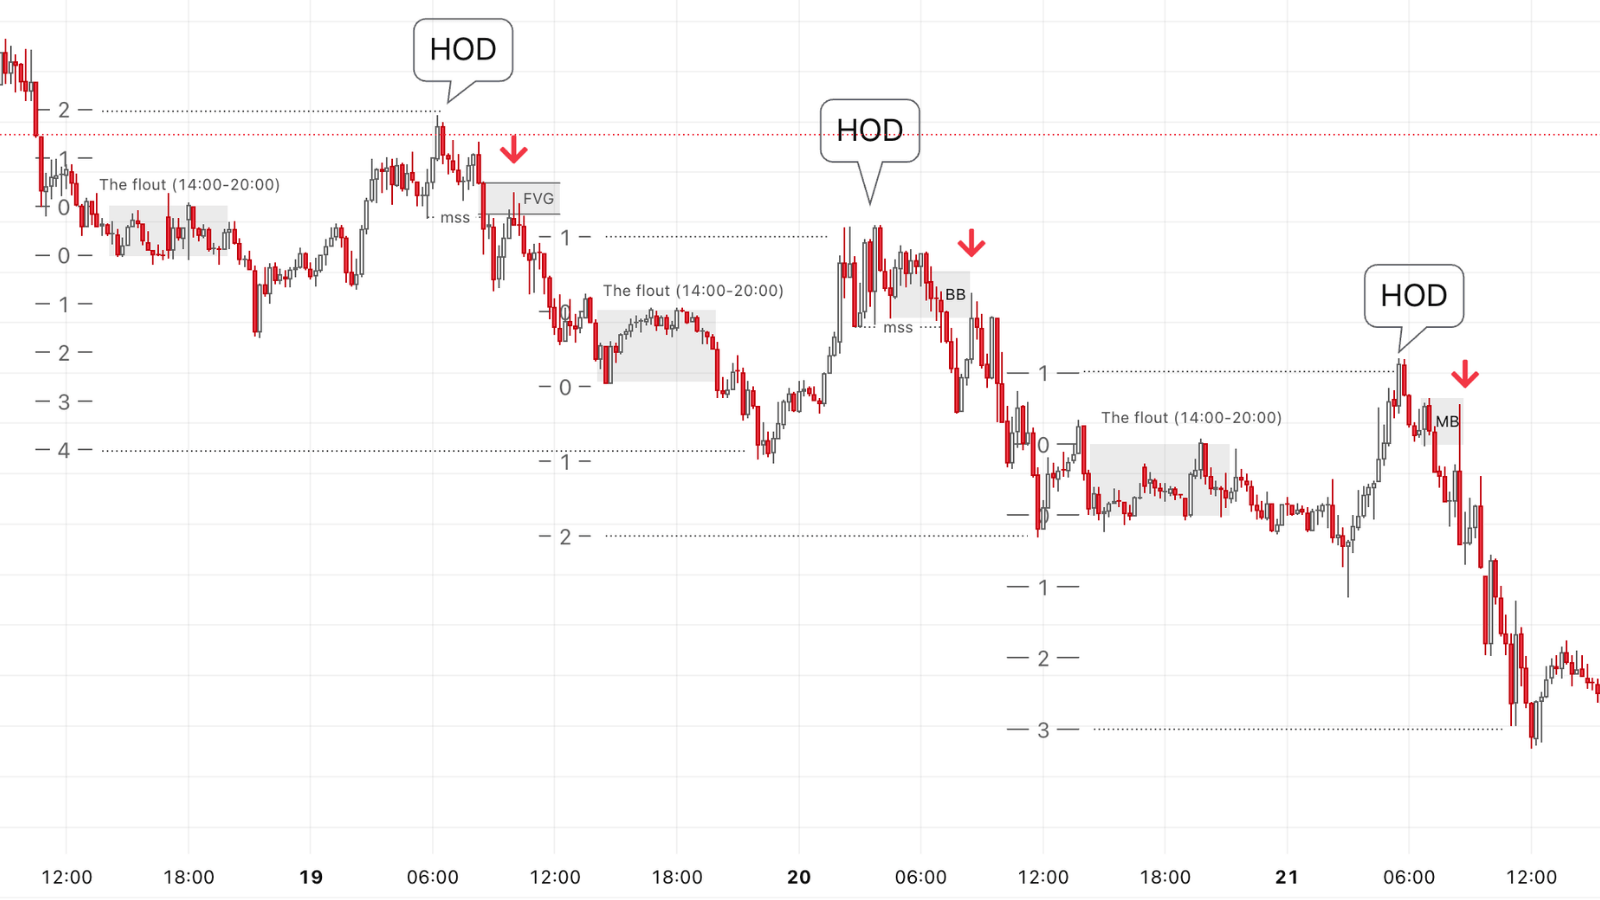 CBDR Normal Protraction Sell Profile on EU
Delayed Protraction – Sell Profile
This case occurs if after 12:00 AM price does not rise to take liquidity as expected, meaning the Protraction is delayed and price drops in line with the main HTF bias.
The time markers are as follows:
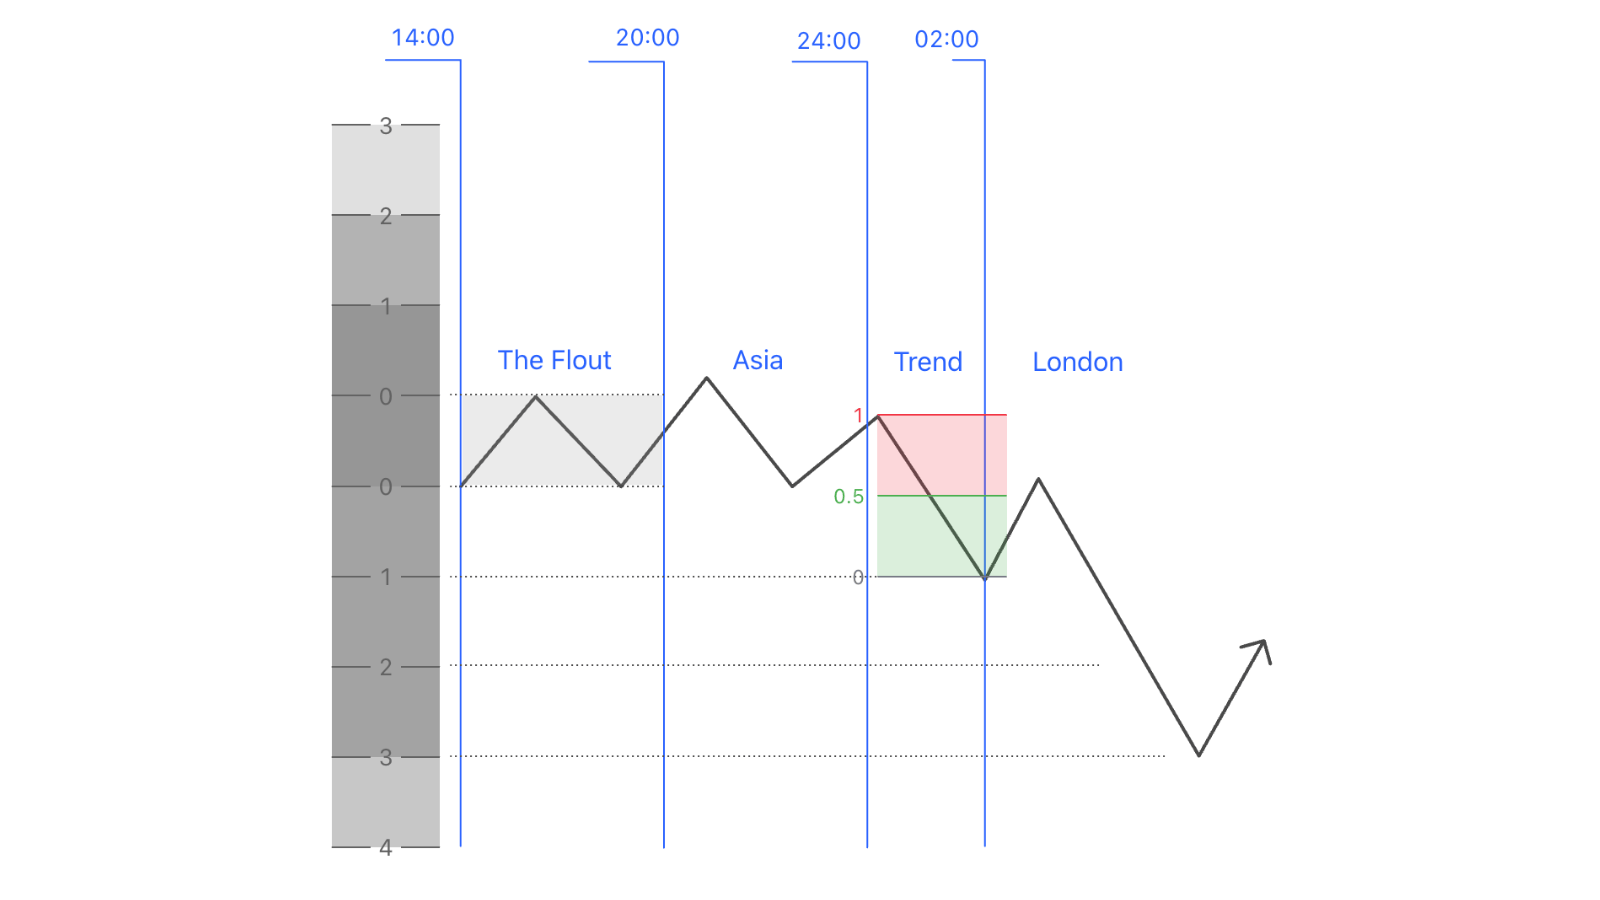
- 02:00 PM – 08:00 PM: CBDR < 40 pips.
- 08:00 PM – 12:00 AM: The Asian session lies within 10–30 pips.
- 12:00 AM – 02:00 AM: Price drops in line with the main bias; price does not go up to take liquidity.
- After 02:00 AM: Price pulls back up to a PDA.
How to Trade a Delayed Protraction – Sell Profile
When the conditions above are satisfied, we prepare for a valid Sell Profile.
After 02:00 AM, you will see price pull back up; carry out the following steps:
- Mark the nearest dealing range to find a PD Array.
- Wait for MSS on a timeframe ≤ m15 to enter a sell in the Premium zone.
- Stop-loss above the dealing range, Take profit at DOL or 3–4 times the Flout.
Example of a Delayed Protraction – Sell Profile:
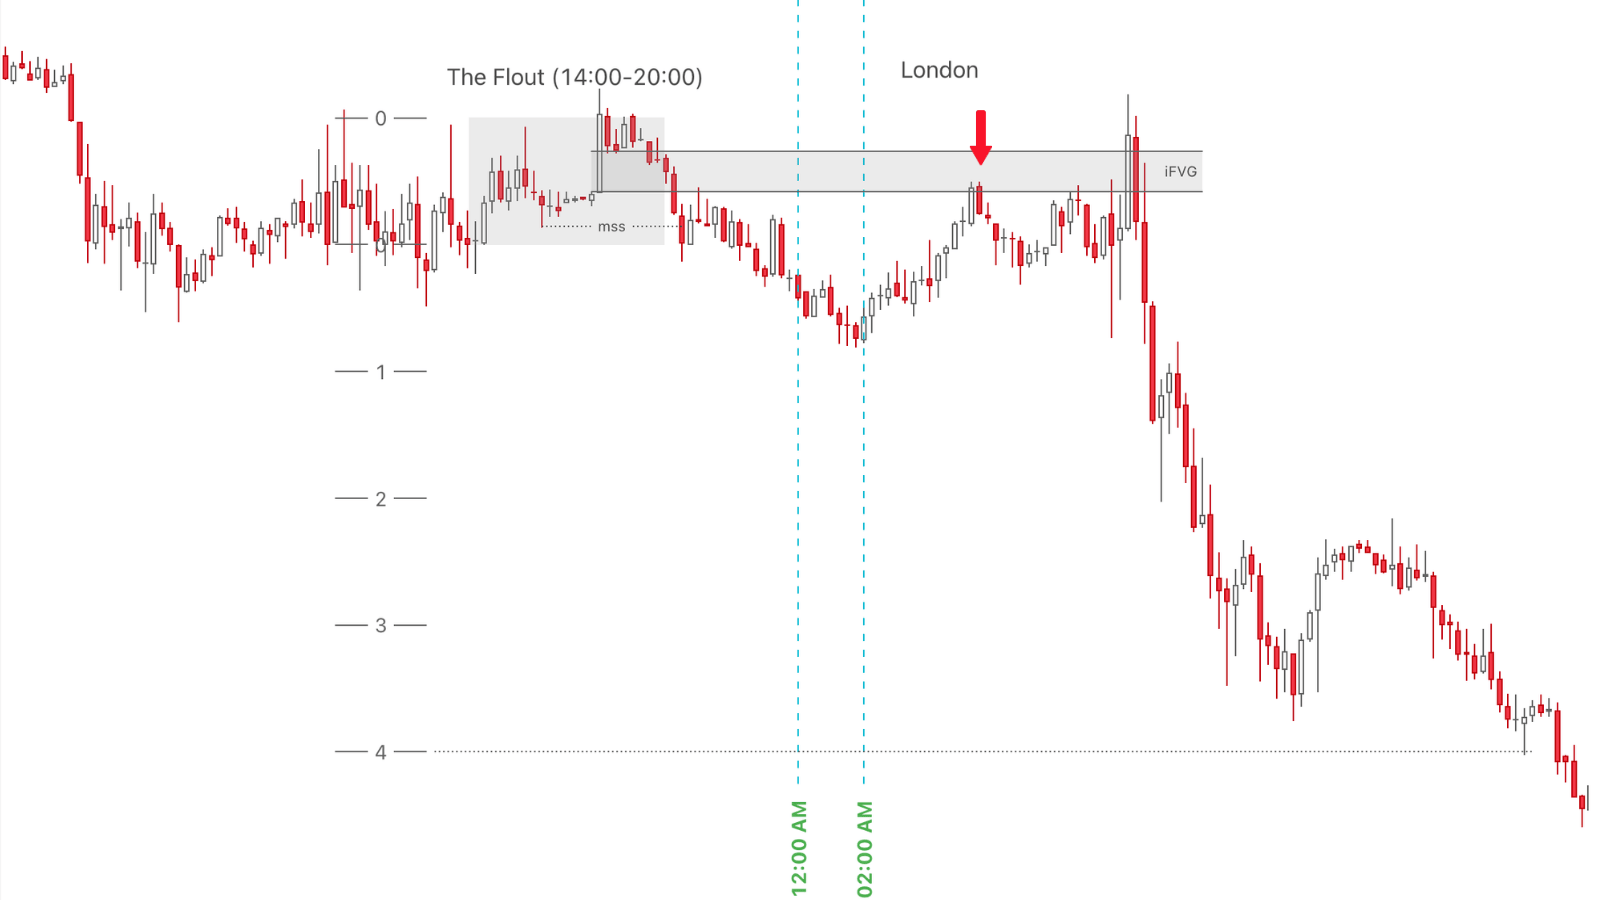 CBDR Delayed Protraction Sell Profile on the US500 index
Intraday Buy Profile
Similar to the Sell Profile, the Intraday Buy Profile is divided into two forms based on when Protraction occurs in the London session: Normal Protraction and Delayed Protraction.
Normal Protraction – Buy Profile
Conditions:
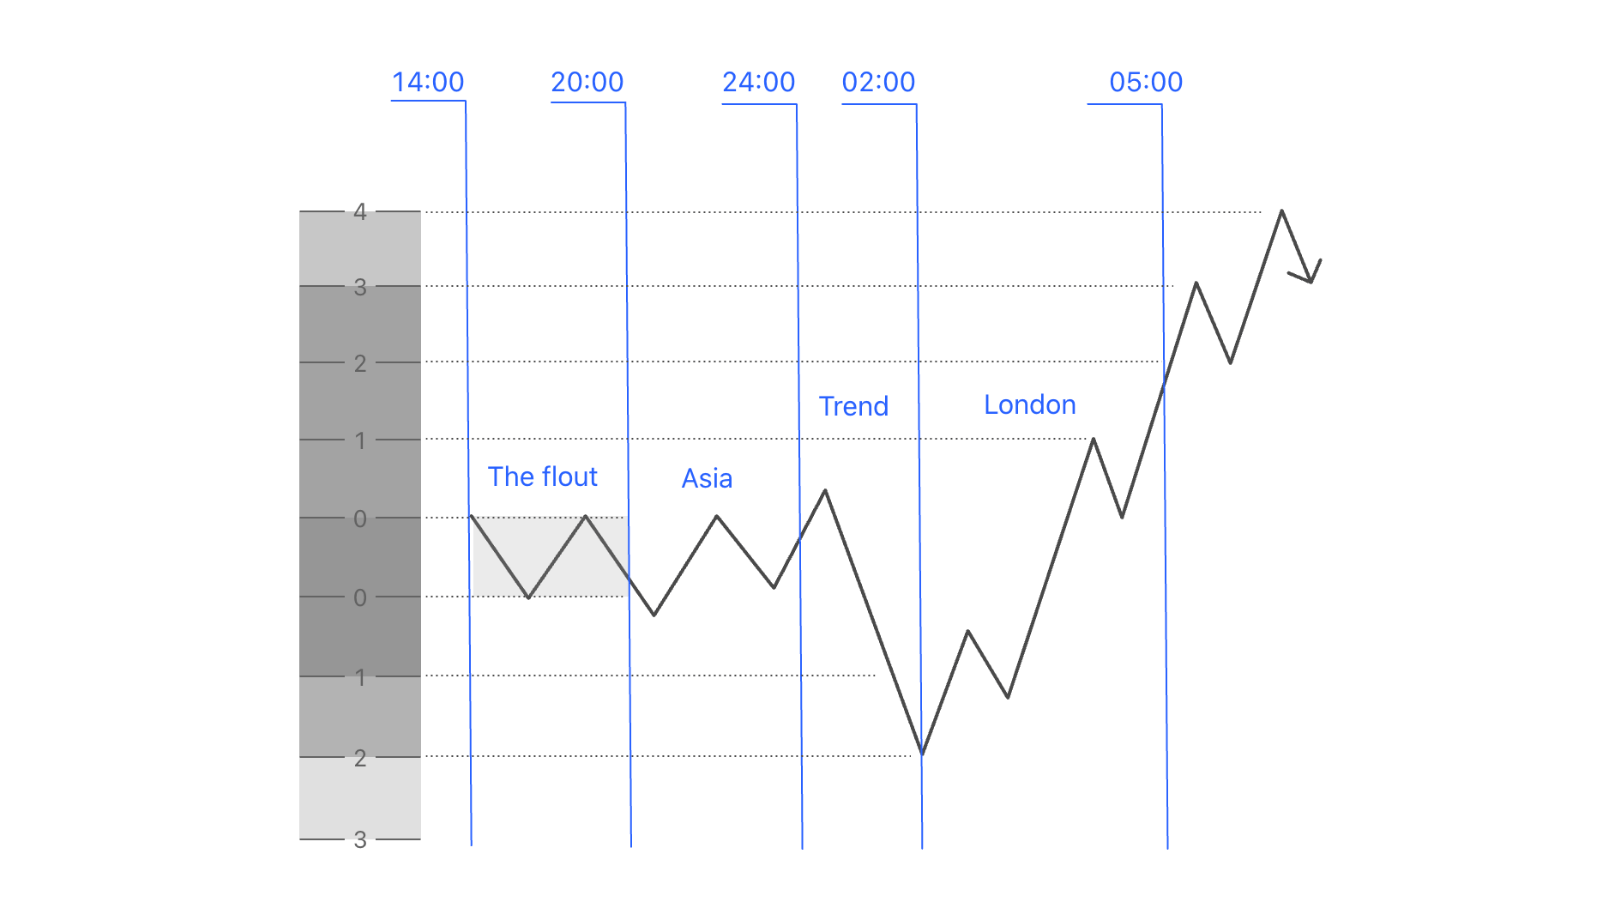
- 02:00 PM – 08:00 PM: CBDR < 40 pips.
- 08:00 PM – 12:00 AM: The Asian session lies within 10–30 pips.
- 12:00 AM – 02:00 AM: Manipulation occurs, pushing price down to take liquidity, with a Protraction length of 1–2 times The Flout.
Note: In real backtesting, I have found that price does not necessarily have to manipulate during the 12:00–02:00 AM window. There are times when this happens after 02:00, at the time of the London Killzone (which will be covered later).
How to Trade a Normal Protraction – Buy Profile
Trading steps:
- After the Midnight Open, wait for price to push down against the bias over a distance equal to 1–2 times the Flout. This may be the LOD.
- Wait for MSS (you may drop to a timeframe ≤ m15) and identify a PDA to enter in the Discount zone.
- Stop-loss below the London session low. Take profit can target DOL liquidity or a Fibonacci level of 3–4 times the Flout.
Example of a Normal Protraction – Buy Profile with the US 500 index:
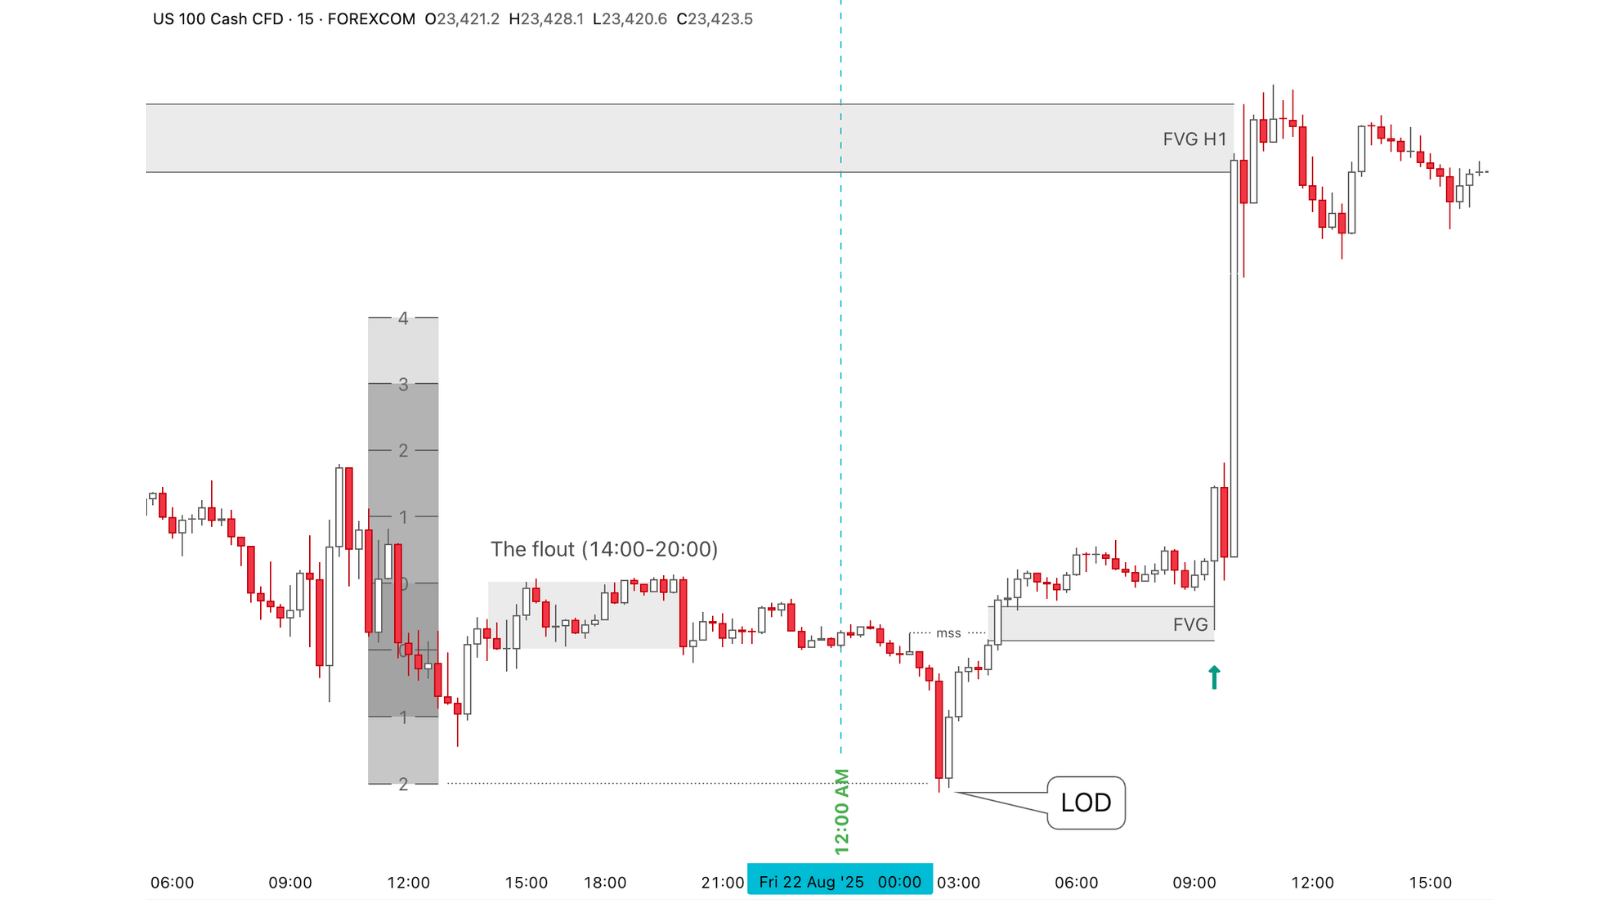 Example of a Normal Protraction Buy Profile on the USTech index
After 12:00 AM New York, price moves down, manipulates to take all the liquidity below, and immediately turns back to create MSS.
A buy order at an m15 FVG with Take profit at an H1 FVG gives a profit of 2–3R.
Delayed Protraction – Buy Profile
Conditions:

- 02:00 PM – 08:00 PM: CBDR < 40 pips.
- 08:00 PM – 12:00 AM: The Asian session lies within 10–30 pips.
- 12:00 AM – 02:00 AM: Price rises in line with the main bias; no manipulation occurs.
- After 02:00 AM: Price pulls back down to a PDA.
How to Trade a Delayed Protraction – Buy Profile
Trading steps after the time markers above have ended:
- Mark the nearest dealing range to find a PD Array.
- Wait for MSS on a timeframe ≤ m15 to enter a buy in the Discount zone.
- Stop-loss below the dealing range, Take profit at HOL or 3–4 times the Flout.
Example of a Delayed Protraction – Buy Profile on the US500 index:
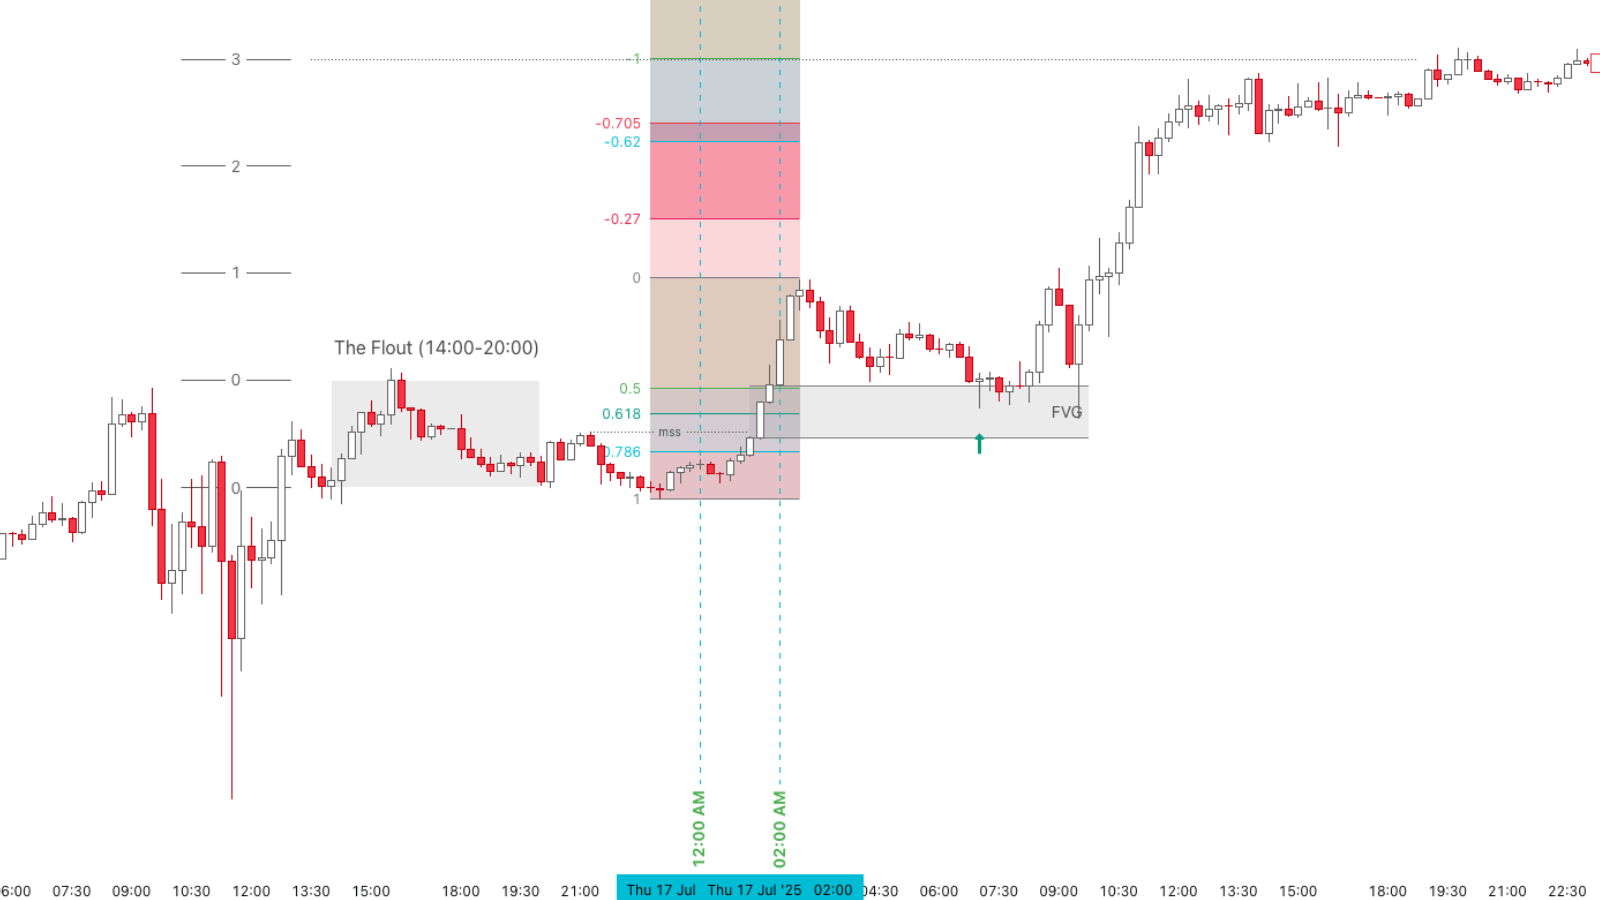 Example of a Delayed Protraction Buy Profile on the US 500 index
From 12:00 AM – 02:00 AM New York, price moves up creating MSS, then pulls back to the Discount zone.
A buy order at an FVG in confluence with OTE gives a profit of approximately 3R.
Note: With Delayed Protraction, the market may or may not have a favourable CBDR. The time markers and conditions do not necessarily have to be 100% exact.
Read structure 10x faster with JUKA
JUKA maps SMC structure — swings, BOS, CHoCH and inducement zones — automatically on any TradingView chart. No more hand-drawing structure for hours.
Get JUKA — $150