Market Structure in Trading
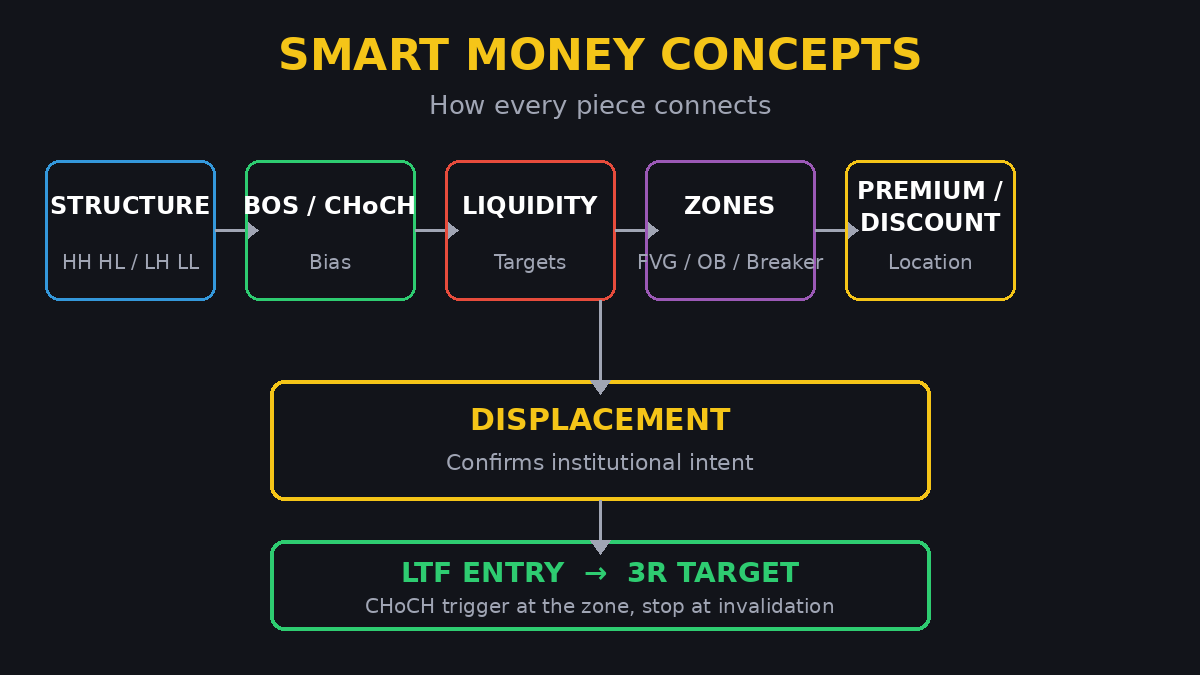
Market structure is the foundation of everything in SMC: if you cannot read the sequence of swing highs and lows, every other concept is guesswork. Work through these 9 lessons in order — from the basics to inducement — and you will read any chart the way institutional traders do.
What Is Market Structure in Trading? The Complete SMC Guide
Start here. Swing highs and lows, the three market states, BOS, CHoCH, internal versus external structure, and the top-down workflow — the full foundation in one guide.
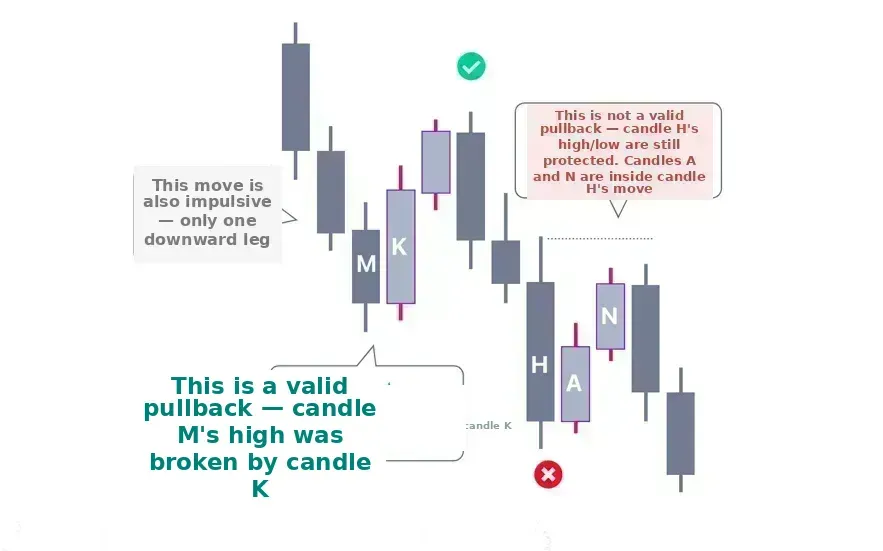
How to Identify a Valid Pullback in SMC
The first skill after the basics: tell a real pullback from a reversal before it happens, with a three-step check you can run on any chart.
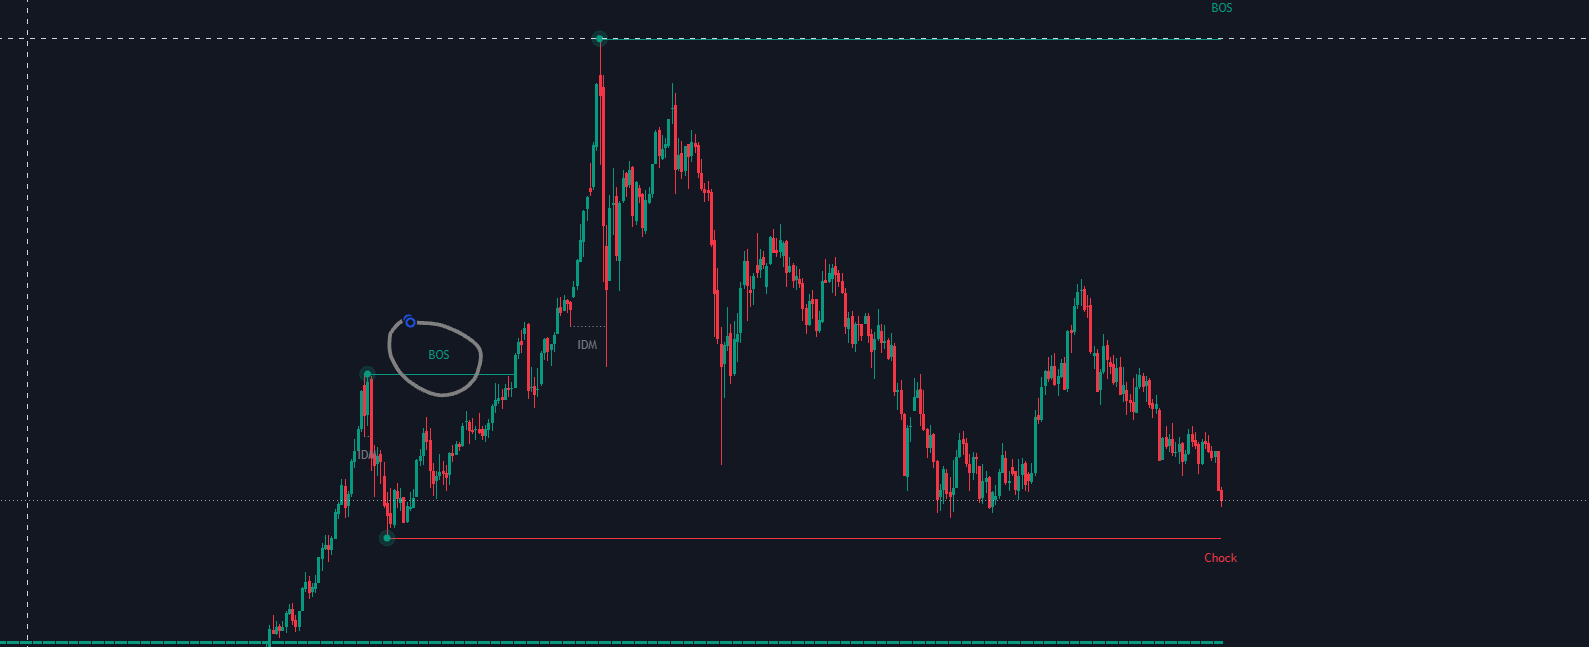
BOS vs CHoCH Rules: Stay on the Right Side of Trend
Break of structure rules that keep you trading with the trend: what counts as a break, why wicks do not count, and when a break fails.
CHoCH Explained So Simply a Beginner Gets It in One Minute
The first break against the trend, explained plainly: what a change of character is, what it is not, and why one CHoCH is a warning, not a reversal.
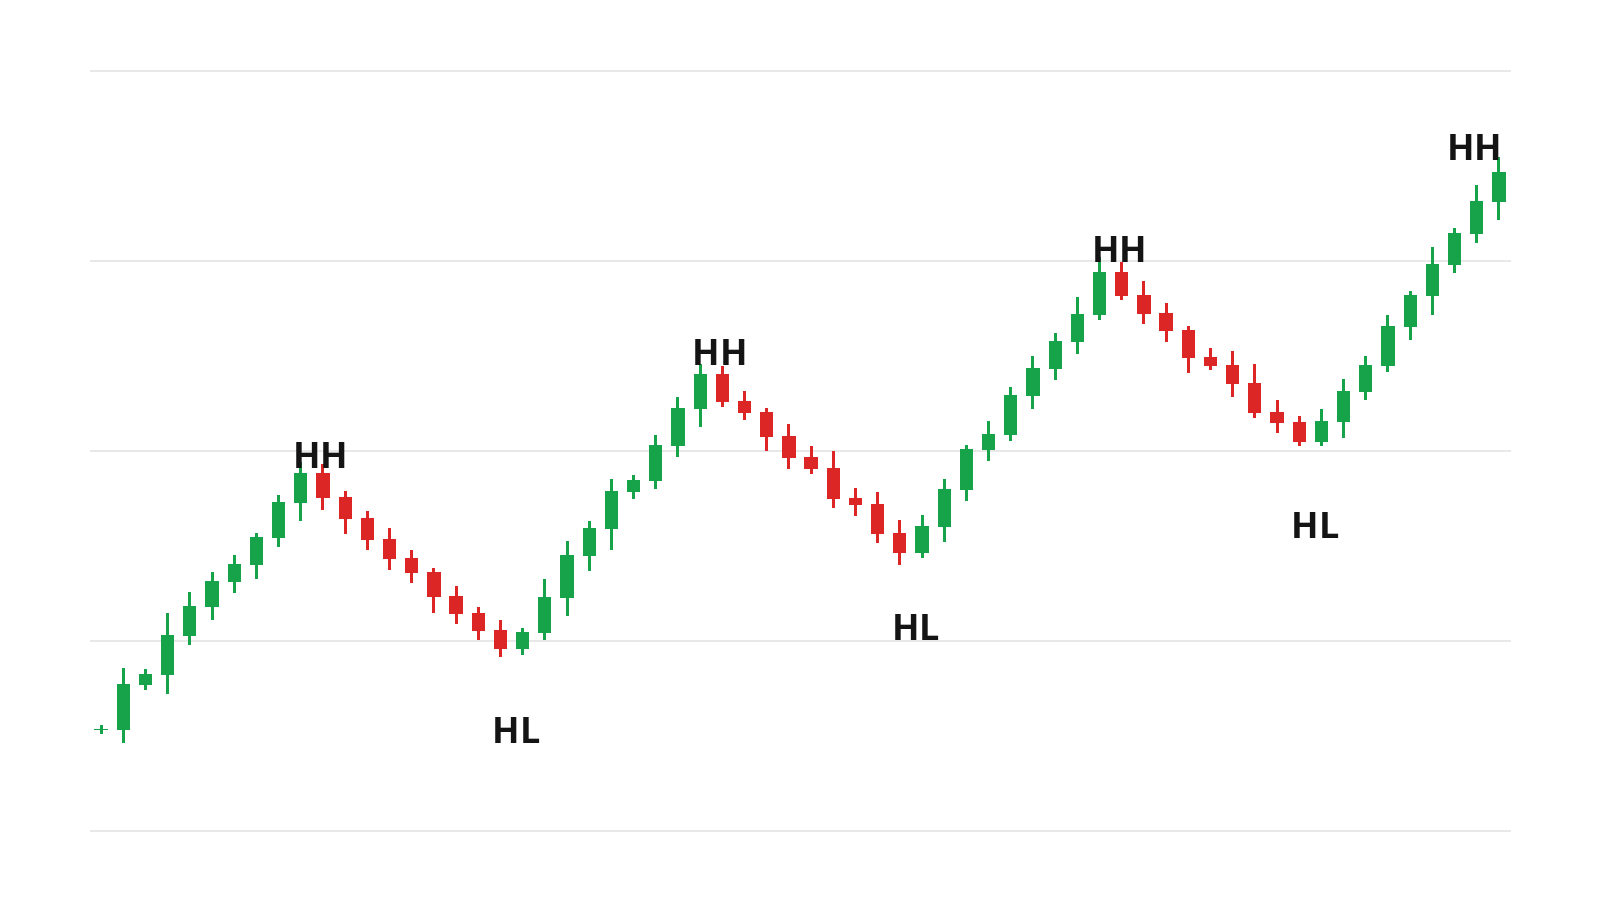
Higher Highs and Higher Lows in a Bullish Market
Inside the complete guide: how a bullish structure builds itself, one higher high and higher low at a time, and where buyers step in.
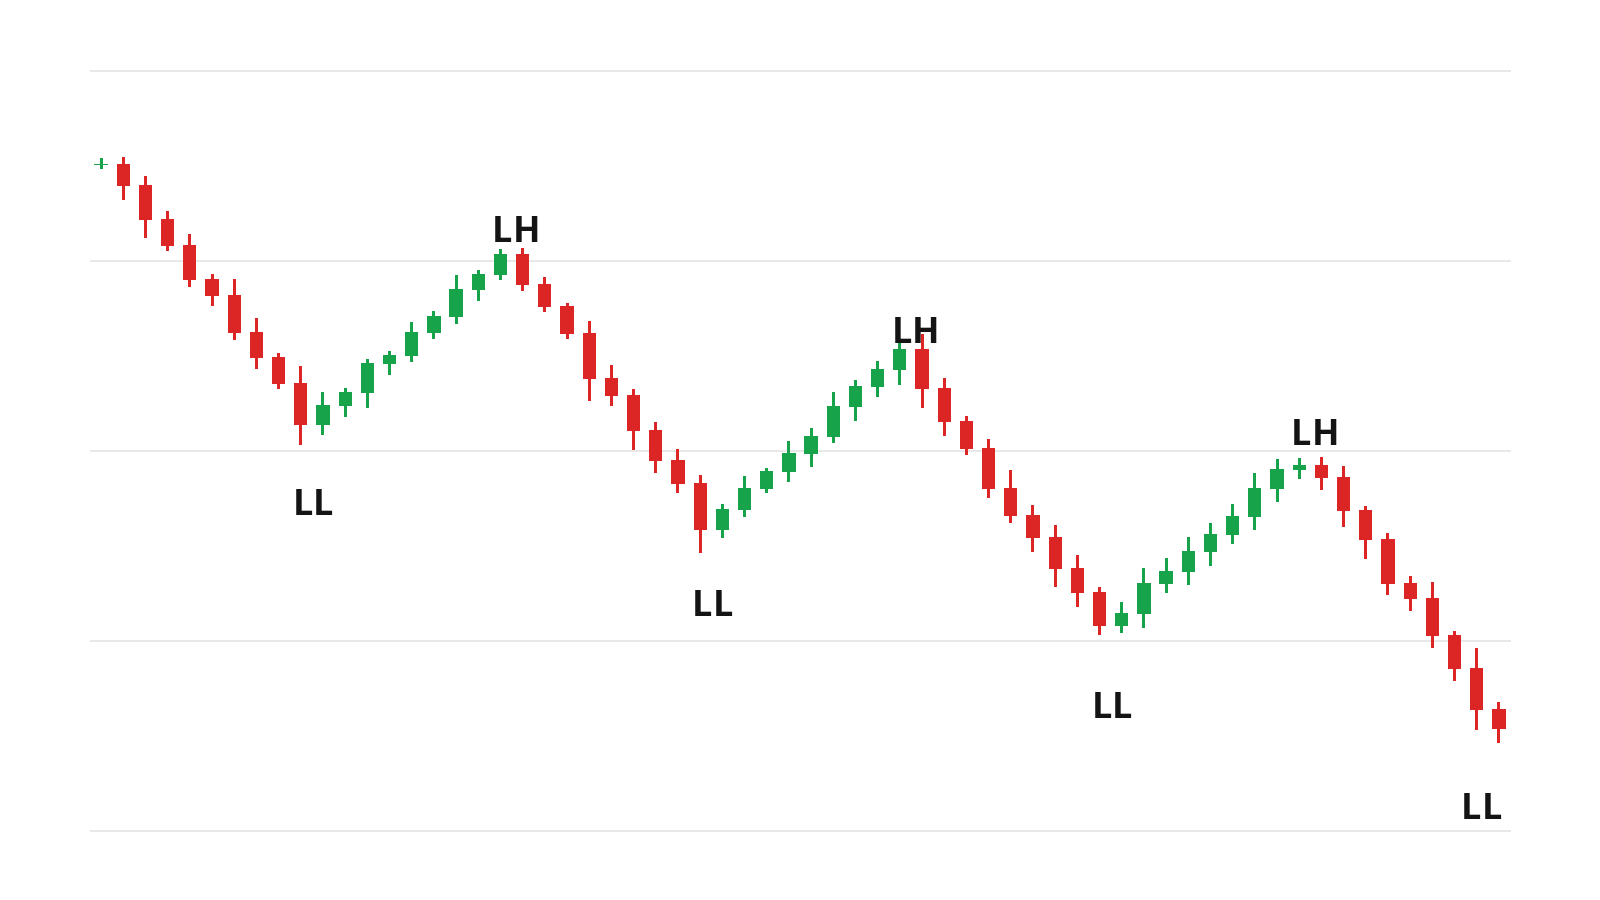
Lower Highs and Lower Lows in a Bearish Trend
The bearish mirror: how lower highs and lower lows stack up, and why selling rallies beats buying dips while the structure holds.
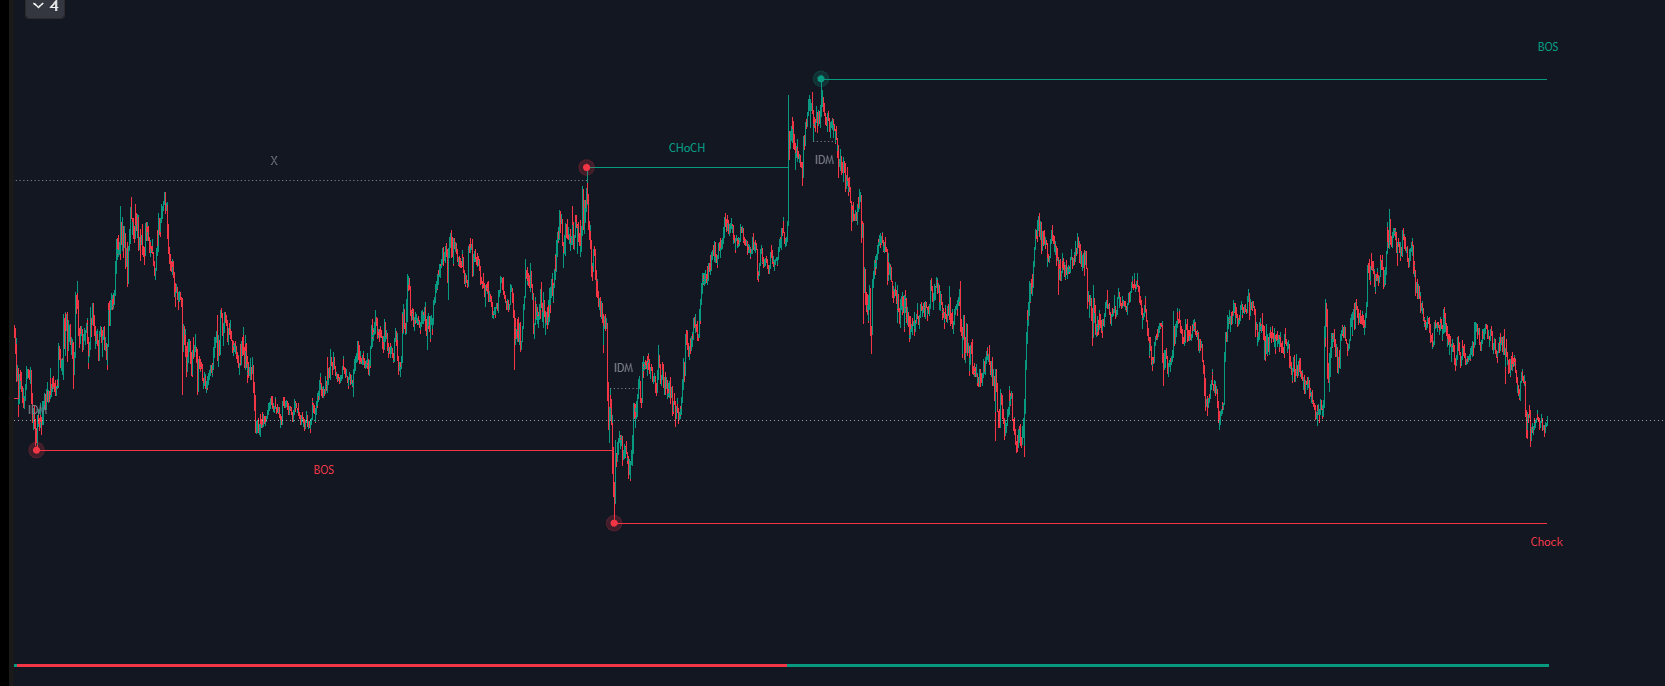
BOS vs CHoCH: Market Structure Basics
The comparison that prevents the most expensive beginner mistake: BOS continues the trend, CHoCH warns it may be ending — side by side.
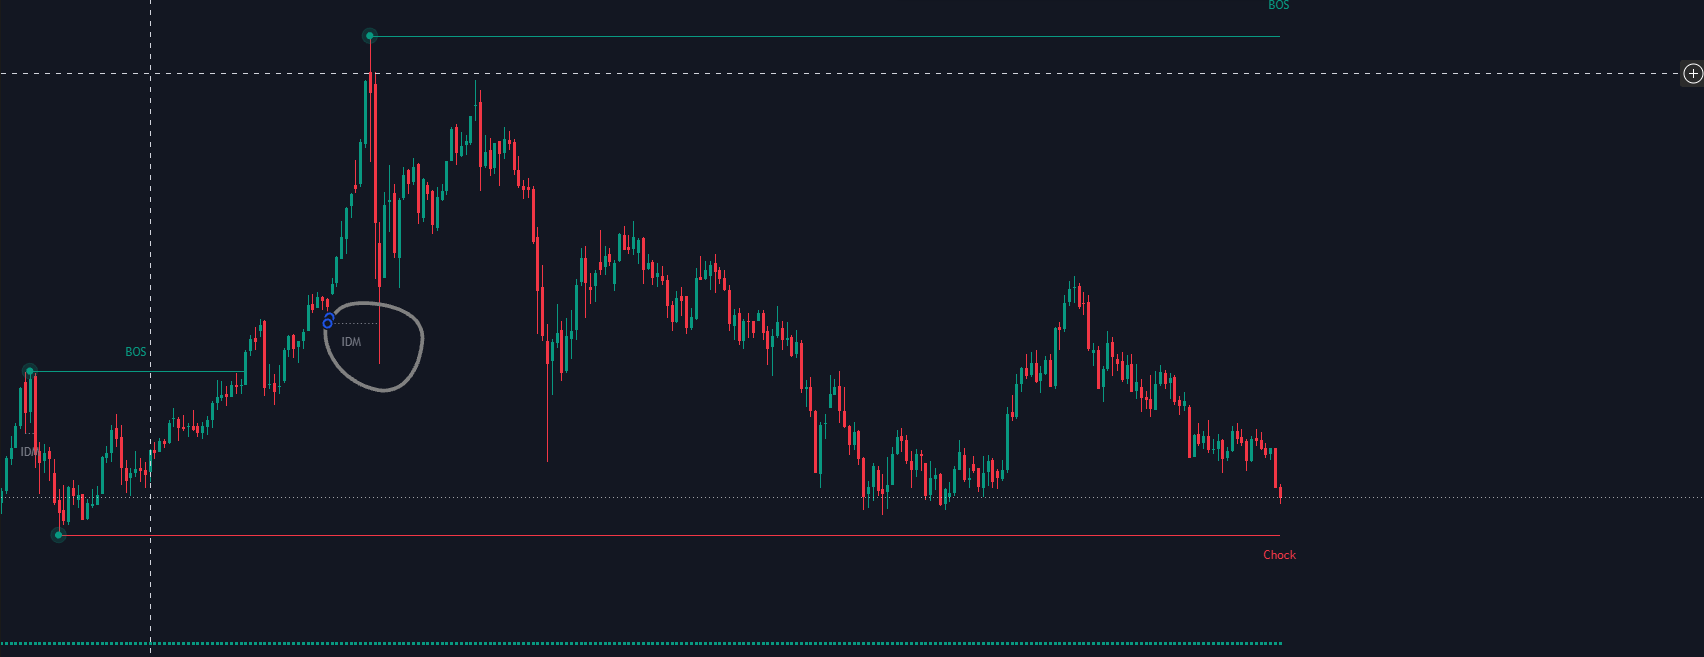
Liquidity Grabs EXPOSED: How Banks Hunt Your Stop Loss (And How to Flip It)
Inducement: how price sweeps a level to collect stops, and how to read that sweep as your entry trigger instead of your exit.
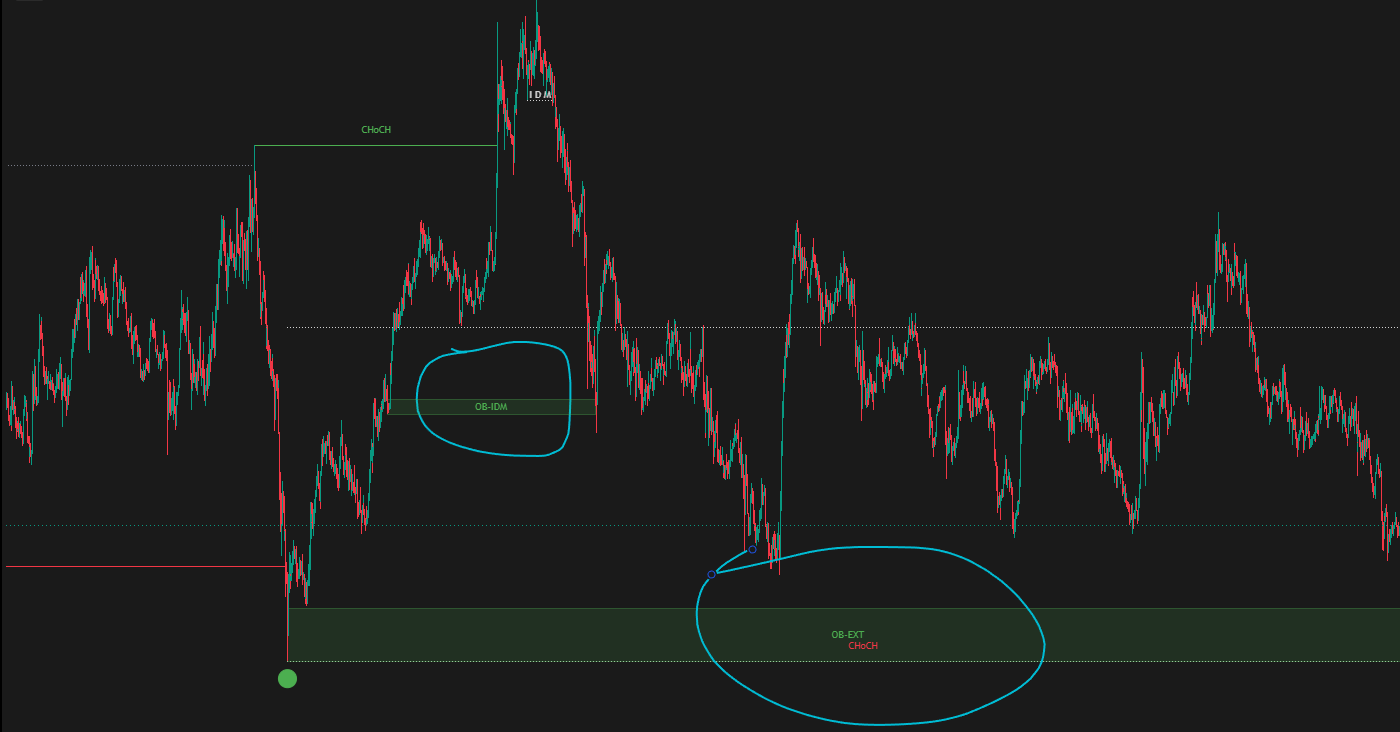
What Is an Order Block? SMC OB Trading Guide
The zones where institutional orders sit: what an order block is, how to spot a valid one, and how to enter when price returns to it.
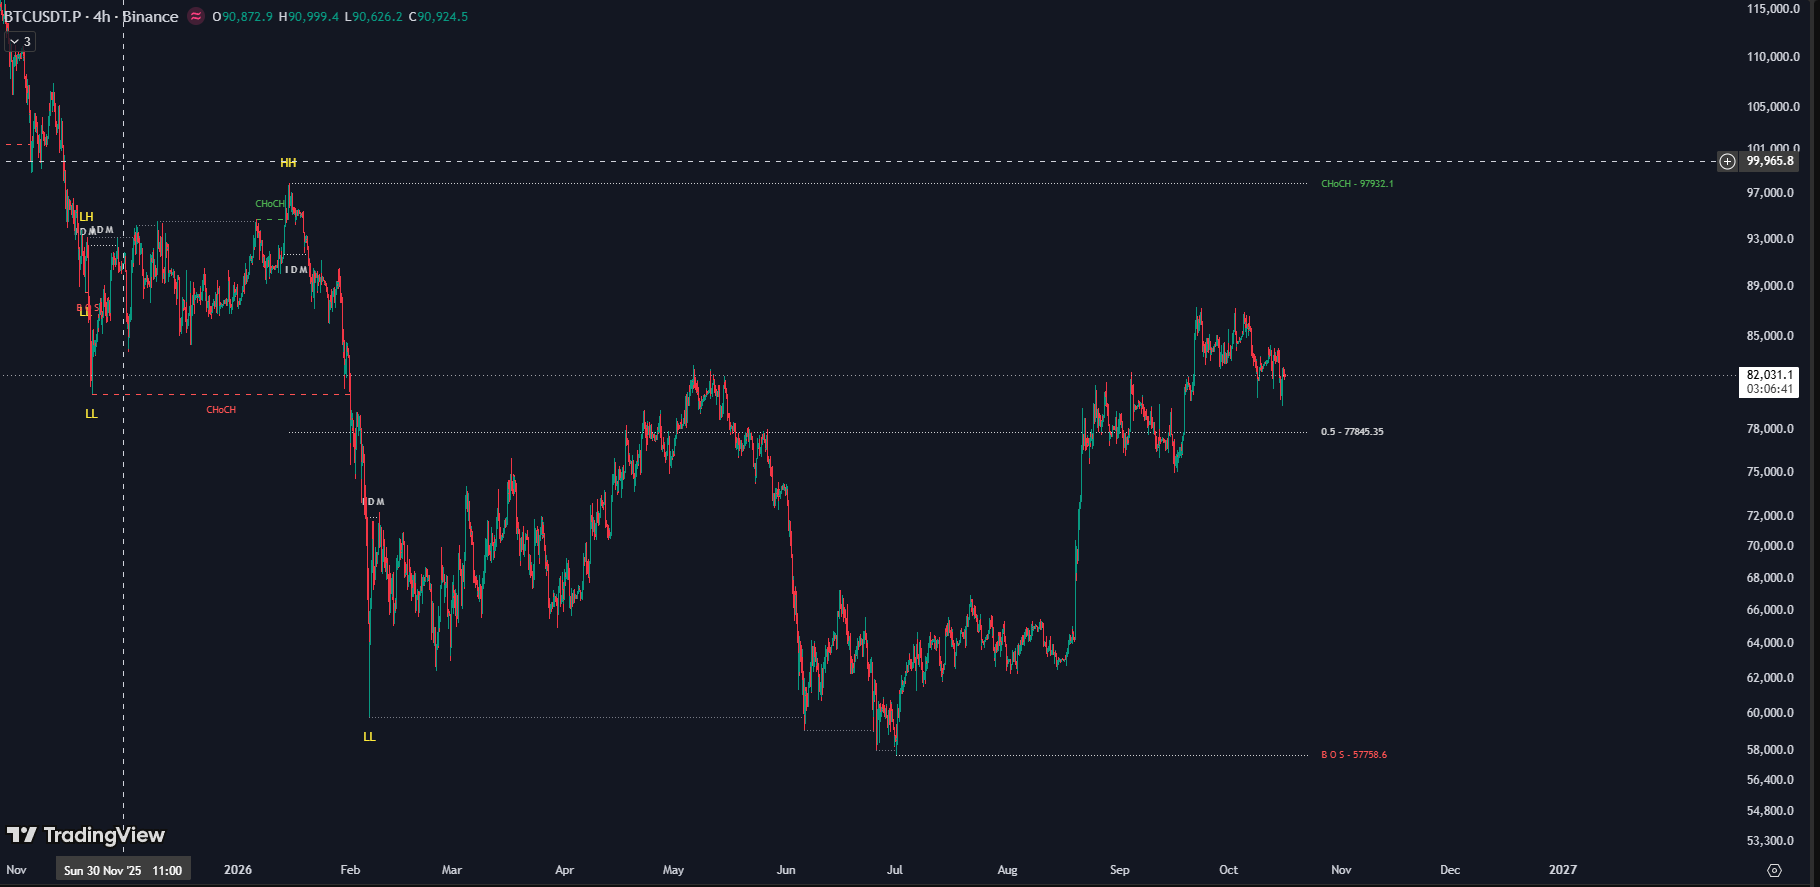
Stop Drawing Structure by Hand
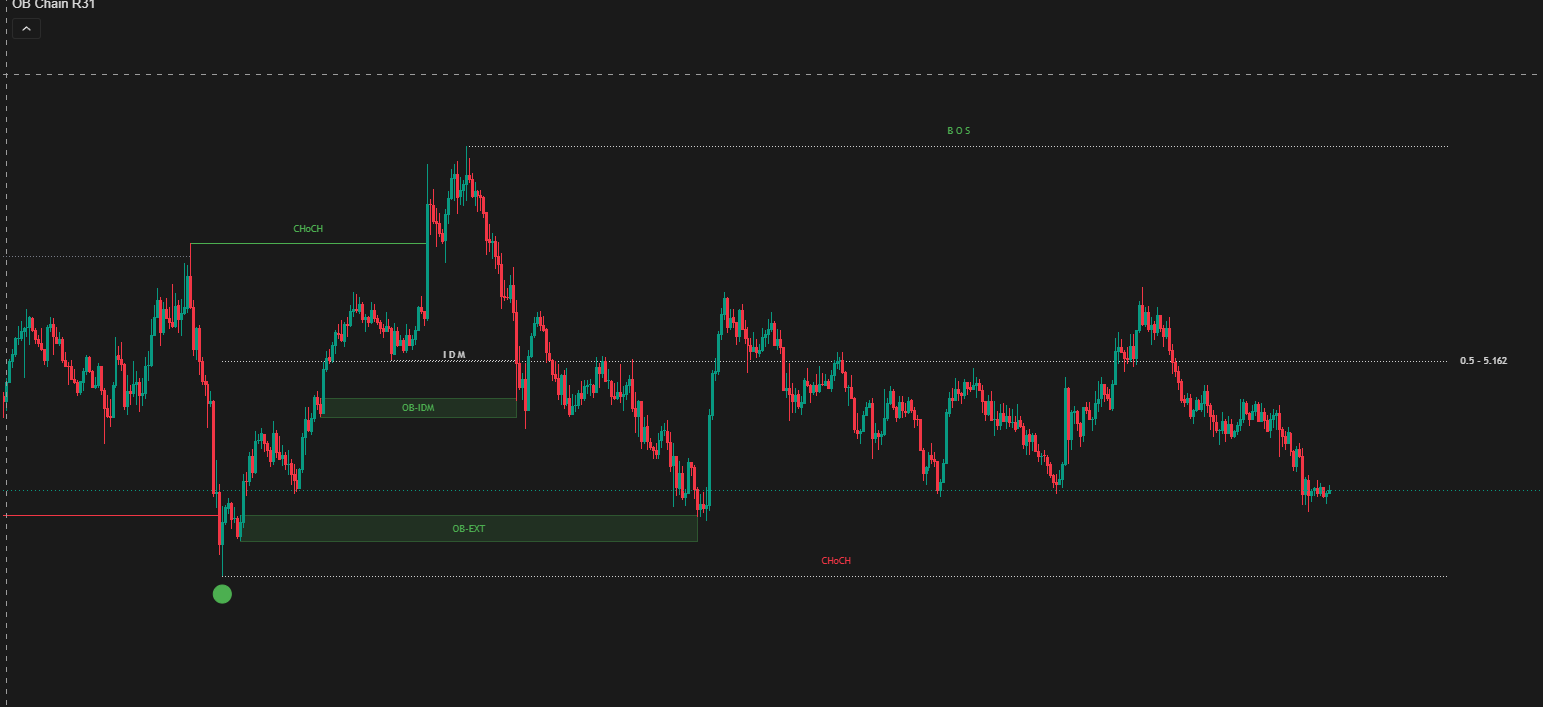
This is JUKA live on BTC 4H — every swing, BOS, CHoCH, IDM, and the premium/discount equilibrium labeled automatically, in real time.
No missed breaks. No mislabeled noise. No hours of hand-drawing. The complete Trading Hub 3.0 source code (Pine Script v5) — yours to own forever, $99 one-time. Or $50/year for invite-only access on TradingView.
Try free for 3 days — contact us on Telegram