What Is Market Structure in Trading? The Complete SMC Guide
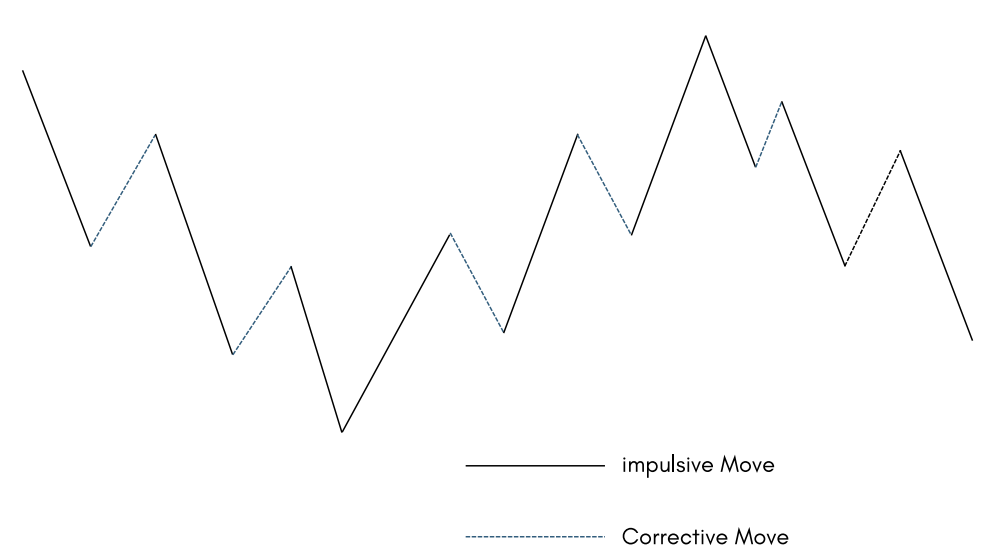
Every famous SMC channel on YouTube — from ICT-style structure mapping to the top-down breakdowns of Daily Price Action — starts in the same place: market structure. Not indicators, not order blocks, not entries. Structure first. Because if you cannot read the structure of a chart, every other SMC concept is guesswork. This guide explains market structure in trading the way the best teachers do: simply, visually, and with the mistakes that cost beginners the most money called out by name.
What is market structure in trading?
Market structure is the pattern price leaves behind as it moves: a sequence of swing highs and swing lows. That sequence tells you who is in control. Traders read it with four labels:
- Higher High (HH) — a swing high above the previous swing high.
- Higher Low (HL) — a swing low above the previous swing low.
- Lower High (LH) — a swing high below the previous swing high.
- Lower Low (LL) — a swing low below the previous swing low.
Three states follow from those four labels, and they cover every chart you will ever open:
- Uptrend: price keeps making higher highs and higher lows. Buyers are in control.
- Downtrend: price keeps making lower highs and lower lows. Sellers are in control.
- Range: no clear sequence — highs and lows chop sideways. Neither side is in control, and most trend strategies should sit out.
That is the whole foundation. Everything else in SMC — BOS, CHoCH, liquidity, order blocks — is a refinement of reading this sequence correctly.
The three types of market structure
Every chart falls into one of these three states. Recognizing which one you are in decides which tactics make sense — and which ones will bleed you.
Bullish structure
Price prints higher highs and higher lows. Each pullback stops above the previous low, and each rally breaks the previous high. In this state you look for buys: wait for price to pull back, confirm the higher low holds, and enter in the direction of the trend. Selling into bullish structure because price "looks too high" is one of the fastest ways to donate money to the market.
Bearish structure
The mirror image: lower highs and lower lows. Each rally stops below the previous high, and each sell-off breaks the previous low. Here you look for sells on rallies, and buying the dip is the trap. The trend stays bearish until price breaks a lower high with a candle close — that first break is a CHoCH, an early warning, not yet a reason to buy.
Sideways structure
Price chops horizontally between a roughly equal high and low, with no sequence of higher or lower swings. Neither side is in control. Trend tactics fail here: BOS signals fire and reverse within hours. In a range you have two honest choices — scalp the edges, buying the range low and selling the range high, with tight stops, or sit out and wait for a real break of structure to pick a direction. Most traders lose the most money not in trends, but in ranges they treated like trends.
Step 1: Mark swing highs and swing lows
A swing high is a peak with lower price on both sides; a swing low is a trough with higher price on both sides. Mark only the obvious ones. Beginners fail here by marking every tiny wiggle on a low timeframe, which turns the chart into noise. The rule the pros use: if you have to squint to see the swing, it is not a swing that matters. On the 1-hour chart, the swings that matter are visible at a glance — that is why most structure traders build their bias on the 1-hour and refine entries lower.
Step 2: Break of structure (BOS) — the trend continues
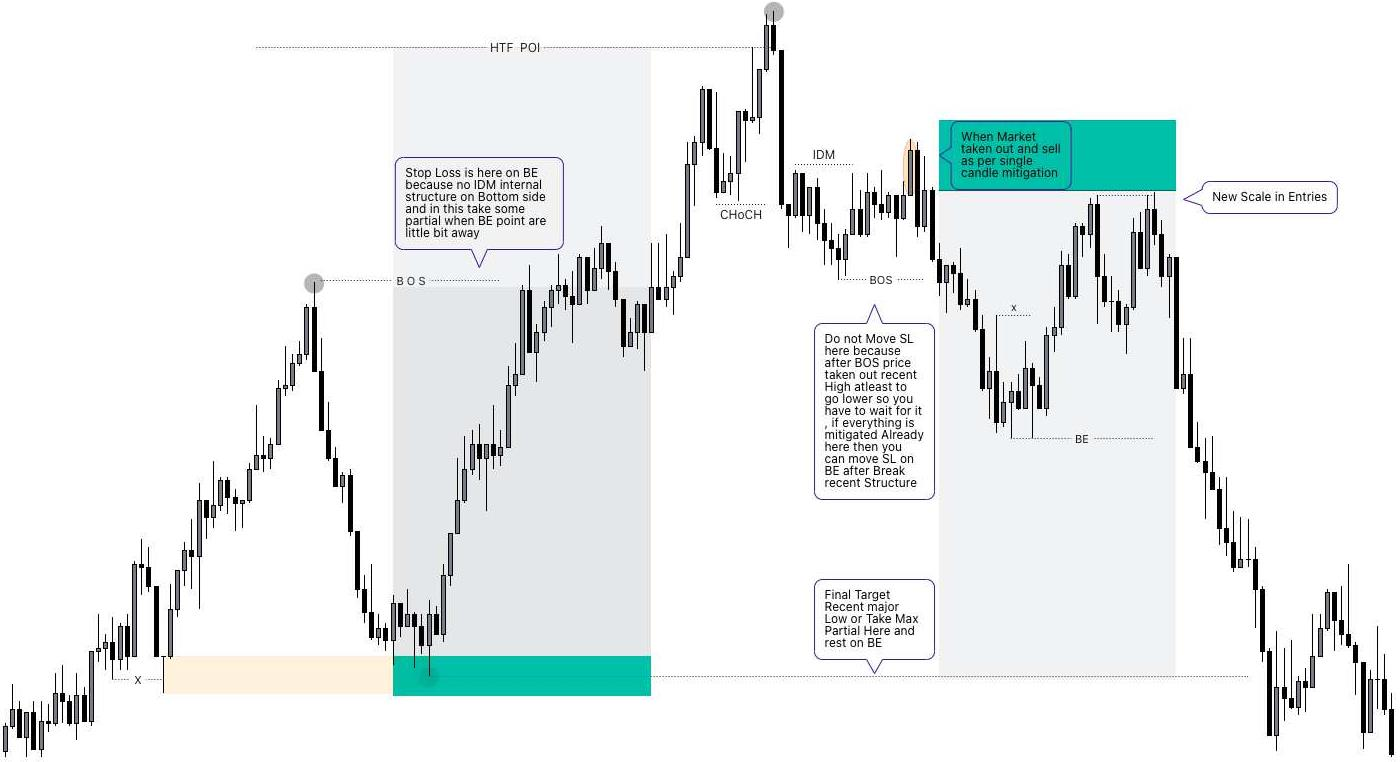
A break of structure (BOS) happens when price closes beyond the last swing high in an uptrend, or the last swing low in a downtrend. It confirms the current trend is still in control. A bullish BOS means buyers just pushed to a new high; a bearish BOS means sellers just pushed to a new low.
The confirmation rule matters more than the definition: a candle body close beyond the level counts; a wick does not. A wick that pierces a high and falls back is not a break — it is usually a liquidity sweep, the market collecting stops before reversing. This single distinction filters out a huge share of false signals.
Step 3: Change of character (CHoCH) — the trend may be turning
A change of character (CHoCH) is the first break against the trend: the first time an uptrend fails to make a higher high and instead takes out a recent low — or the reverse in a downtrend. It is an early warning, not a confirmed reversal. One CHoCH does not make a new trend; it tells you to stop trusting the old one and wait for the new structure to prove itself.
BOS vs CHoCH: the difference in one table
| BOS (Break of Structure) | CHoCH (Change of Character) | |
|---|---|---|
| Direction | With the trend | Against the trend |
| Meaning | Trend continuation | Possible reversal — early warning |
| When it appears | Repeatedly inside a trend | Only at the end of a trend, first break back |
| What to do | Keep trading with the trend | Stop trusting the old trend, wait for confirmation |
Confusing these two is the most expensive beginner mistake in SMC. A trader who treats a CHoCH as a BOS keeps buying into a dying uptrend; a trader who treats a BOS as a CHoCH keeps fighting a trend that is still strong.
Step 4: Internal vs external structure — the part most traders skip
This is the distinction that separates clean charts from messy ones, and it is the core of the top-down videos that get the most views. External structure is the big swing highs and lows that define the trend on your bias timeframe. Internal structure is the smaller swings inside the current leg — the pullbacks and minor breaks within one move.
The rule: BOS and CHoCH are read on external structure. Internal breaks are just noise inside a leg — they show pullbacks, not trend changes. When traders say "my CHoCH keeps failing," nine times out of ten they marked a CHoCH on an internal low. The market never changed character; it just pulled back.
Market structure hierarchy: STH, ITH, LTH
Not every swing high is equal. Structure reading ranks swings into three levels, and the level of the swing you break decides how much the break matters:
- STH (short-term high) — a swing high with lower highs on both sides. The smallest level; breaks here happen constantly and mean little on their own.
- ITH (intermediate-term high) — a high with short-term highs on both sides. This is the level that matters for most BOS and CHoCH calls.
- LTH (long-term high) — a high with intermediate-term highs on both sides. Breaks of LTH levels mark genuine trend shifts.
The same ladder applies to lows: STL, ITL, LTL. The practical rule: only trade breaks of ITH and ITL levels and above. A break of a short-term swing is noise; a break of an intermediate swing is signal. This single filter removes most of the false BOS signals beginners chase.
The #1 mistake: a sweep is not a CHoCH
Price often pierces a swing high or low with a wick, collects the stops sitting there, and snaps back. That is a liquidity sweep, not a break of structure and not a change of character. A real CHoCH needs a candle close beyond the level — and ideally, the level it breaks must be the swing that created the previous BOS. If price only wicked through an internal level, nothing changed. Wait for the close, then wait for the market to show you the next leg agrees.
Valid CHoCH checklist (use it every time)
- It breaks the right swing: the swing that produced the previous BOS — not a random internal low.
- It closes: a candle body closes beyond that level. Wicks do not count.
- The higher timeframe agrees: the break is not fighting a strong higher-timeframe trend. A 5-minute CHoCH against a daily downtrend is a pullback until proven otherwise.
Three checks, ten seconds. Most bad CHoCH trades fail at least two of them.
Step 5: The top-down workflow
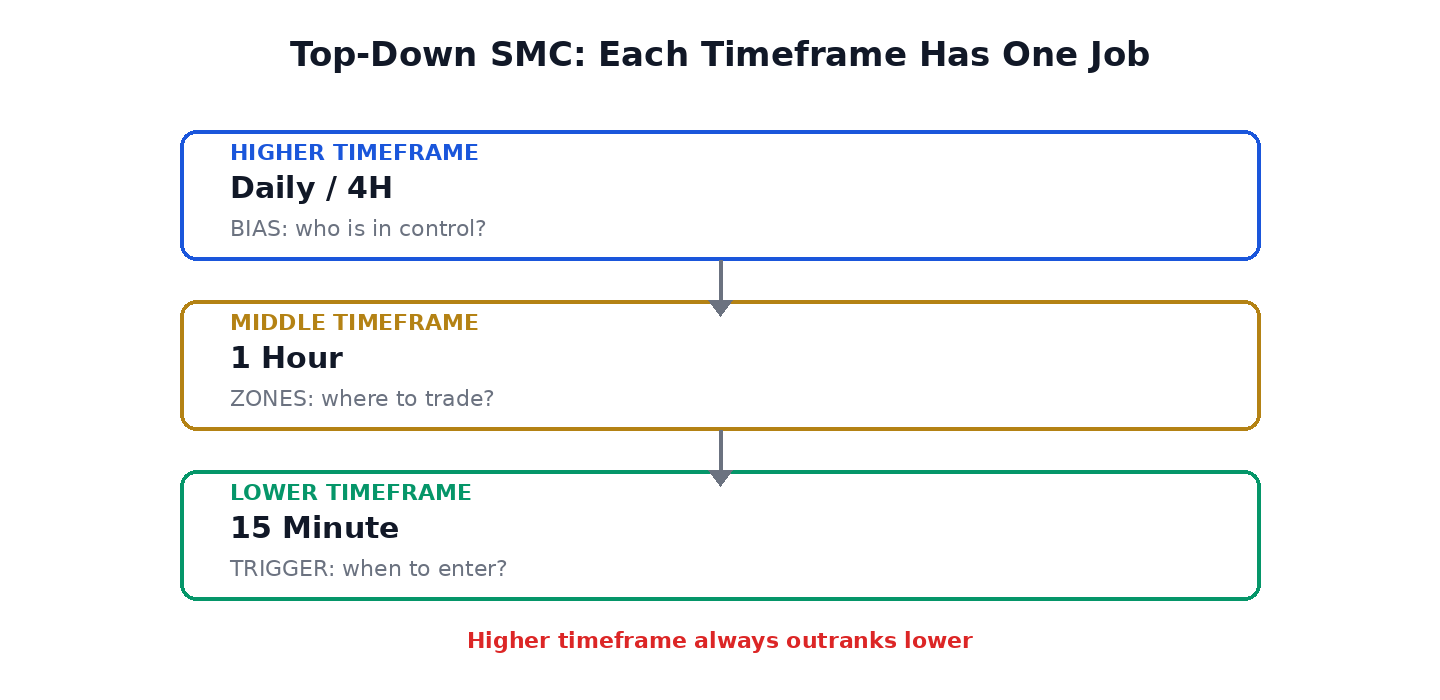
Structure is fractal: the same pattern repeats on every timeframe, and a market can be bullish on one timeframe and bearish on another at the same time. The top-down workflow resolves the contradiction:
- Higher timeframe (weekly/daily): read the big external structure. This is your bias — the direction you are allowed to trade.
- Mid timeframe (1-hour): mark external highs and lows, note the BOS, and wait for a CHoCH that agrees with the higher-timeframe bias.
- Lower timeframe (5–15 minute): refine the entry only. The lower timeframe never overrides your bias — it only tells you where to get in.
When all three timeframes start to agree, you have the highest-probability setup SMC can offer. When they disagree, the higher timeframe wins — always.
Step-by-step market structure trade flow
Here is the full sequence, from bias to exit, using everything above:
- Set the higher-timeframe bias. Read daily and 4-hour external structure: bullish, bearish, or ranging. This is the only direction you trade.
- Mark the key extremes. Note the most recent ITH and ITL on the higher timeframe. These are the levels that must break for anything to change.
- Wait for the BOS. Bullish: a candle closes above the previous swing high. Bearish: a candle closes below the previous swing low. Wicks do not count.
- Mark the inducement. Inside the BOS leg, find the pullback low (bullish) or pullback high (bearish) that price is likely to sweep.
- Wait for the sweep. Let price retrace and take the inducement. A BOS without a sweep is a weak entry; the sweep is what traps late traders and fuels the next leg.
- Drop to the lower timeframe. On the 5- or 15-minute chart, wait for a market structure shift in your bias direction at the swept level.
- Enter on the retest. Enter when price retests the shift level or the nearest order block, not while it is running away from you.
- Place the stop. Beyond the swept inducement extreme, with a small buffer. If price takes that level out with a close, your read was wrong — accept it.
- Take profit at the next draw on liquidity. The old high or low, a relative equal level, or the next higher-timeframe fair value gap.
Market structure in forex — and everywhere else
Structure works the same on forex pairs, gold (XAUUSD), indices and crypto, because it describes auction behavior, not an asset. What changes is volatility: gold and indices sweep levels more violently, so the candle-close rule matters even more there. The method does not change; the patience required does.
Pros and cons of trading market structure
Pros:
- It works on every market. Forex, gold, indices, crypto — structure describes auction behavior, not an asset, so the method transfers.
- It needs no indicators. Price itself tells you who is in control; there is nothing to lag, repaint, or optimize.
- It gives you a clear invalidation. A close beyond the level you were watching tells you immediately that the read is wrong.
Cons:
- Ranges punish it. In sideways markets, BOS signals fire and fail repeatedly. Structure trading needs a trend, or a scalp plan for ranges.
- It looks simpler than it is. Marking the right swings — external, not internal — takes months of chart time to do consistently.
- It never guarantees anything. Structure gives you probabilities, not certainties. A clean setup can still fail, which is why stops are non-negotiable.
Frequently asked questions
What is market structure in trading, in one sentence?
The sequence of swing highs and lows that tells you whether buyers, sellers, or neither are in control of a market.
What timeframe is best for reading market structure?
The 1-hour chart is the standard for building bias: clean external swings without the noise of lower timeframes. Refine entries on the 5- or 15-minute chart.
What is the difference between BOS and CHoCH?
BOS breaks with the trend and signals continuation; CHoCH is the first break against the trend and warns a reversal may be starting.
Why do my CHoCH trades keep failing?
Usually one of three reasons: you marked it on an internal swing instead of the external swing that caused the last BOS, you trusted a wick instead of a candle close, or you traded against the higher-timeframe trend.
What are the three types of market structure?
Bullish (higher highs and higher lows), bearish (lower highs and lower lows), and sideways (price chopping horizontally between a range high and low with no clear sequence).
What do STH, ITH, and LTH mean?
They rank swing highs by importance: STH is a short-term high, ITH an intermediate-term high between two short-term highs, and LTH a long-term high between two intermediate-term highs. The same ladder applies to lows (STL, ITL, LTL). Only breaks of ITH level and above are worth trading.
How is market structure different from BOS or CHoCH?
Market structure is the overall read of the price sequence. BOS and CHoCH are events inside that structure: BOS confirms the trend continuing, CHoCH warns it may be reversing.
How do I trade a sideways market?
Either scalp inside the range — buy the range low, sell the range high — with tight stops, or wait for a genuine break of structure before taking a directional trade. Trading a range with trend tactics produces fakeouts.
Where do I place the stop loss?
Beyond the swept inducement extreme: below the inducement low for buys, above the inducement high for sells, with a small buffer. A candle close beyond that level invalidates the trade.
Where do I take profit?
At the next draw on liquidity: the old high or low, a relative equal level, or the next higher-timeframe fair value gap.
How long does it take to master market structure?
The basics take weeks; doing it consistently takes months of chart time, mostly spent learning to mark external swings instead of internal noise. Full mastery, including multi-timeframe alignment, takes years — and that is normal.
Can I trade with market structure alone?
Yes, but pairing it with order blocks or fair value gaps for entries and with a session timing filter produces a higher hit rate than structure alone.
Stop Drawing Structure by Hand
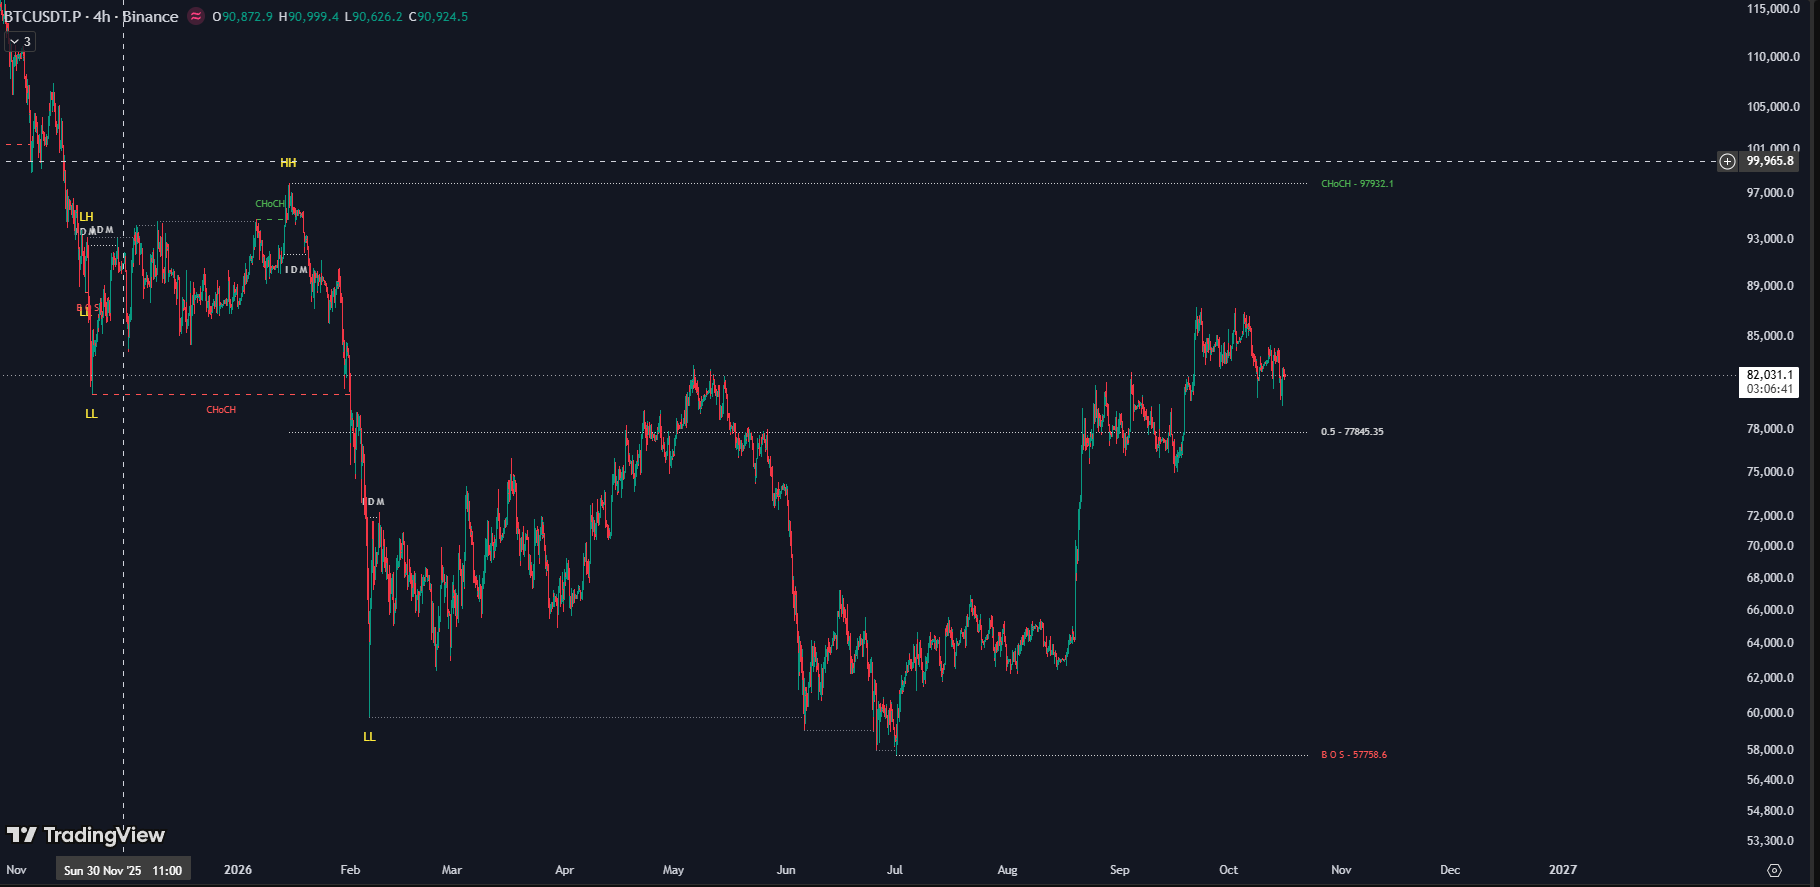
This is JUKA live on BTC 4H — every swing, BOS, CHoCH, IDM, and the premium/discount equilibrium labeled automatically, in real time.
No missed breaks. No mislabeled noise. No hours of hand-drawing. The complete Trading Hub 3.0 source code (Pine Script v5) — yours to own forever, $99 one-time. Or $50/year for invite-only access on TradingView.
Try free for 3 days — contact us on Telegram