Trading Hub 3.0 (Part 1): Identifying a Valid Pullback – SMC
Welcome, readers, to the SMC method based on the Trading Hub 3.0 material in Vietnamese.
In this series you will learn about the newest and most detailed Smart Money Concepts. Trading Hub 3.0 has compiled and added examples closely following the material to make it easy to understand.
Mastering SMC is a wonderful thing for traders, and the Trading Hub 3.0 material is a gift. Read it again many times and watch our explanatory videos. Join our Telegram group to discuss SMC together and look for once-in-a-lifetime trades.
Read and understand each part of this material thoroughly, do not try to get through it all in a single day.
Patience is a virtue of a trader!
Trading Hub 3.0
To understand the terminology in SMC, please read here.
What is a pullback?
Learn about pullbacks through video
In Part 1, we will learn how Pullback works; what Impulse and Correction are in terms of candlesticks and how to identify them. This is an important and very effective part; you need to understand how to read the structure map to find entry points at POI areas. To do this, you need to identify inducement, and first of all you need to find the Pullback.
When market momentum is moving strongly up or down, price usually moves in two ways: Impulse and Corrective moves.
You can understand it this way: in a strong move there is a lot of buying momentum from Institutions and Banks, while during the correction phase retail traders try to buy and sell and the market moves within a certain range.
If the market is bullish and price breaks through the low of the previous candle, that is a valid pullback. If the market is bearish and price breaks through the high of the previous candle, that is a valid pullback.
If price does not break through the high or low of the previous candle but only moves within the range between the high and low of the previous candle, that is not a valid pullback.
Now, I will explain in detail how it looks.
 Impulsive move and corrective move in SMC
What is an impulsive move?
When market momentum is Bearish, if price moves to create a lower low (the next candle is lower than the previous candle, or price breaks the low of the previous candle), this is called an Impulsive move in terms of candles. The opposite happens when market momentum is Bullish.
What is a corrective move?
When market momentum is Bearish, if price breaks liquidity, meaning the high of the previous candle is swept (wick sweep) or a candle closes above the high of the previous candle, this is called a valid Pullback, and this movement is called a Corrective move in terms of candles. The opposite applies when the market is Bullish.
Note: we will learn about Impulsive and Corrective moves in terms of structure in Part 2.
 Identifying a Pullback in SMC (figure 1)
  Identifying a Pullback in SMC (figure 2)
  Identifying a Pullback in SMC (figure 3)
  Identifying a Pullback in SMC (figure 4)
When price goes beyond the high/low of the previous candle, the candle color no longer matters; it can be a bullish or bearish candle, both are valid.
Bonus: look at the special case in the image below
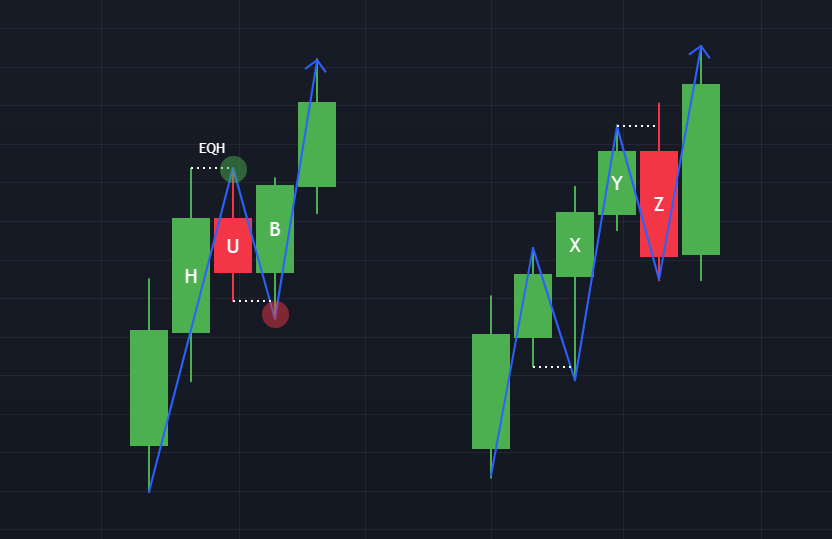 Identifying a pullback in the special case
In the image above, candles U and H have equal highs, candle B breaks the low of candle U, so we will count a valid Pullback from the high of candle U to the low of candle B.
Candle Z breaks both the high and low of candle Y, so we can count a valid Pullback from the high of candle Y to the low of candle Z.
Illustrative example
 Example of identifying a valid pullback
There will be different scenarios when we determine whether a pullback is valid or not; please watch Trading Hub 3.0's video on this part.
Identifying a pullback is a very interesting and important part of Smart Money Concepts. The pullback is the backbone of the structure map; if we cannot identify a pullback we will not be able to identify structure and inducement, and will not be able to trade on the LTF.
4.2/5 - (13 votes)
Read structure 10x faster with JUKA
JUKA maps SMC structure — swings, BOS, CHoCH and inducement zones — automatically on any TradingView chart. No more hand-drawing structure for hours.
Get JUKA — $150