Wyckoff Part 2: The Three Golden Laws of Wyckoff
Together with auction theory, the three laws of Wyckoff — the Law of Supply and Demand, the Law of Cause and Effect, and the Law of Effort versus Result — have been proven over a long period of more than a hundred years.
The Law of Supply and Demand
The Law of Supply and Demand states that price will rise when demand is greater than supply, and price will fall when supply is greater than demand.
This is a basic economic law and also the main content of the method that Wyckoff uses.
- Supply > demand = price falls (imbalance)
- Supply < demand = price rises (imbalance)
- Supply = demand = price unchanged (balance)
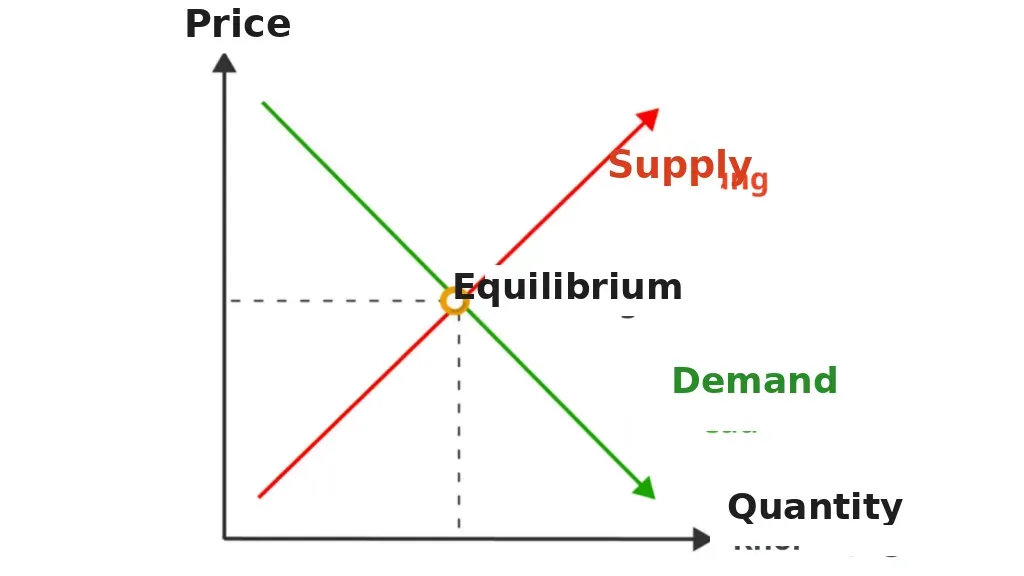 Figure 1: The Law of Supply and Demand in a state of balance
Figure 1 shows that when supply and demand are in balance, meaning there is no shortage or surplus of supply, the amount of supply is just enough to satisfy demand. Therefore, buyers and sellers comfortably trade to their satisfaction without putting pressure on price or volume.
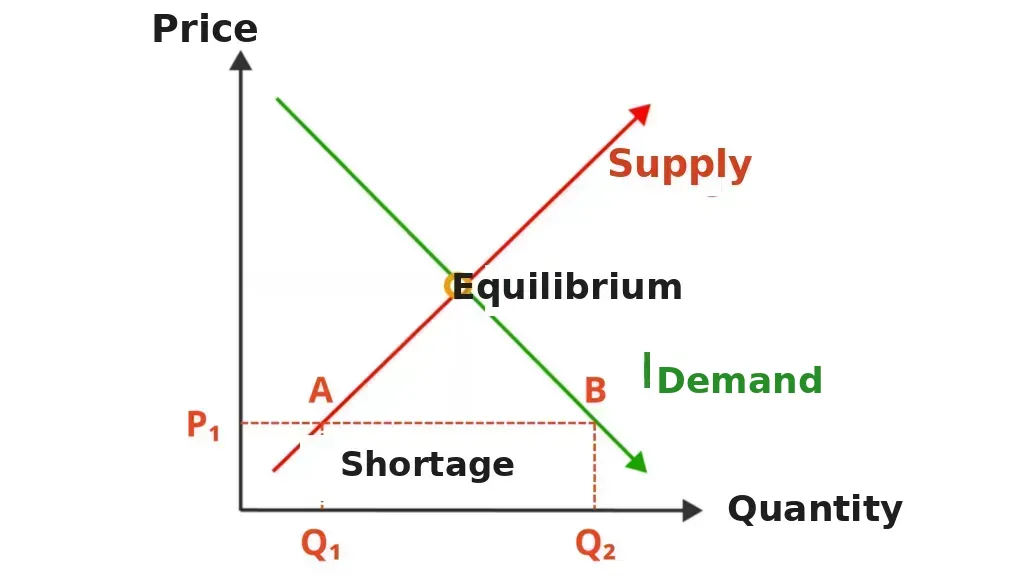 Figure 2: Supply–demand imbalance when there is a shortage of supply
In Figure 2, when a supply–demand imbalance occurs, at price P₁ lower than the equilibrium price, sellers want to supply quantity Q₁ and buyers want to buy quantity Q₂ > Q₁.
The result is that supply is short by an amount equal to Q₂ - Q₁; at this point price will be under upward pressure because sellers are forced to raise price, or increase supply, to return to the equilibrium point.
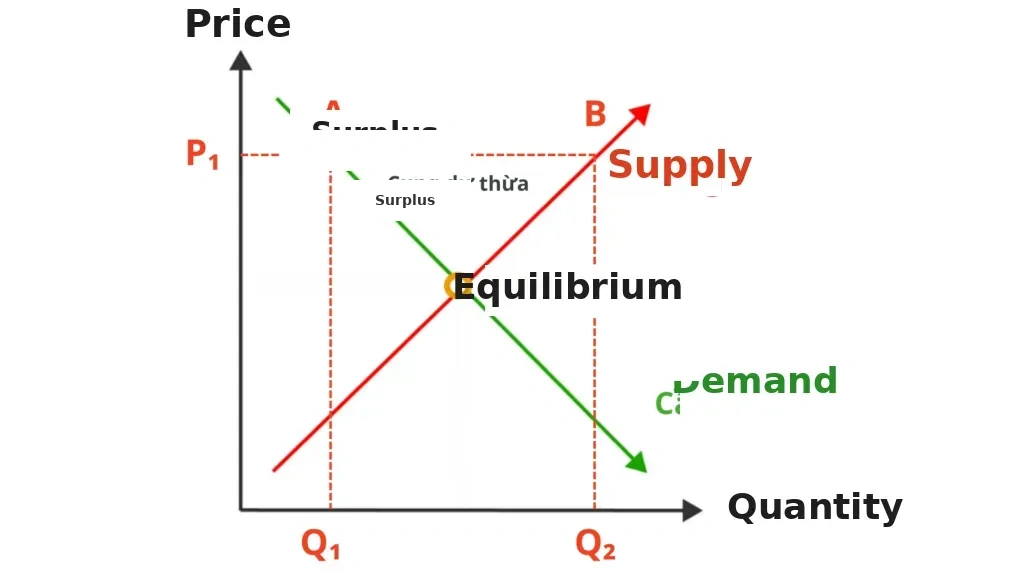 Figure 3: Supply–demand imbalance when supply is in surplus
Figure 3 shows that at price P₁, sellers want to supply quantity Q₁ and buyers want to buy quantity Q₂.
The result is that supply is in surplus by an amount equal to Q₂ - Q₁; price will be under downward pressure because sellers must reduce supply or reduce price for the market to return to balance.
We can assess the supply–demand imbalance by observing the closing price, the price range (spread) and trading volume.
Example: a rising candle with a wide range and large volume means demand > supply. A falling candle with a wide range and large volume means supply > demand.
In Part 1 we learned about trendlines and trend channels; if considered in terms of the law of supply and demand, the trendline will tell us who is in control of the market.
- In a rising price channel, the demand line acts as a support line; at this point we can conclude that buyers are in control, demand > supply.
- Similarly, in a falling price channel, the supply line acts as a resistance line; at this point sellers are in control, supply > demand.
Note:
The word "supply" here is not "the amount of supply" or "the number of sellers", and the word "demand" is also not "the amount of demand" or "the number of buyers".
That means when there are more buyers than sellers, or when demand is greater than supply, it does not mean price will rise.
We will go into explaining why price rises / falls at the end of this article.
The Law of Cause and Effect
The Law of Cause and Effect states that the market does not happen naturally that way, but everything has a cause originating from the actions of the CO within the trading range.
This law points out two things:
- First, price rising or falling is because a sideways area had previously formed. That means after a period of balance between supply and demand, the market will become imbalanced, causing price to escape from that equilibrium area and enter an uptrend or downtrend.
-
Second, the cause that is built will be directly proportional to the effect. The more cause is built, the greater the impact on price; the less cause is built, the smaller the impact on price.
Every trend eventually ends and a cause begins. When the cause ends, a new trend is born.
The Wyckoff method revolves around explaining these things.
See the example in Figure 4: Bitcoin price breaks out of the equilibrium area and falls into an imbalanced state before entering the next equilibrium area.
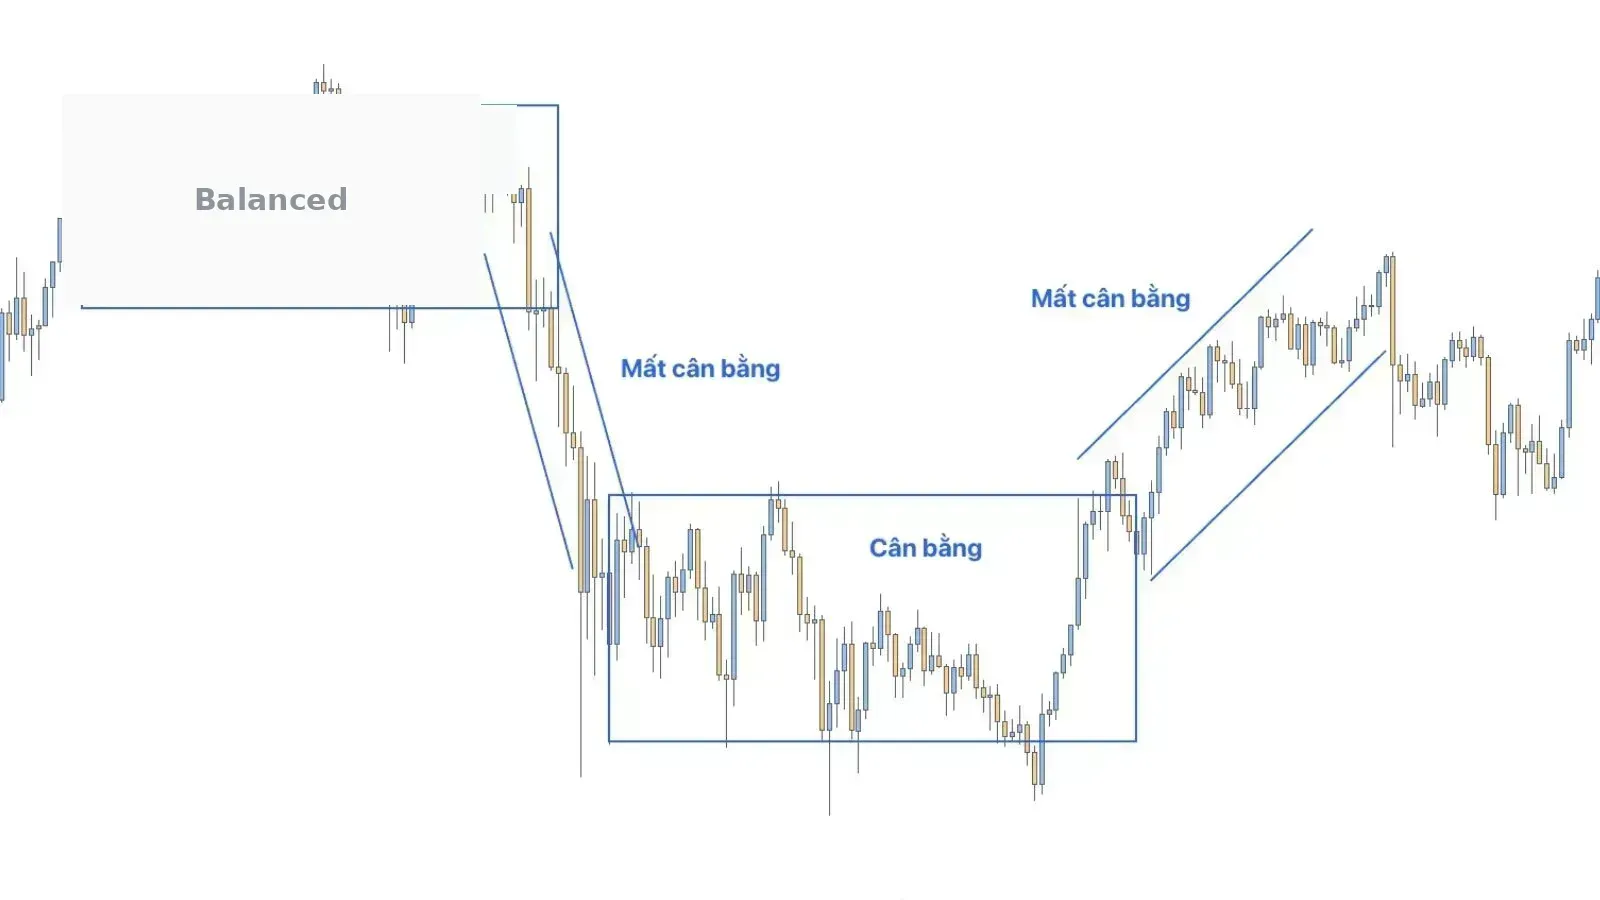 Figure 4: The Law of Cause and Effect on the BTC/USDT pair
Based on this law, we can predict the expected price by determining the potential level of a trend born from the previous sideways range.
The longer the sideways range lasts, the longer the trend will be when price escapes from that range.
Wyckoff used the law of cause and effect and the Point and Figure (PnF) chart to answer the question "how far can price go?".
Besides PnF, we can also use Fibonacci or Harmonic to determine the target that price will reach after it has finished building a cause in the sideways area.
Thus, the job of a trader is to determine whether the range in which price is moving sideways is accumulation or distribution, then find an entry point and take profit where price will travel to thanks to price target calculation tools that we will discuss in later parts!
The Law of Effort versus Result
The Law of Effort versus Result indicates that price action must be reflected by trading volume. Volume represents effort, and price fluctuation represents the result of that effort.
This law shows the importance of price and volume.
When large traders are interested in a stock, their level of attention will be reflected through trading volume.
The participation of large traders is identified through an increase in volume.
Harmony and divergence
- Harmony: if effort and result correspond to each other, it shows a strong sign of the movement and a high probability that price will continue in the previous direction.
- Divergence: if effort and result do not correspond, it shows a weak sign of the movement and a high probability that price will reverse.
Harmony and divergence analysis table (refer to Ruben's VSA material): please view in desktop mode.
| Development of each candle | Next movement | Development within price movement | Development between waves | When reaching important levels
---|---|---|---|---|---
Harmony | High volume, wide range | High volume on a rising candle, pushing price higher | High volume in an impulse wave | Impulse waves get stronger | High volume at the breakout point
Low volume, narrow range | High volume on a falling candle, making price fall lower | Low volume in a pullback wave | Pullback waves get weaker | Low volume, price does not break out
Divergence | High volume, narrow range | High volume on a rising candle but price does not rise further | Low volume in an impulse wave | Impulse waves get weaker | High volume but no breakout
Low volume, wide range | High volume on a falling candle but price does not fall further | High volume in a pullback wave | Pullback waves get stronger | Low volume at the breakout point
We will analyze each case!
Development of each candle
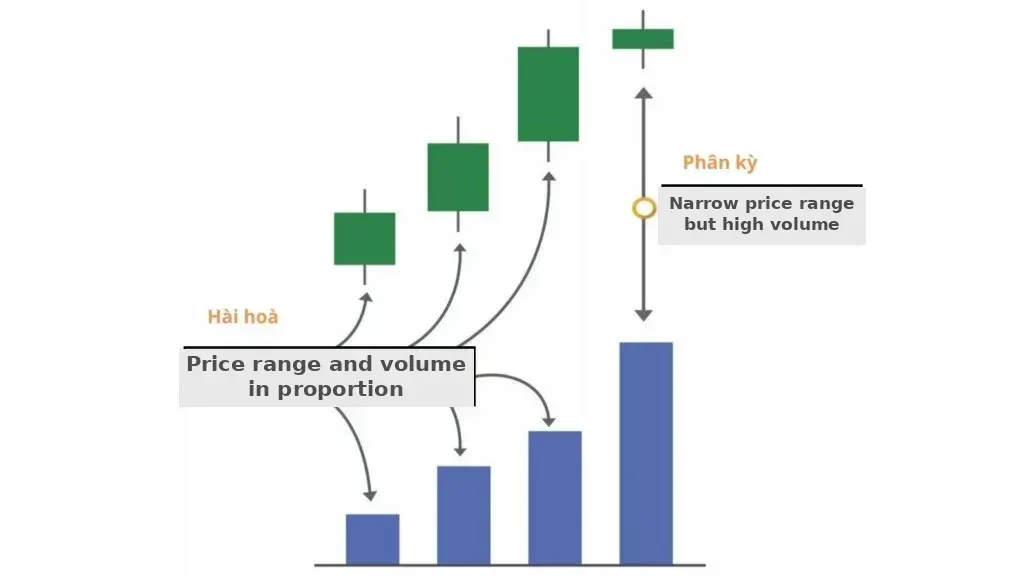 Figure 5: The Law of Effort versus Result on each candle
Candles have effort and result in harmony when the candle has a wide price range and high trading volume, or a narrow range with low trading volume.
Conversely, divergence occurs when a wide price range has small volume or a narrow price range has high volume.
Subsequent candles
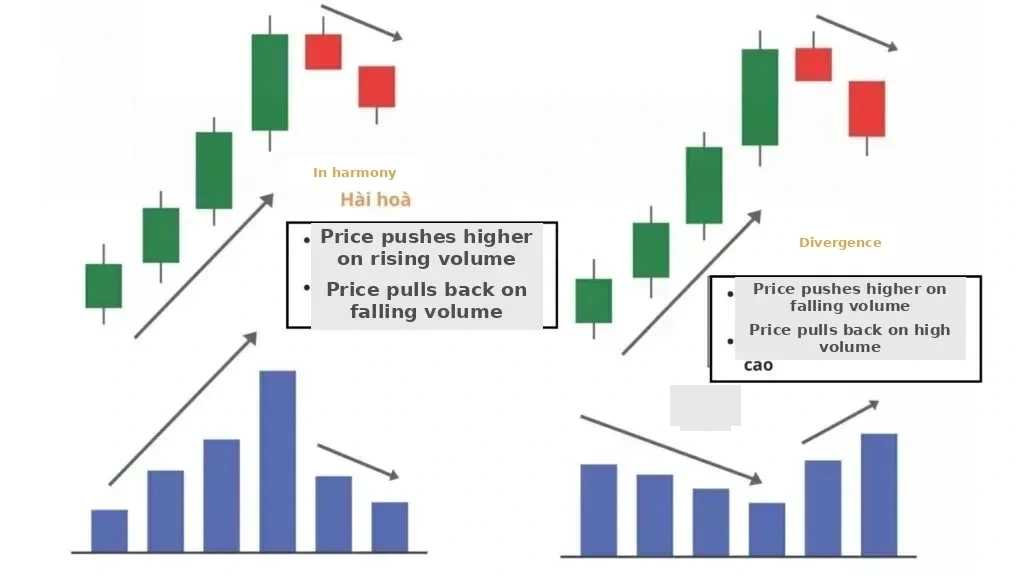 Figure 6: The Law of Effort versus Result in price movement
In this section, our scope of analysis is wider, over the next few candles.
If high trading volume on a rising candle leads to the result that subsequent candles also rise, we call that harmony.
But if high trading volume on a rising candle leads to the result that subsequent candles fall, that is divergence.
Development within a wave of movement
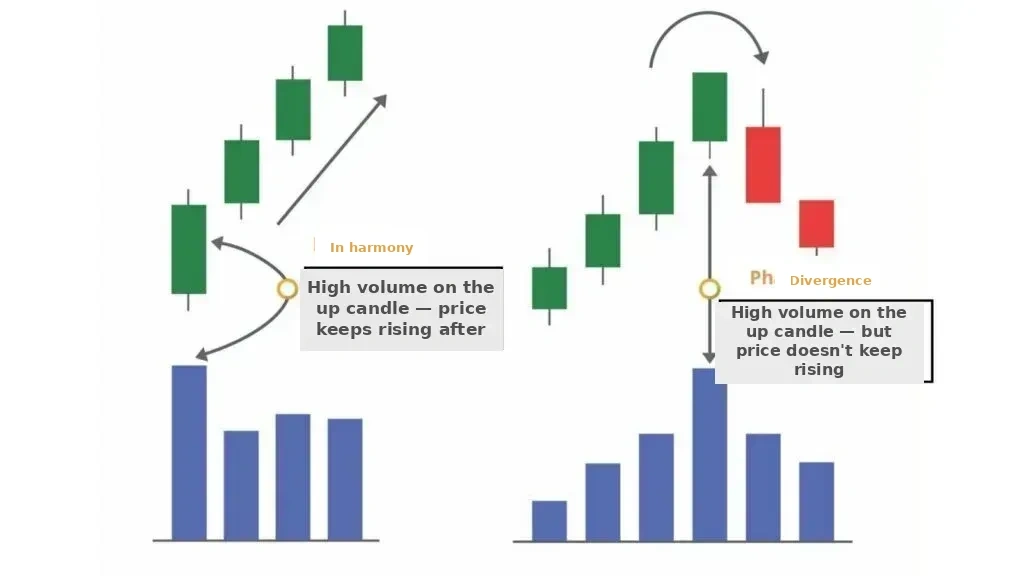 Figure 7: The Law of Effort versus Result in the next movement
When an impulse wave (in the same direction as the main trend) has increasing trading volume, and a pullback wave has decreasing trading volume, we determine there is harmony.
Similarly, if an impulse wave has decreasing trading volume and a pullback wave has increasing trading volume, we have divergence.
Development between waves
To measure the volume formed in each rising or falling wave, we use the Weis Wave indicator.
The Weis Wave helps us accurately assess upward and downward price pressure between waves.
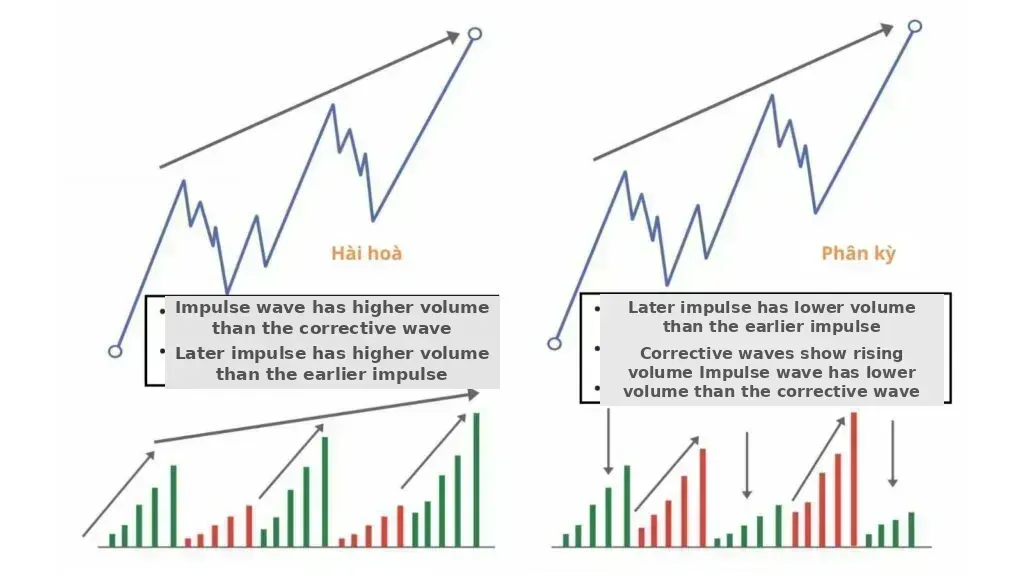 Figure 8: The Law of Effort versus Result between waves
- Harmony appears when an impulse wave is accompanied by higher trading volume than the previous impulse wave (impulse waves gradually rising), and the impulse wave has greater volume than the corrective wave.
- Divergence occurs when impulse waves have gradually lower trading volume, and pullback waves have gradually increasing trading volume. Impulse waves also have lower volume than pullback waves.
One issue to note is that not all trading volume in a rising wave belongs to the buying side, just as not all trading volume in a falling wave belongs to the selling side.
At important price levels
When price approaches a resistance/support level and then breaks out, we determine whether there is harmony between effort and result in that breakout movement.
In the case where price is rising and approaching a resistance level:
- If trading volume is high at the breakout price and the breakout is successful, that is harmony. This volume absorbs all selling forces, making price rise further.
- If volume increases but price makes a false breakout and turns back, that is divergence; all the volume of the buyers has been defeated by the sellers, causing price to reverse in the opposite direction.
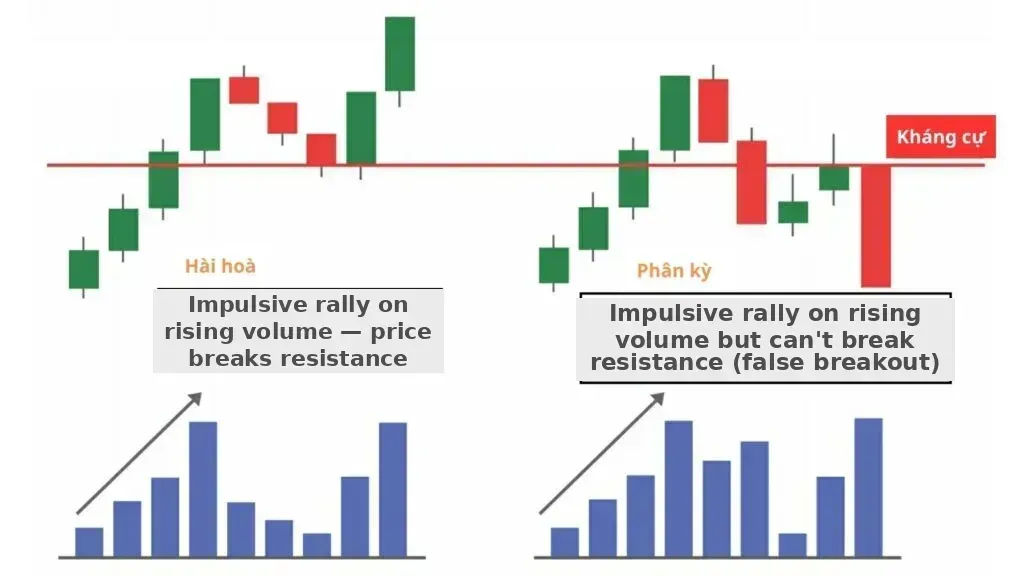 Figure 9: The Law of Effort versus Result when reaching an important level
A climax action (buying/selling climax) occurs when volume increases sharply in a wave and then the trend stops:
- Buying climax (overbought): In an uptrend, a strong rising movement usually ends with the appearance of large volume.
- Selling climax (oversold): In a downtrend, a strong falling movement usually ends with the appearance of large volume.
Why does price move?
Why does price rise? Why does price fall? This is the question in the Law of Supply and Demand section, and the answer is as follows:
Due to the initiative of traders
The key that makes price move lies in the initiative of traders, expressed through market orders.
Traders place market orders with urgency; this is the engine that creates the start of a movement.
Meanwhile, limit orders only express the intention of investors. Sellers set pending sell orders in the Ask column to create supply, and buyers set pending buy orders in the Bid column to create demand.
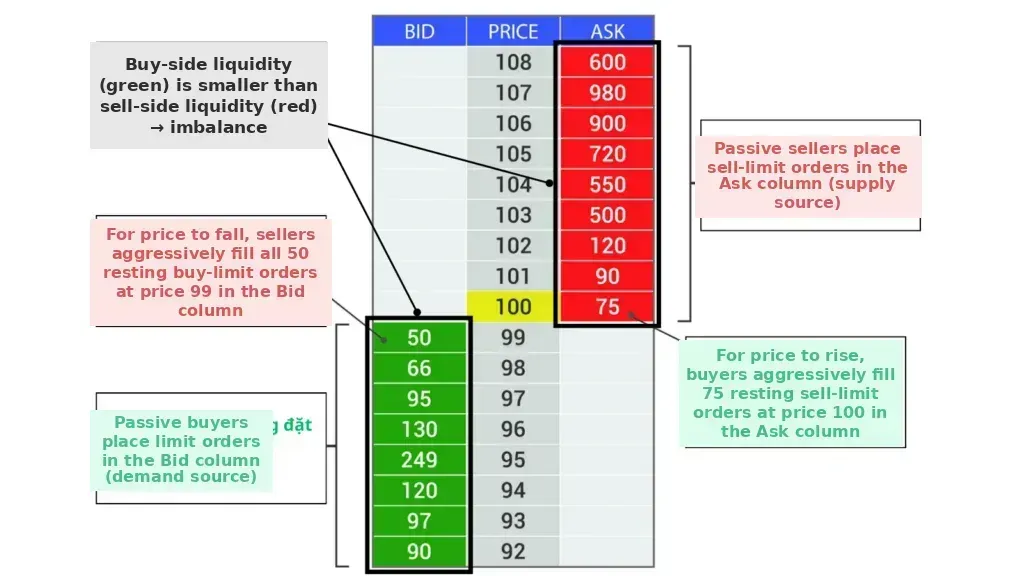 Figure 10: Order book — why does price move?
This supply and demand is precisely the liquidity of that asset in the market, expressed in the order book.
- For price to rise, buyers must buy all the pending sell orders placed in advance and continue buying aggressively to push price up with market orders. Passive buy orders such as limit orders will slow a downtrend but cannot push price up.
- For price to fall, sellers must match all the pending buy orders placed in advance and continue selling to push price down with market orders. Limit sell orders will slow the upward momentum, but cannot push price down.
Due to the exhaustion of the opposite side
Price needs decisiveness to move, but it is also very interesting that a lack of interest or exhaustion from the opposite side also creates favorable conditions for this.
- Sellers being exhausted causes supply to be withdrawn, meaning buyers easily absorb the supply in the Ask column, so price rises with only a little demand.
- If buyers are exhausted, causing demand to be depleted, there are fewer buy orders placed in the Bid column, so only a little supply can make price fall easily.
In Figure 10, we see there is an imbalance between buy limit orders and sell limit orders (expressed through the number of orders placed at price levels).
→ This is a sign that buyers are exhausted; however, it does not mean price will fall, because in reality price is only creating conditions for a fall to occur more easily.
When buyers are weakening, if sellers do not take advantage of the advantage and buyers actively appear, price can still rise.
When exhaustion appears at an important price level, it can cause price to reverse.
- When price falls to a support line after a sharp decline, selling pressure has eased, expressed by small trading volume. Sellers are no longer interested in pushing price down, or they have run out of supply; at this point buyers actively appear, causing price to reverse upward.
- Similarly, when price rises to a resistance level after a strong rally, buying force weakens, expressed through smaller trading volume. At this point sellers actively appear, causing price to reverse downward.
Volume suddenly increasing or decreasing is an important signal helping us determine that price may be coming to an end.
Example of the USD/CHF currency pair:
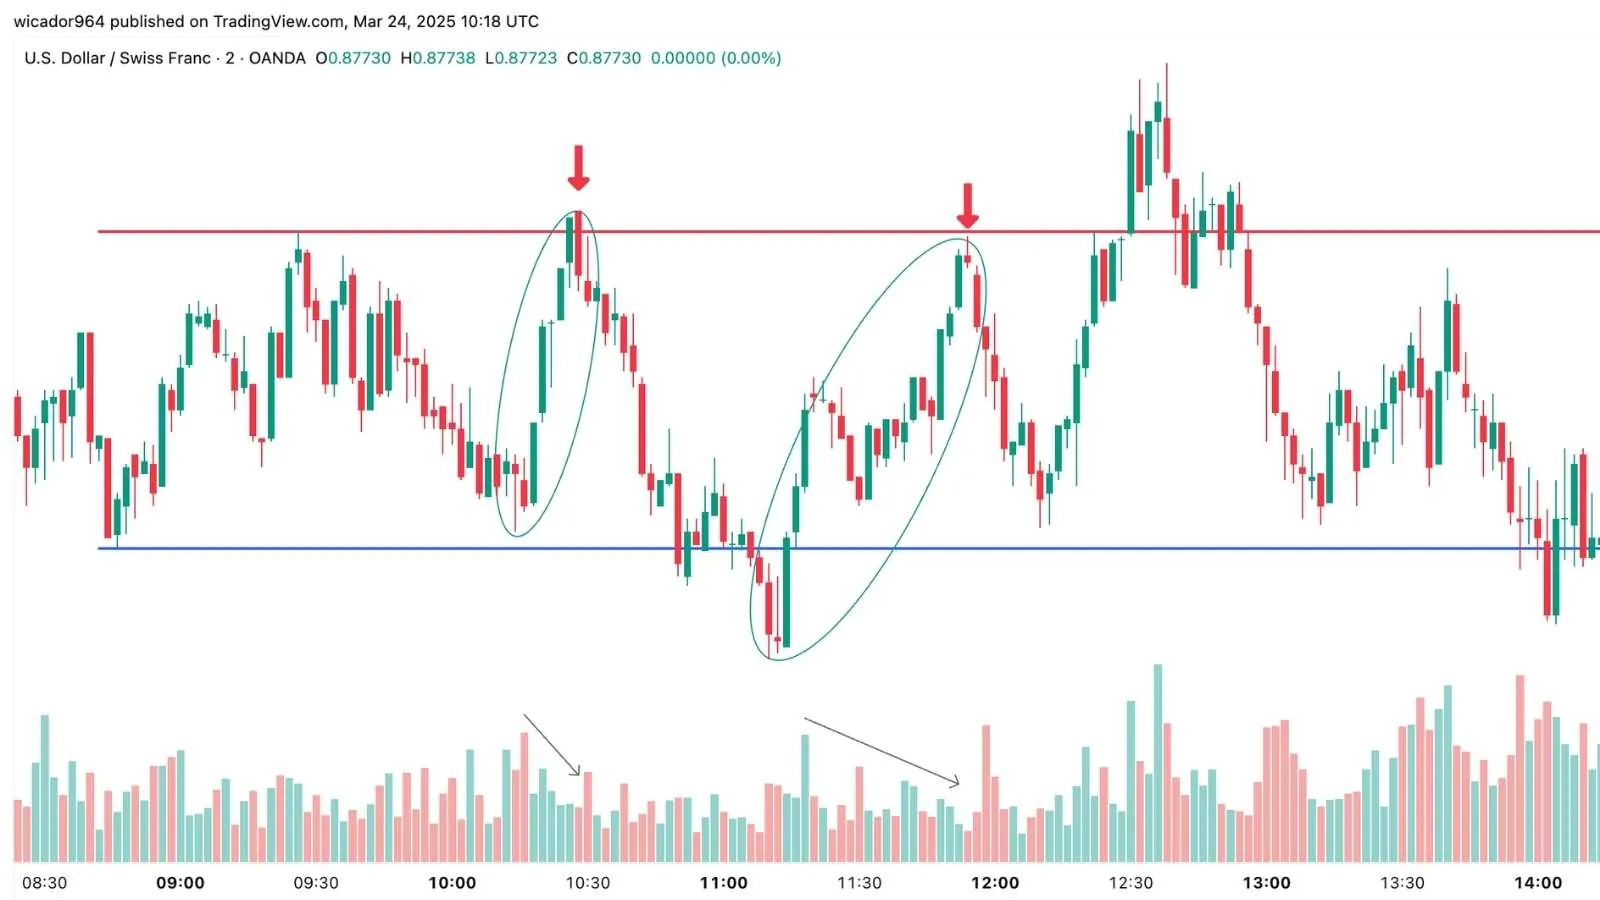 Figure 11: Example of the Law of Effort versus Result USD/CHF
In Figure 11, at the two marked rising swings, we see price rising accompanied by gradually decreasing volume until it touches resistance.
→ This shows that an effort–result divergence is occurring, and at the same time, at the edge position, buyers are lacking interest in pushing price higher (or they may be exhausted).
Afterwards, sellers actively appeared, making price fall easily to the lower edge.
Evaluating effort versus result and supply and demand at edge areas helps us know whether a breakout is false or real.
This is precisely the tape reading technique that we will learn in the following parts.
5/5 - (3 votes)
Read structure 10x faster with JUKA
JUKA maps SMC structure — swings, BOS, CHoCH and inducement zones — automatically on any TradingView chart. No more hand-drawing structure for hours.
Get JUKA — $150