Wyckoff Part 4: The Accumulation Phase
What is the Wyckoff accumulation phase?
Accumulation in Wyckoff is the process by which the CO (institutions, large traders) absorb the floating supply in the market. This is essentially a process of "changing hands" from retail traders to large traders.
When the CO selects an asset to put into their investment portfolio, they will make a plan to accumulate a large quantity of the asset at a favorable price with the expectation of pushing the asset's price much higher.
- When the CO holds the asset, the quality of asset ownership is high → The asset easily rises in price.
- When the public holds the asset, the quality of asset ownership is poor → The asset weakens and easily falls in price.
CHoB and CHoCH in Wyckoff
What is a Change of Behavior (CHoB)?
A Change of Behavior (CHoB or CHoBEV) is a reaction against the current trend.
A change of behavior is meaningful when it has increasing volume and range, showing strong participation from the opposite side.
We can recognize a CHoB through visual assessment; for example, in a downtrend, a notable upward reaction appears (such as oversold) — that is a CHoB.
What is a Change of Character (CHoCH)?
A Change of Character (or characteristic) is a change of the previous trend, formed by three changes of behavior.
CHoCH = 3 CHoB
For example, when price is in a downtrend and three CHoBs appear, we say the downtrend is no longer maintained (it changes to sideways or changes to rising).
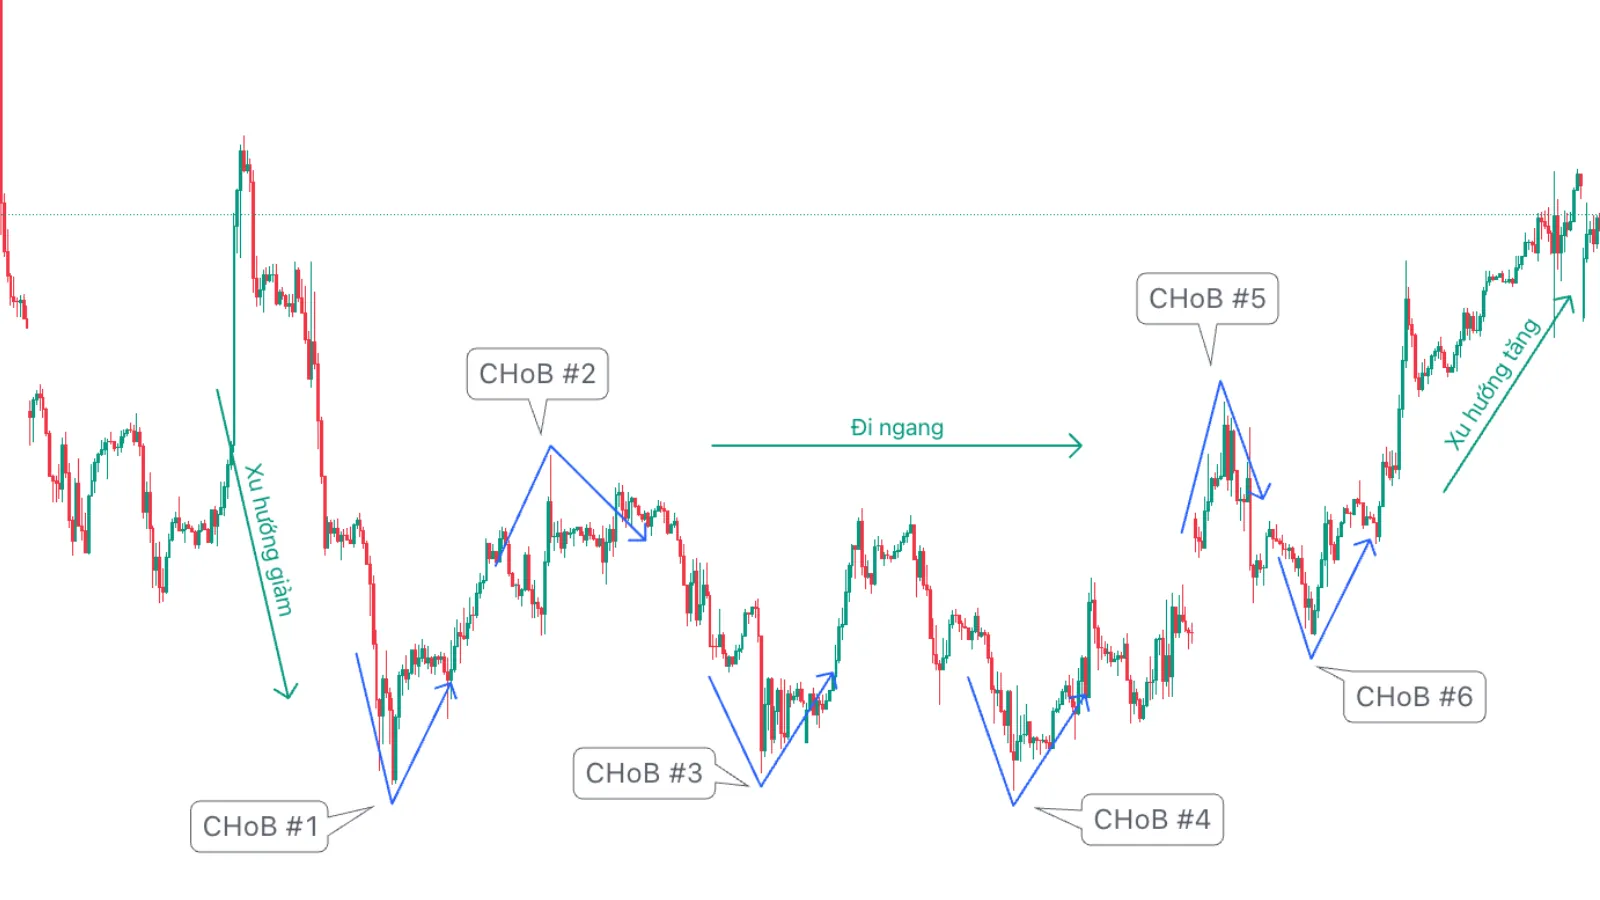 Figure 1: Change of Character
In Figure 1, while in a downtrend we see three CHoBs appear (#1, #2, #3). Among them, CHoB #1 is notable.
It was these three changes of behavior that caused supply and demand to rebalance, and price changed from a downtrend to sideways.
While moving sideways, three CHoBs appear (#4, #5, #6); CHoB #6 is higher than CHoB #4 and the subsequent movement exceeds CHoB #5, causing the market to change from sideways to an uptrend (higher highs and higher lows).
The stopping action of a downtrend
A downtrend occurs when there is an imbalance (supply > demand), reflecting poor quality of asset ownership. Wyckoff held that the asset is in the hands of retail.
Price can fall for a long time, accompanied by negative news causing retail to worry and dump the asset.
Finally, after a strong and fast decline, a candle appears with a range and volume that may be much larger than normal levels.
We call that oversold (SC). It is highly likely that the CO bought at that candle, causing price to rally (AR). This is precisely a CHoB.
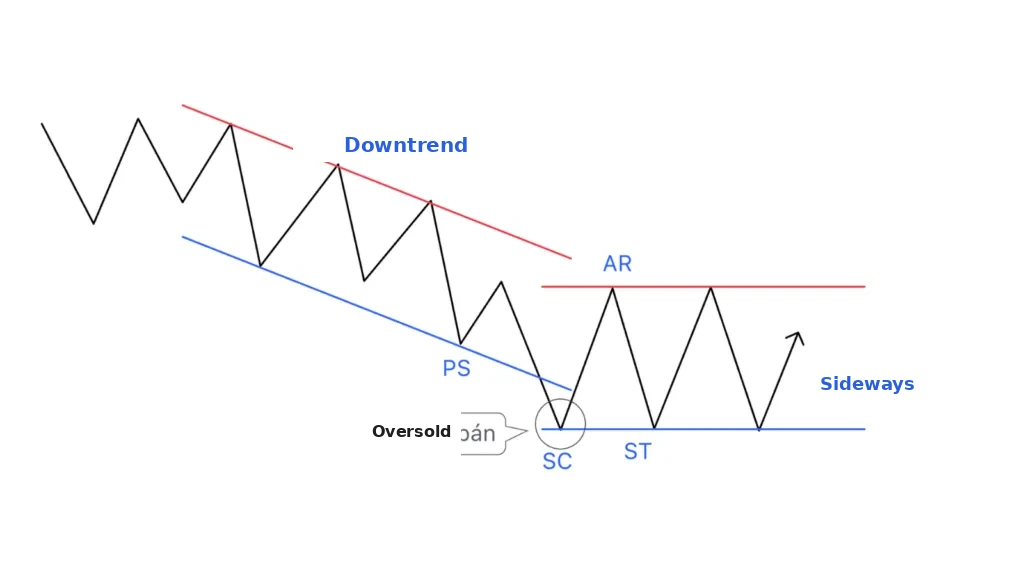 Figure 2: Change of Character from falling to sideways
Wyckoff analysis looks for four points on the chart including: PS, SC, AR, ST.
Among them, SC, AR, ST are the three events that make price change its behavior.
3 CHoB = CHoCH → the downtrend phase stops and a new trend forms.
At this point, we draw support and resistance lines parallel to each other through SC and AR, which are the edges of a trading range (TR).
A TR is a sideways price area; distinguishing whether price will next break down (redistribution) or break up (accumulation) out of the TR is the work that a Wyckoff analyst needs to perform.
In this article we only analyze the stopping action of a downtrend; analysis of the downtrend will be performed in later articles. Just remember one thing: when price is in a downtrend, it is truly chaotic and may lie in a price channel or not.
Absorption action in the sideways phase
If the TR is an accumulation area, there will always be a source of supply "hanging overhead" ready to be sold outside the market.
The CO carefully plans to absorb this supply at a low price quietly without attracting the public's attention.
As the accumulation phase develops, the CO compete to buy the little remaining supply, while retail become increasingly pessimistic because price always stays at a low level.
→ This is precisely the CO's intention: keep price at a low level.
Absorption is the main characteristic that a Wyckoff analyst needs to pay attention to in the accumulation phase.
This is the phase where retail endure suffering; at some point they will sell the remaining supply into the hands of the CO.
When the CO has absorbed enough supply in the market, selling pressure decreases, the path for price to go up will have little obstruction and only a little demand will push price to jump sharply.
Absorption is like dropping a sponge into a basin of water; it will absorb the water in the basin gradually in a way that is hard to notice. By the time the water in the basin has been fully absorbed and the sponge is saturated, just a light squeeze will make the water spray out.
The Wyckoff accumulation structure
The Wyckoff structure is divided into events and phases, showing consistency in reading price action, but still having the flexibility to observe price movement.
Accumulation has two common forms with phases and events as follows:
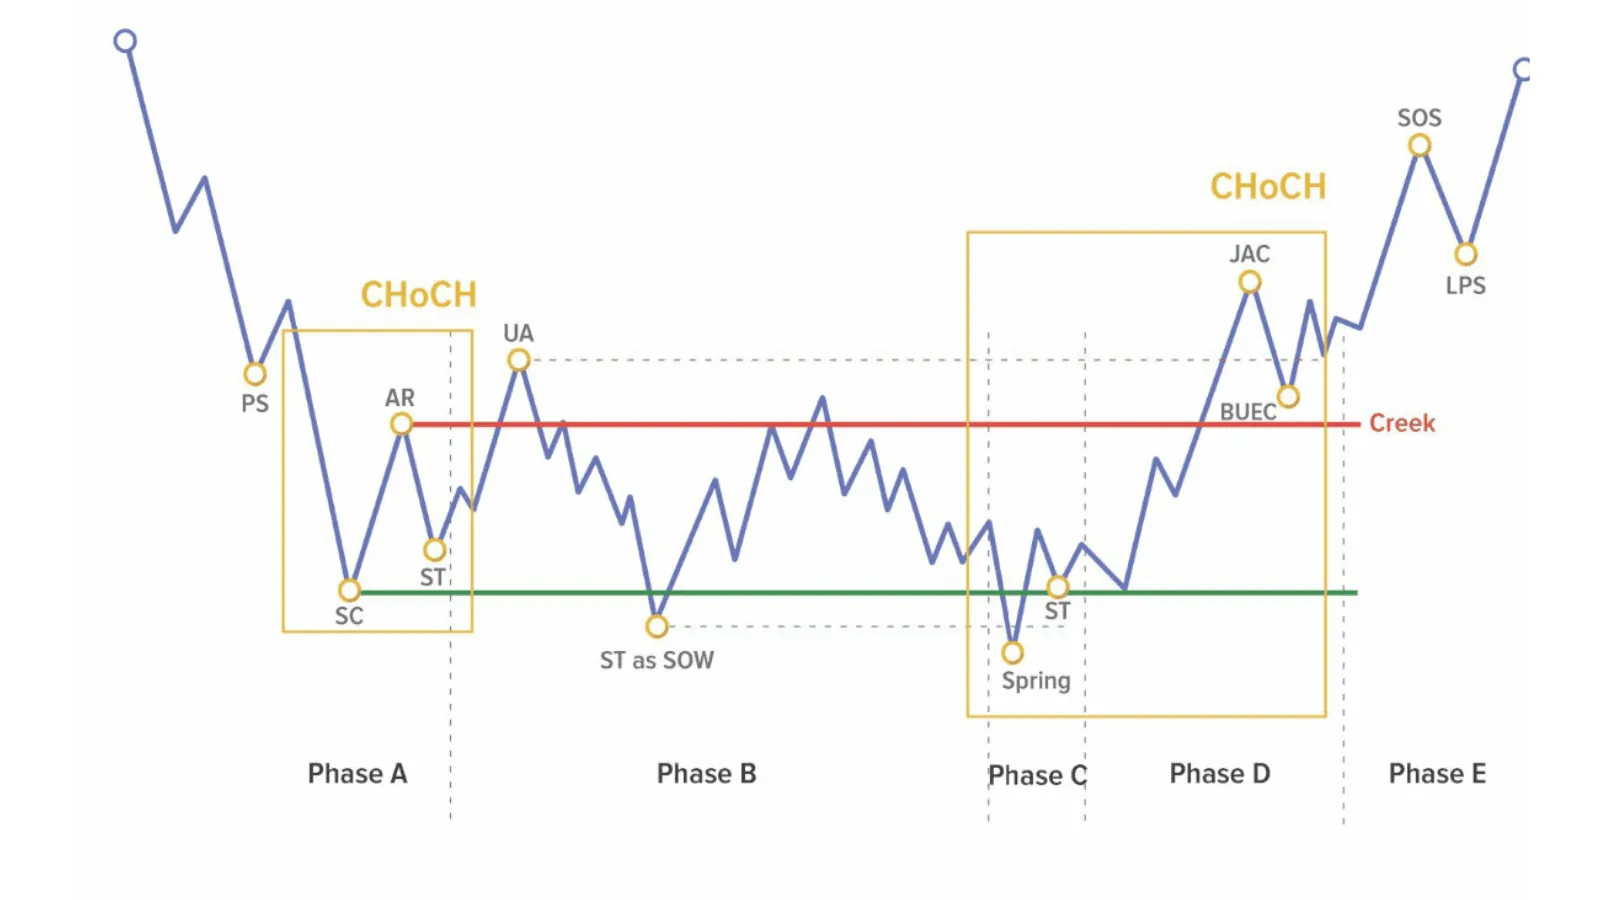 Figure 3: Accumulation with a Spring
 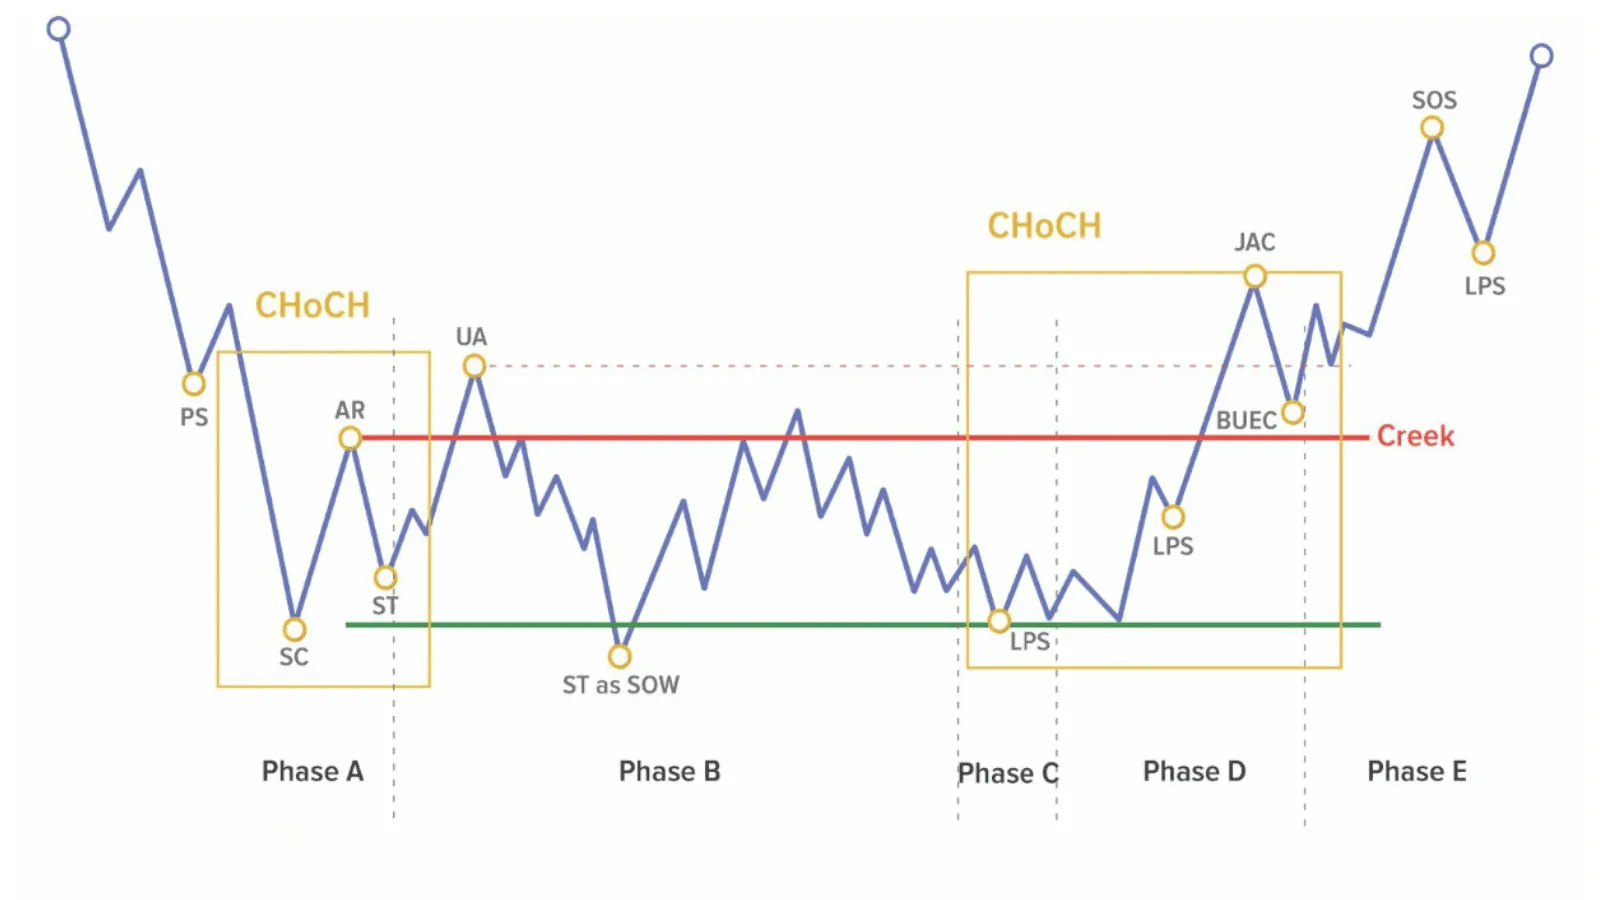 Figure 4: Accumulation without a Spring
There are two common types of accumulation structure: accumulation with a Spring (Accumulation with Spring action) and accumulation without a Spring (Accumulation without Spring), as in Figure 3 and Figure 4.
The triple-bottom reversal pattern is precisely this form of accumulation structure.
Phase A: Ending the previous downtrend
Phase A lies at the end of the downtrend phase; the supply that dominated beforehand seems to be becoming exhausted.
PS (Preliminary Support): First support
The PS event is the initial sign of the first demand participating in buying to block the downtrend; this effort always fails.
At PS there is increased trading volume and a large price range; however, it is only speculative, helping us begin to picture a scenario where price is about to stop falling.
PS does not necessarily always have to appear.
SC (Selling Climax): Selling climax (oversold)
The SC event is a selling action pushed to a climax, showing the panic of the crowd.
Trading volume usually seen at SC is very large and a long candle wick may appear. This means the CO absorbed the supply there.
After the SC event, price will change its behavior significantly (CHoB) and the lowest price at the SC candle is determined to be the support line of the TR.
Note that trading volume at SC is not always high; there are two reasons for this:
- The CO absorbed most of the supply at the PS event. Because supply was already depleted, the demand needed to absorb at SC does not need to be large, leading to volume not being large.
- Sellers do not want to sell at a low price; they expect price to rise again. At this point they will be a potential source of supply that the CO needs to absorb in the future.
AR (Automatic Rally): Automatic rally
After the CO absorbs most of the supply at SC, selling force has decreased sharply. Only a small amount of demand can easily push price up.
The highest price of this rally is the AR, from which the resistance line of the TR is determined.
ST in Phase A (Secondary Test): Secondary test
This is the action of price falling back to the TR support level with the purpose of testing the remaining supply from the SC event.
The ideal case is that the range and volume at ST < SC. However, if sellers still hold goods after the SC event, they may sell strongly, causing volume at ST > SC.
After enough of the three CHoBs — SC, AR, ST — have appeared, supply and demand become more balanced and price officially enters the TR area.
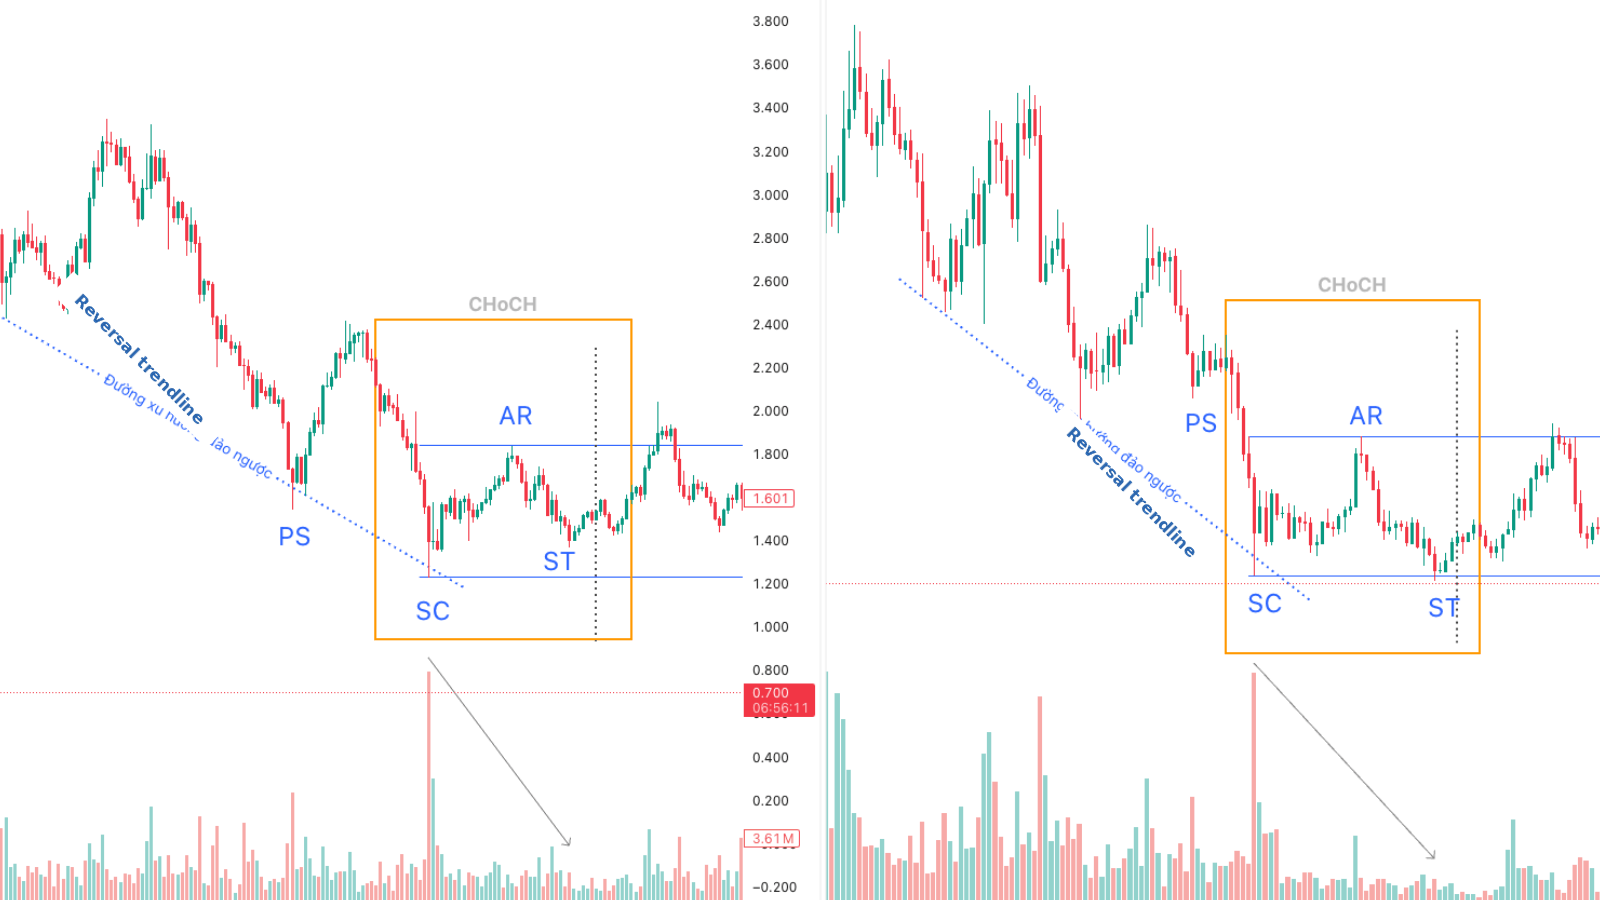 Figure 5: Accumulation structure with volume drying up in Phase A
The two examples in Figure 5 show that after price reaches an oversold state SC with wide volume and candle range, price rallies to the AR level and then falls down to ST with both range and volume smaller than at SC, proving that the supply that sellers want to sell at that time has clearly weakened.
A few signs to assess which side is in control:
- ST position above SC → Buyers are in control.
- ST position below SC → Sellers are in control.
The control and effort that we observe on volume are only temporary in nature.
In reality, the potential supply that sellers do not yet want to sell will create many different cases; we should not be rigid in analysis but need flexibility.
Supply not absorbed in Phase A will continue to be absorbed by the CO in the following phases.
Phase B: Building cause
This is the phase of building cause to prepare for a subsequent effect.
In this phase, supply and demand are mostly in a state of balance and hard to recognize. We have a few clues (for reference only):
- At the beginning of Phase B, large volume and strong fluctuation range.
- Toward the end of Phase B, volume decreases more and more because supply has been gradually absorbed.
As long as supply is still present, Phase B will continue and prolong the accumulation process.
Phase B is usually the longest phase, discouraging the public and making them endure suffering leading to discouragement and dumping goods into the hands of the CO.
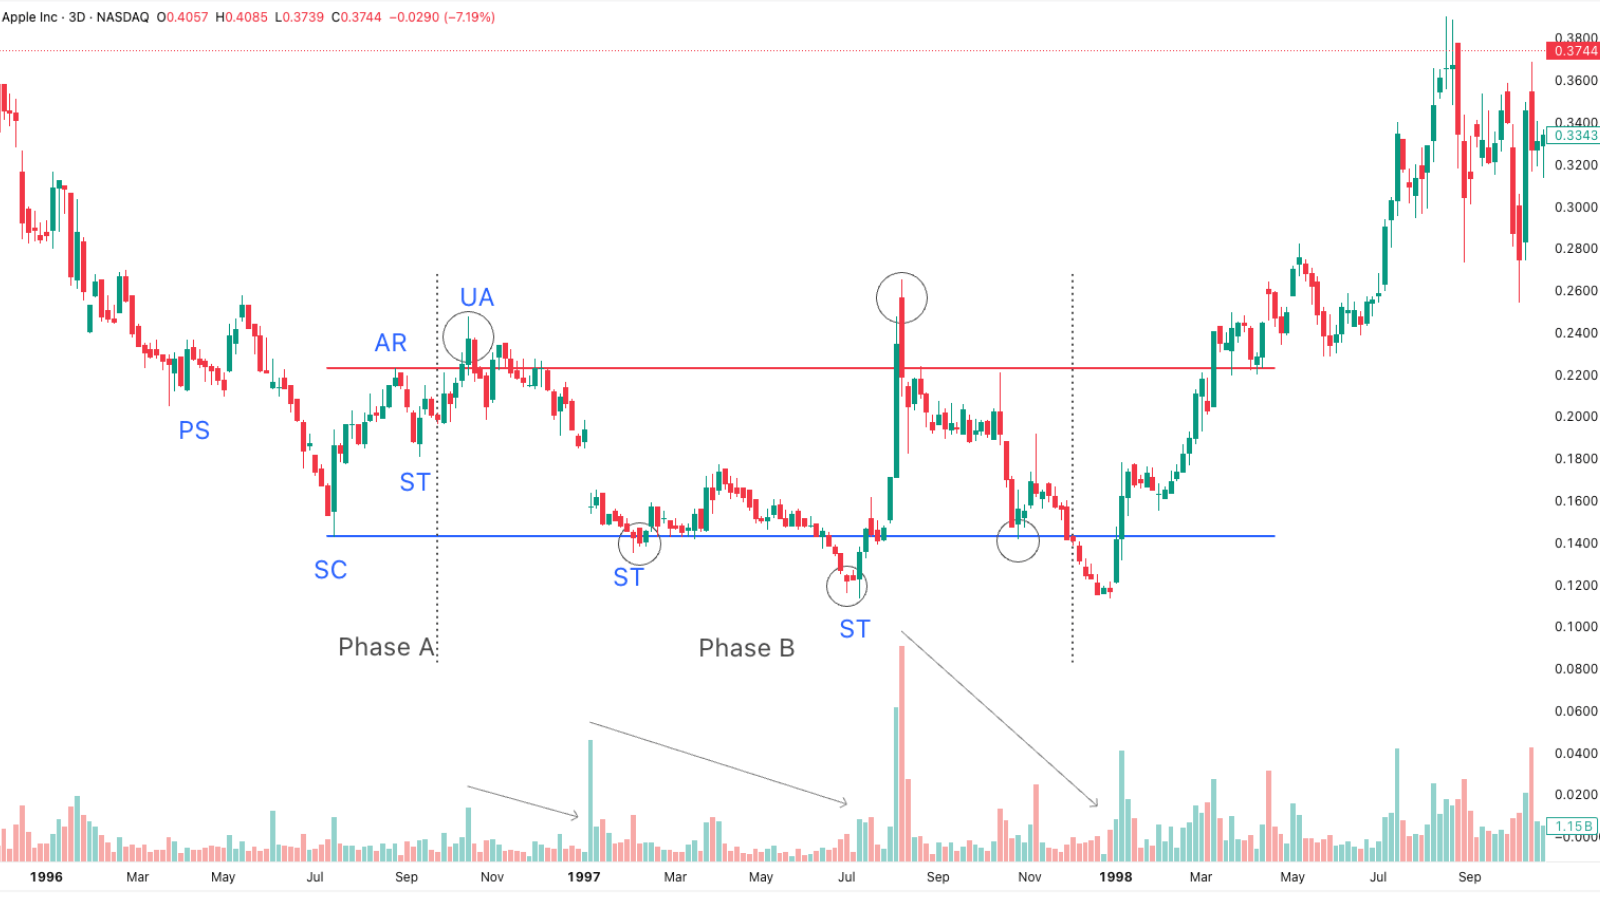 Figure 6: Phase B of Apple stock
UA (Upthrust Action): Bull trap
The UA event is a false breakout to retest the resistance level created by the previous AR.
The CO performs two operations to eliminate selling pressure:
- Push price above resistance to activate passive sell orders, causing them to be stopped out.
- Push price back into the TR, causing those who bought at the false breakout position to be stopped out.
ST in Phase B
This continues to be the event of retesting the support area created by the previous SC.
The CO performs two operations:
- Push price lower than SC in order to eliminate those who are holding goods. Those who bought at the previous low price are stopped out, and those who chased the top at high prices must dump goods and cut losses.
- The CO proceeds to buy in to push price back into the TR, sweeping the stop losses of short sell orders at the false breakout position.
Testing supply at the upper edge and lower edge of the TR is repeated many times; we often call that "kill long, kill short".
In addition, with stubborn sources of supply, the CO will not participate, causing the market to become boring; prolonged loss-bearing pressure causes them to give up and exit their goods.
Phase C: Testing supply at the bottom
The absorption process is almost complete. The CO will proceed to test supply to see whether price is depleted enough to be ready to enter an uptrend.
Spring
The event of a false breakout below the lowest bottom of the TR established in Phases A and B, after which price quickly returns inside the TR.
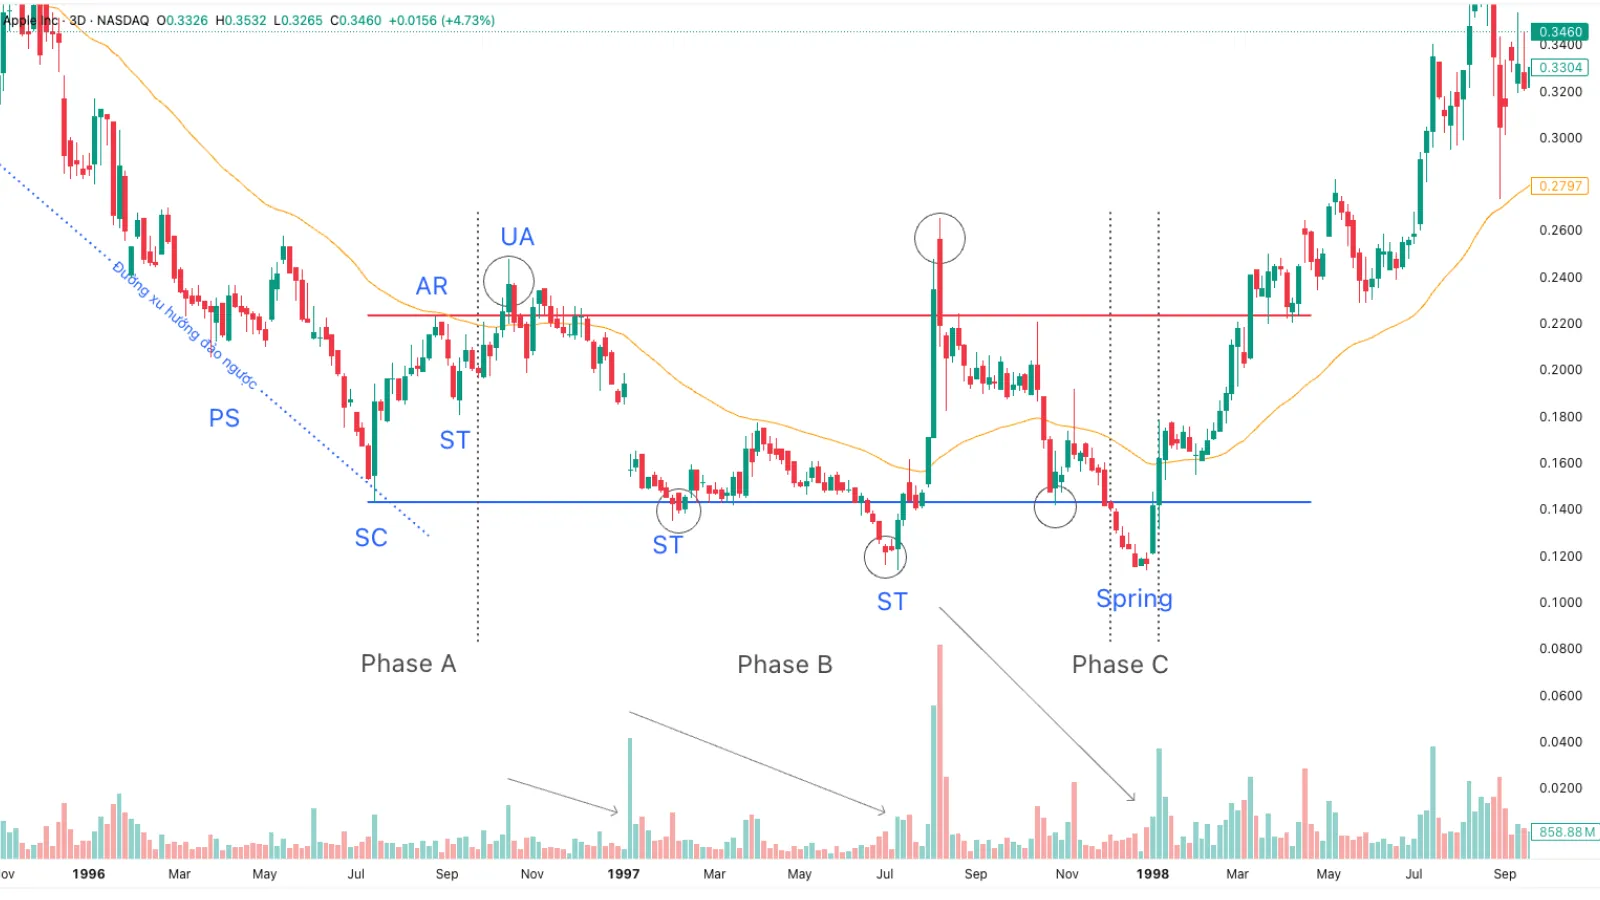 Figure 7: Phase C with a Spring in Apple stock
This action is considered a bear trap, activating the final supply and short sellers.
There are three different types of Spring that will be studied more thoroughly in the Wyckoff events parts.
The CO's purpose in creating a Spring:
- Push price to touch the deepest stop loss level of those holding goods.
- Induce the public to sell because they think the market has entered a downtrend.
- Buy at a cheap price.
After the Spring event, a price recovery movement back to the support line of the TR usually appears to test whether selling force is still aggressive, called a Test Spring, which is also the point giving us an opportunity to open a buy position.
Shakeout
If a Spring has most candles closing below the lower edge of the TR and lasts for a period of time, that is a Shakeout.
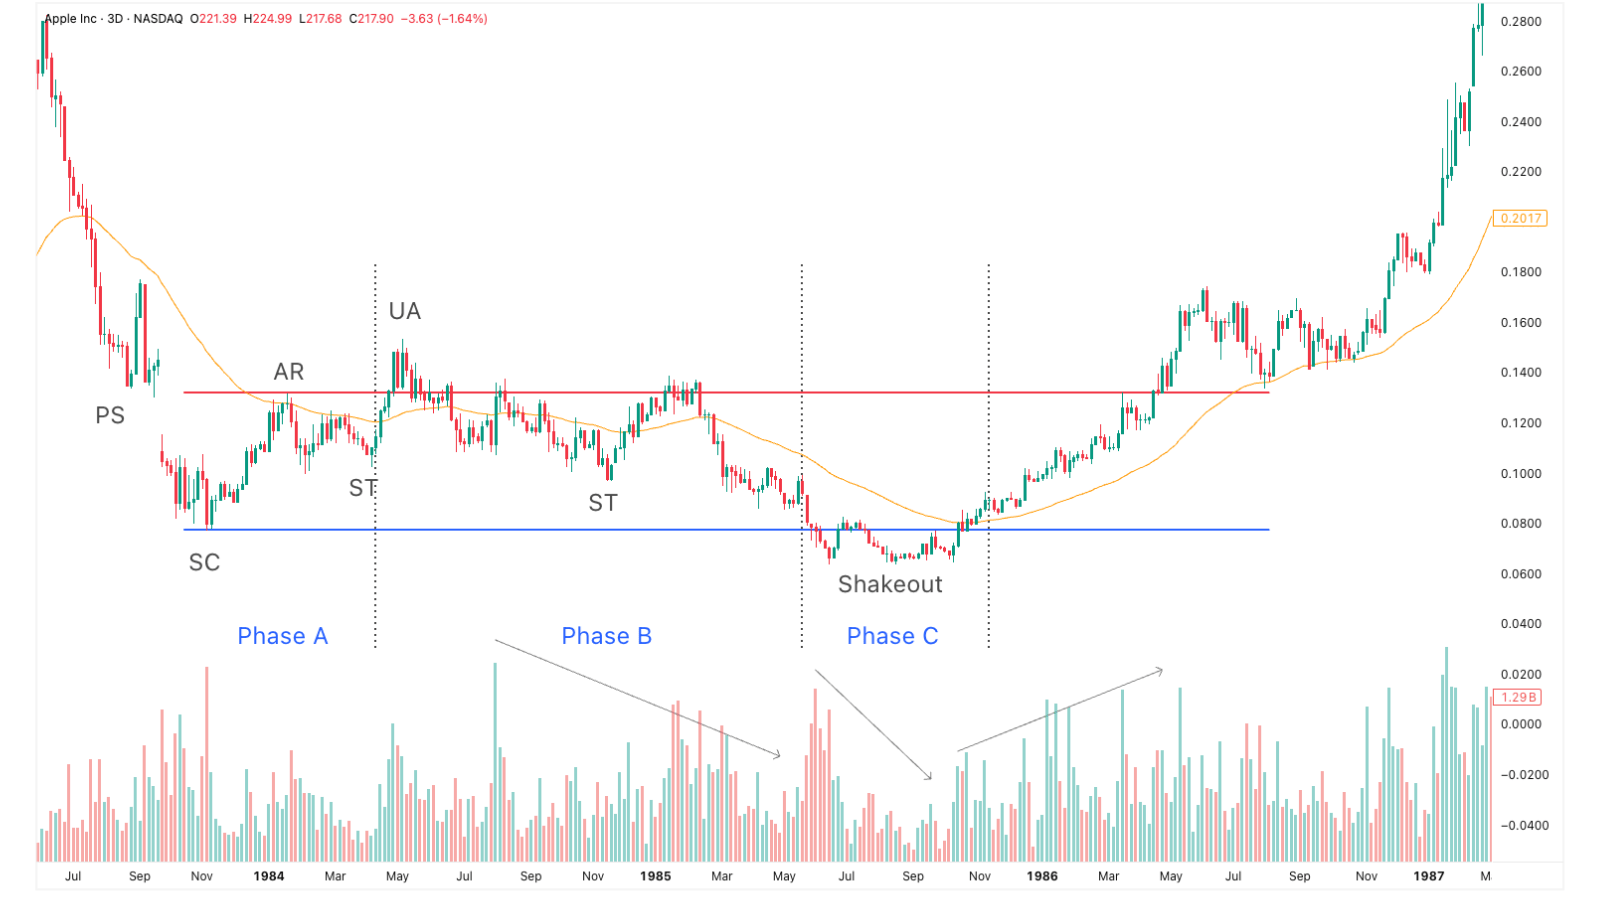 Figure 8: Phase C with a Shakeout in Apple stock
A Shakeout is an action by which the CO deliberately makes the public think price will go down.
The Shakeout process is itself an accumulation structure on a small timeframe.
Note that an accumulation structure does not always have a Spring or Shakeout.
LPS in Phase C (Last Point of Support): Last point of support
If supply has truly been depleted, a Spring/Shakeout will not appear; instead there will be a test in the form of a falling price movement, but which fails to touch the lowest price area of the TR.
That is precisely the LPS; this event is similarly important to a Spring, and is the final action before the uptrend begins.
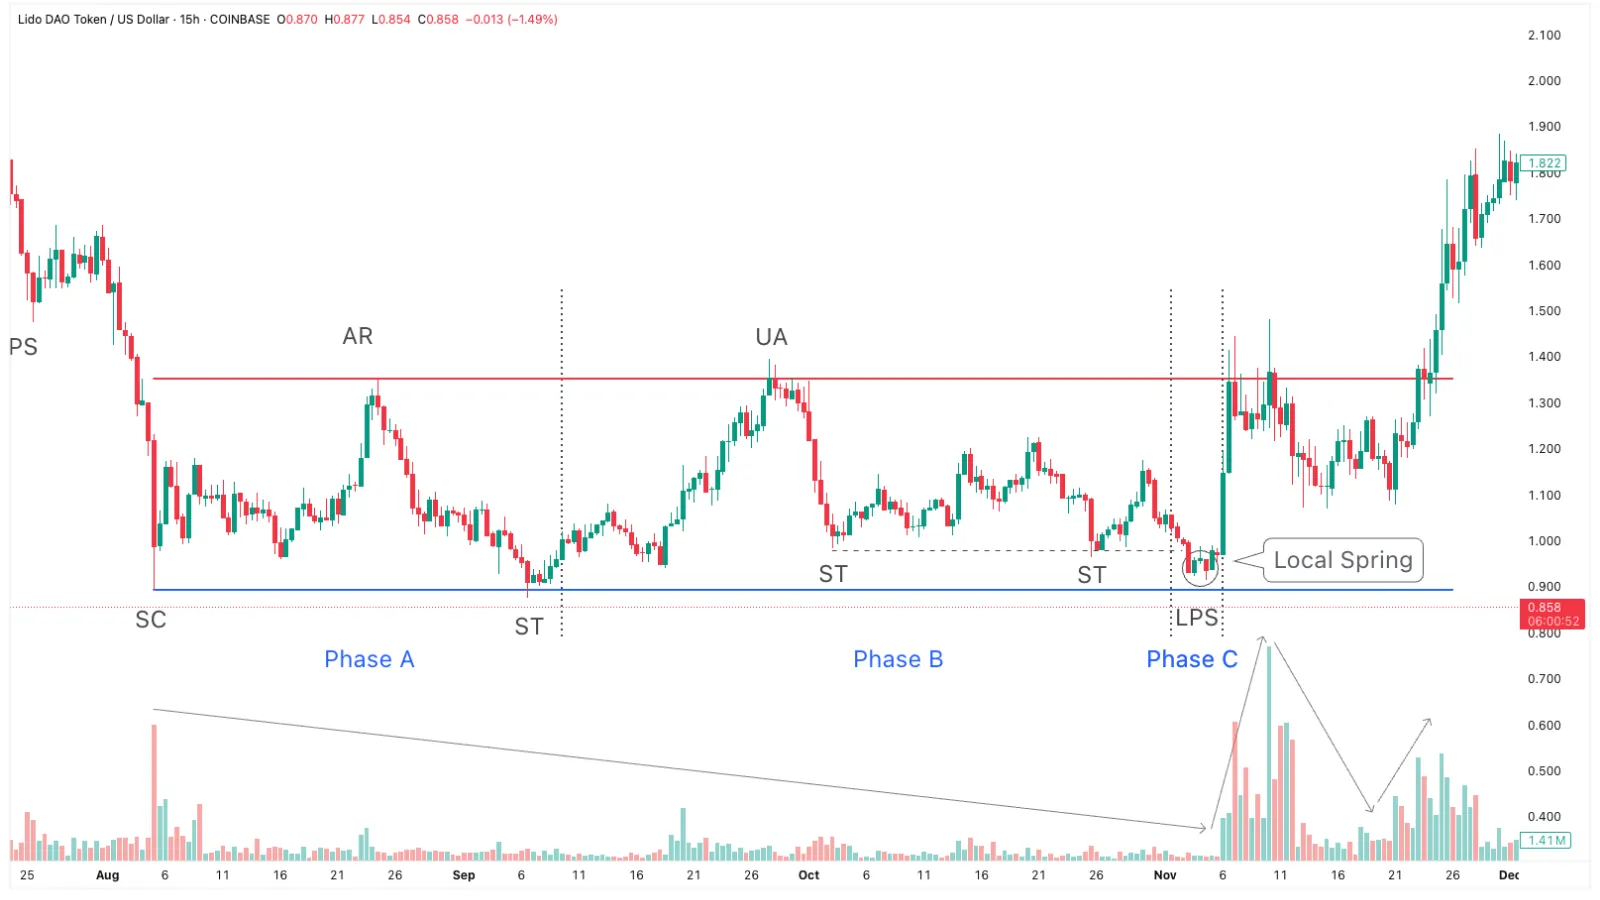 Figure 9: Phase C without a Spring on the LDO/USDT pair
A Spring or LPS is a notable change of behavior, initiating the final uptrend within the TR.
Identifying Phase C without a Spring is very difficult because this area still has the potential to create a Spring, making us doubt whether price will push down further.
A sign to identify an LPS in Phase C may be a Spring of a small structure as in Figure 9.
The safest buying opportunity for this type of structure is found at the BU in Phase D.
Phase D: Price rising within the Trading Range
After Phase C tests successfully, in Phase D demand overwhelms supply, causing price to rise rapidly with a strong range and increased trading volume.
This is the final rising phase within the TR before price breaks out and enters an uptrend outside.
SOS (Sign of Strength): Sign of strength
SOS is a rising price movement toward the top area of the TR; price jumps over the upper edge with large volume and a wide range, showing strong demand.
In the process of price going up to create an SOS, there may be pullbacks with gradually smaller volume (LPS) that will be excellent points to enter buy orders.
SOS is also called the "Jump across the Creek" action (JAC).
The Creek is a resistance line connecting the peaks formed throughout the development of the TR.
JAC is the action of jumping across the Creek with a strong rising candle, marking that the strength of the buyers has overwhelmed the sellers; the demand > supply imbalance causes price to escape the TR area.
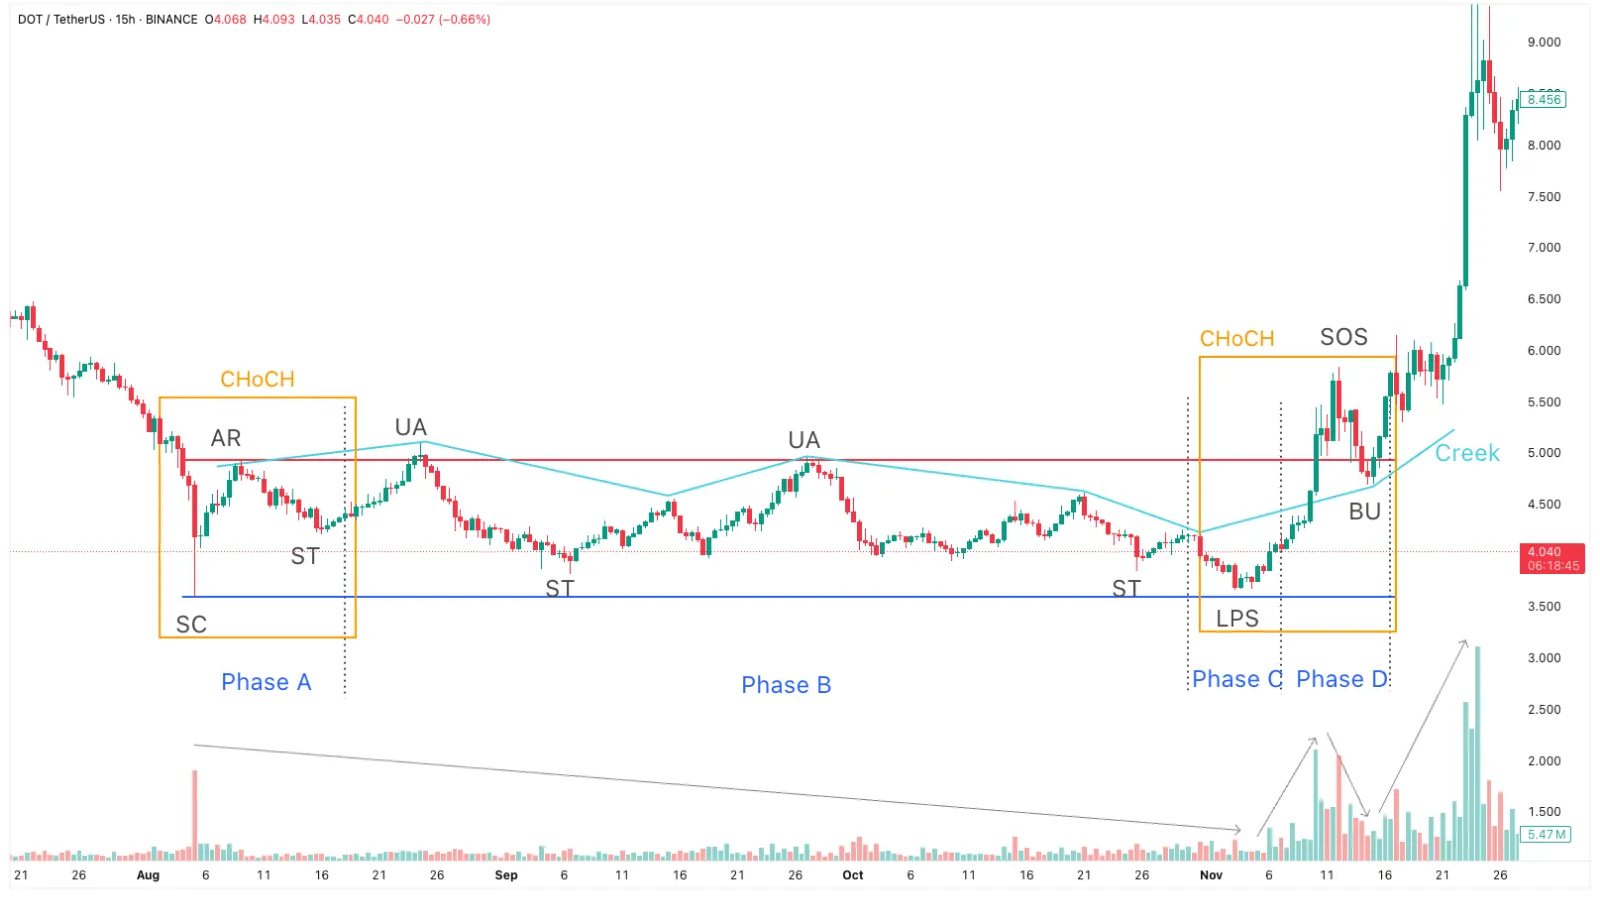 Figure 10: Phase D on the DOT/USDT pair
In Figure 10 is an example of an accumulation structure without a Spring:
- Volume decreases from the beginning of Phase A to Phase C.
- We identify the LPS in Phase C after volume gradually increases together with rising candles whose closing prices are close to the candle highs.
- Price breaks through the Creek with an SOSBar candle.
LPS in Phase D
This is a corrective movement retesting the Creek, with price range and volume gradually narrowing.
This is also called "Back up to the edge of the Creek" (BU).
The Creek can be higher or lower than the TR resistance line; the purpose of this test is to absorb the remaining supply in this upper edge area.
Thus, three changes of behavior have appeared including: Spring, SOS, BU → Price changes character (CHoCH), changing from sideways to an uptrend.
💡 If the SOS fails and price returns to the equilibrium area, it is very likely price will go down to the lower edge and the SOS becomes a UTAD in a distribution structure.
That is why we should not enter buy orders at breakout points; BU and LPS are much better choices.
Phase E: Entering an uptrend outside the Trading Range
Price breaks through the SOS and officially enters an uptrend; consecutive SOS and LPS appear, creating higher highs and higher lows.
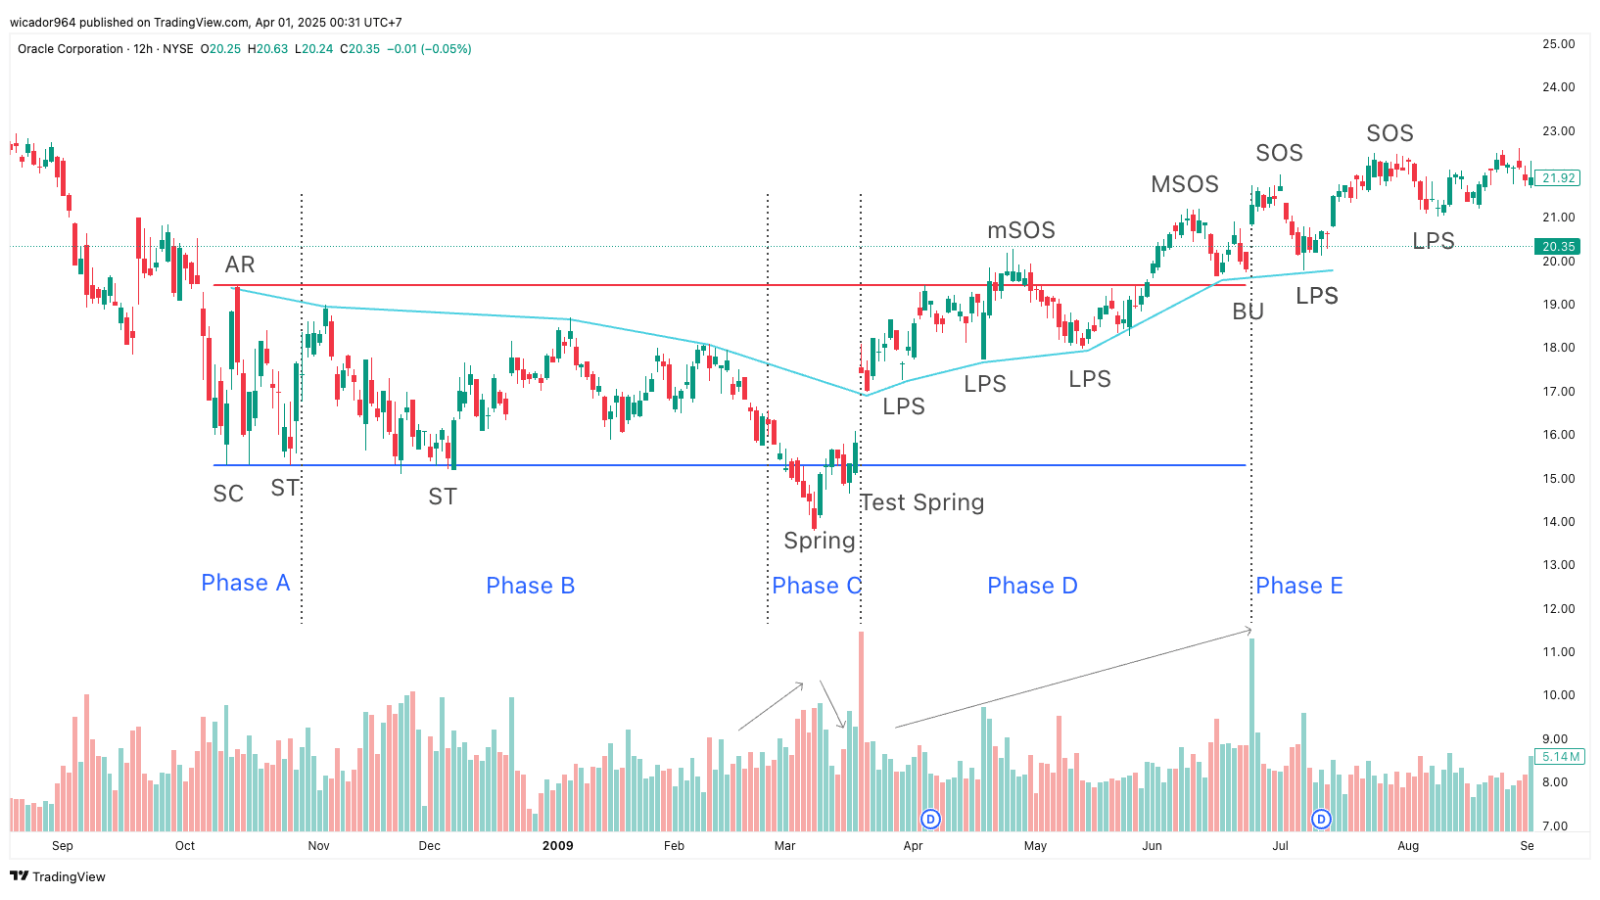 Figure 11: Phase E in Oracle stock
According to the Law of Supply and Demand, we say that price leaves the equilibrium area and enters an imbalanced area.
The uptrend will stop when price finds and accepts a new equilibrium area.
In Phase E we can open buy positions at LPS positions, and use the PnF chart to count price targets to calculate future forecasts.
Example of an accumulation structure with a Spring in Figure 11:
- At the potential Spring area, volume increases sharply. Afterwards the Test Spring has decreasing volume, followed by a rising candle breaking through the Creek with increasing volume → Supply is depleted and demand appears.
- Price continuously creates new higher highs and lows with gradually increasing volume.
- Potential entry points at: Test Spring, LPS (D), BU, LPS (E) when an SOSBar candle appears.
Signs of identifying accumulation
- Volume and range gradually decrease during the formation of the TR because floating supply becomes less and less.
- Tests at the upper edge area have depleted volume, showing an absence of selling force, except when price is preparing to move outside the price range.
- Upward movements are gentler, with a wider range compared to downward movements.
- Toward the end of the price range, higher highs and higher lows form.
Identifying events and dividing phases is only most accurate when the structure has been completed. While the TR is developing, one should only predict potential to make decisions and need to change bias depending on price action.
4.5/5 - (8 votes)
Read structure 10x faster with JUKA
JUKA maps SMC structure — swings, BOS, CHoCH and inducement zones — automatically on any TradingView chart. No more hand-drawing structure for hours.
Get JUKA — $150