Wyckoff Part 3: Auction Theory – Understanding How the Market Operates
The financial market is like auctions, where buyers and sellers meet and negotiate with each other.
What is auction theory?
Auction Market Theory is a model explaining how the financial market operates as a continuous auction, where buyers and sellers negotiate to find a fair price.
J. Peter Steidlmayer was the first to apply auction theory to trading through Market Profile.
Afterwards, Jim Dalton developed this method through deeper research into market behavior.
Market efficiency
In the previous part, we learned about the Law of Supply and Demand and learned about the equilibrium area.
When price reaches the equilibrium area, the market is efficient, and when price falls into an imbalanced area, the market is inefficient.
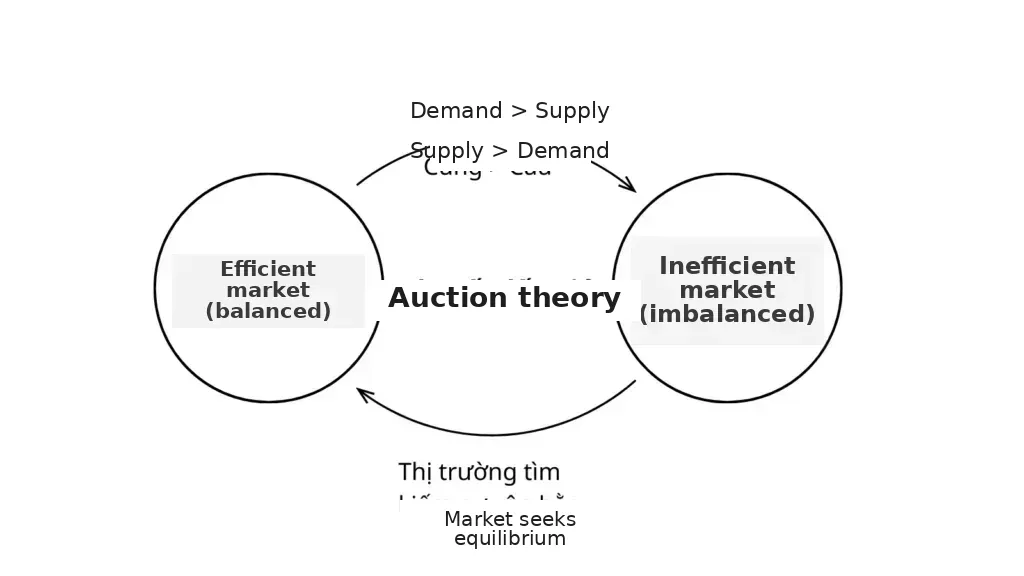 Figure 1: Market auction theory
Efficient market
The bidding process takes place between the participants, causing price to move to find the equilibrium area.
The equilibrium price area is seen as a range where price reverses continuously every time it touches the edge of that area, forming a phase of horizontal development.
Within that range, buyers and sellers feel comfortable trading and no clear control from either side appears.
→ At this point the market is achieving efficiency.
Buyers feel they are buying cheap and sellers think they are selling dear.
Inefficient market
At some point, when information (good or bad) is released causing buyers and sellers to feel that the price within that range is no longer efficient, they will develop a disagreement.
One of the two sides will take control and push price out of the previous equilibrium area. This is the phase where price develops vertically.
On the chart, the imbalanced price area is a clear uptrend/downtrend after price breaks through the equilibrium area, forming a rising/falling price channel.
→ At this point the market is inefficient.
Price will continue to move in the imbalanced area (an uptrend or downtrend) through the control of buyers or sellers, until they find a "common voice".
At this point, both sides have come to agree on price, causing the market to fall into a new equilibrium area.
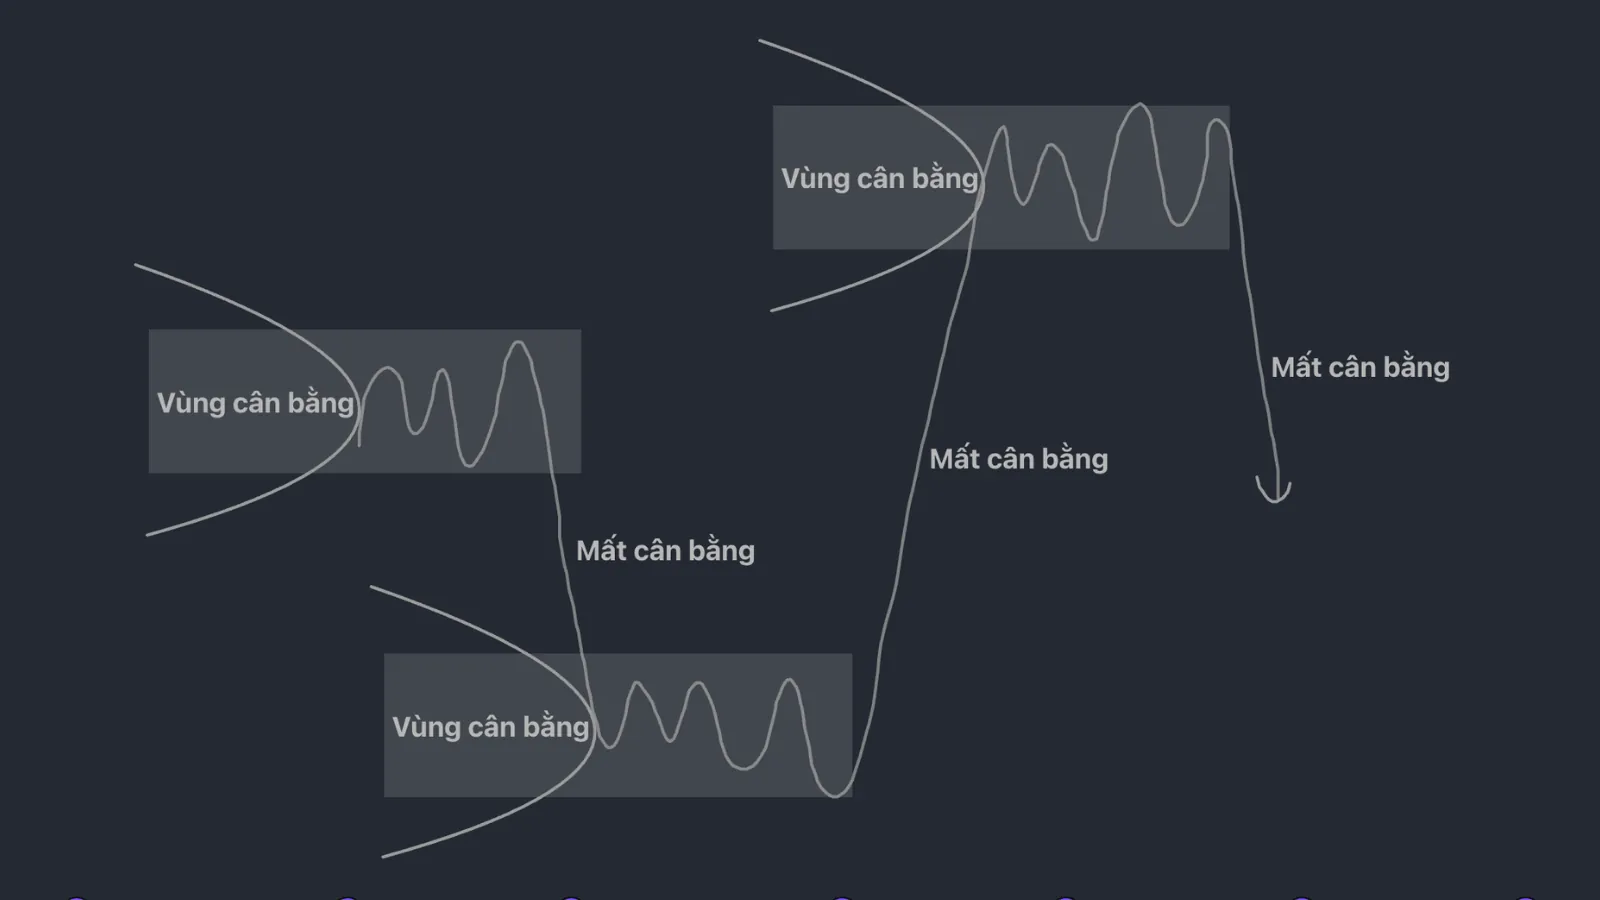 Figure 2: Price continuously rotates between the two phases of balance and imbalance
Price continuously goes from one equilibrium area to another equilibrium area, creating a full market cycle that we learned in Part 1.
Most of the time price lies in the equilibrium area, about 80% sideways and 20% trending.
The equilibrium area is precisely where price accumulates or distributes, which the Wyckoff methodology focuses on exploiting.
Example of auction theory:
On the stock market, Tesla stock is trading at $500.
After news that a Tesla self-driving car caused an accident, the stock price falls because investors lose confidence.
The stock continues to fall until buyers feel satisfied at $300 and buy in, and price creates a new equilibrium area.
After a period of time, the self-driving car's faults are fixed, and Tesla stock rises back to the old equilibrium area around $500.
We will go deep into analyzing auction theory on the chart based on the Volume Profile tool in later articles!
Asset value
When the market achieves efficiency, auction participants are accepting the value of the asset in that equilibrium area.
We will go deep into analyzing the factors that make up the value of an asset, including: price, time, and volume.
Value = Price + Time + Volume
Price
Price is like a probing tool. It always moves to probe the level of reaction of market participants.
- If participants feel the price is reasonable, they will participate in trading.
- If the price found does not attract participants, they will refuse to trade and price will move to another area that is more attractive.
Time
In a price area that participants feel is reasonable to trade, price will spend a lot of time staying there.
- The more efficient the price area, the longer participants want to stay and trade.
- An inefficient price area will cause them to participate for a shorter time.
The attractiveness of a trading range is directly proportional to the time it exists.
The longer price stays in a range, the farther price will go after escaping from that range (review the Law of Cause and Effect).
Volume
Trading volume represents the effort of that price level, expressing the interest of auction participants.
Price areas with high volume mean that price area is highly valued by market participants, and vice versa.
The three variables of price, time, and volume can change, making the value of the asset change accordingly. Therefore, traders need to evaluate them continuously to find a fair value level.
Changes in value
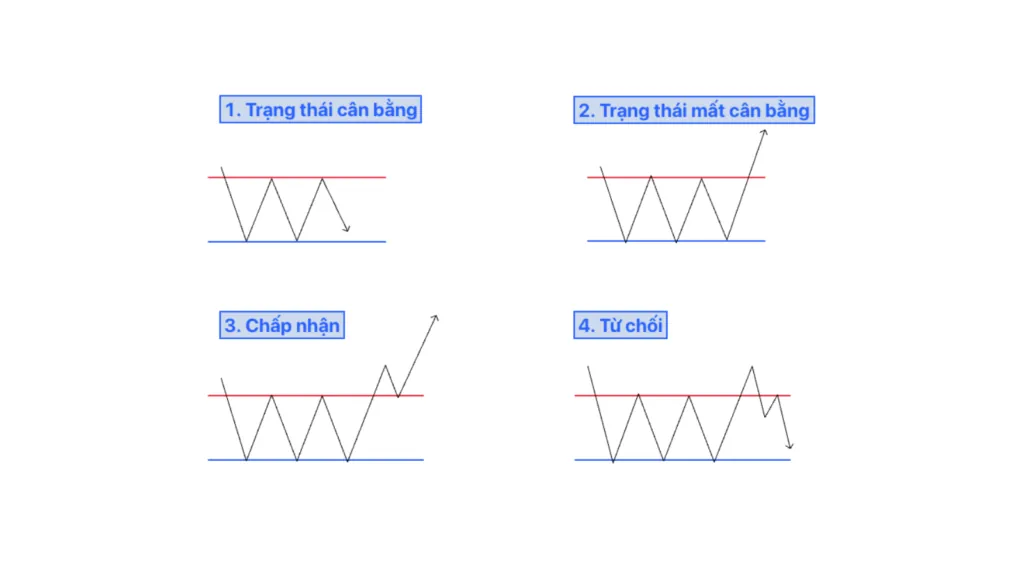 Figure 3: Accepting or rejecting value?
Explanation of Figure 3:
- When price is in a state of horizontal development (balance), price and value coincide.
- When price escapes the equilibrium area and moves to a state of vertical development (imbalance), price and value are diverging.
- Price goes first, value accepts and follows (value acceptance).
- Price goes first, value does not follow (value rejection), causing price to return to the previous equilibrium area.
In a state of balance, the most balanced price level will lie in the middle of the upper and lower edges of the structure.
When price touches the upper edge, buyers feel it is expensive and do not want to buy, and when price touches the lower edge, sellers feel it is cheap and do not want to sell.
Therefore, the 2 extreme areas express an unfair price level, causing price to tend to want to turn back.
In a state of imbalance, among the three variables, PRICE is the variable that goes first to determine a potential equilibrium area. Acceptance or rejection of value depends on the other two variables, TIME and VOLUME.
After the price variable finds a new equilibrium area, the expression of value acceptance is:
- Price is held steady within a range (the time variable)
- Buyers and sellers begin to trade (the volume variable).
Applying auction theory to Wyckoff
Steidlmayer divided the market into four phases as follows:
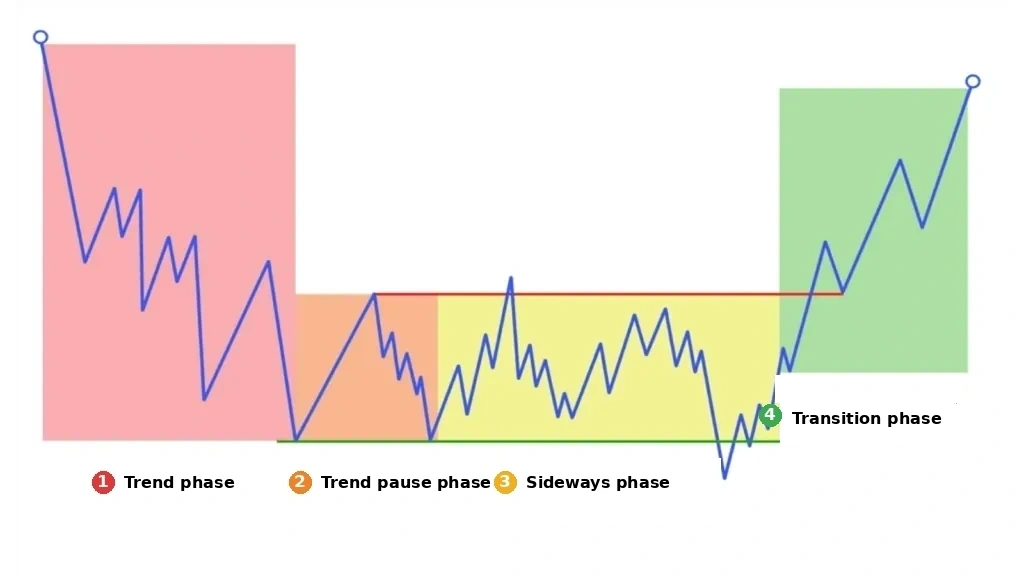 Figure 4: Four phases of the market
-
- Trend phase: Price is developing vertically, supply–demand is imbalanced.
-
- Trend-stopping phase: Traders on the opposite side appear and block the trend, forming the upper and lower edges of the trading range.
-
- Sideways phase: Price develops horizontally, fluctuating in the newly formed equilibrium area.
-
- Transition phase: Price moves outside the equilibrium area and goes to find a new value area.
When phase 4 ends, the market is again at the starting position of a new structure.
This repeats without interruption, on every timeframe.
Steidlmayer's four phases correspond to Wyckoff's 5-phase structure.
Wyckoff was a person who went deep into technical analysis with the same ideas as Auction Market theories, even though he did not know these concepts.
He divided the structure into 5 phases from A to E as follows:
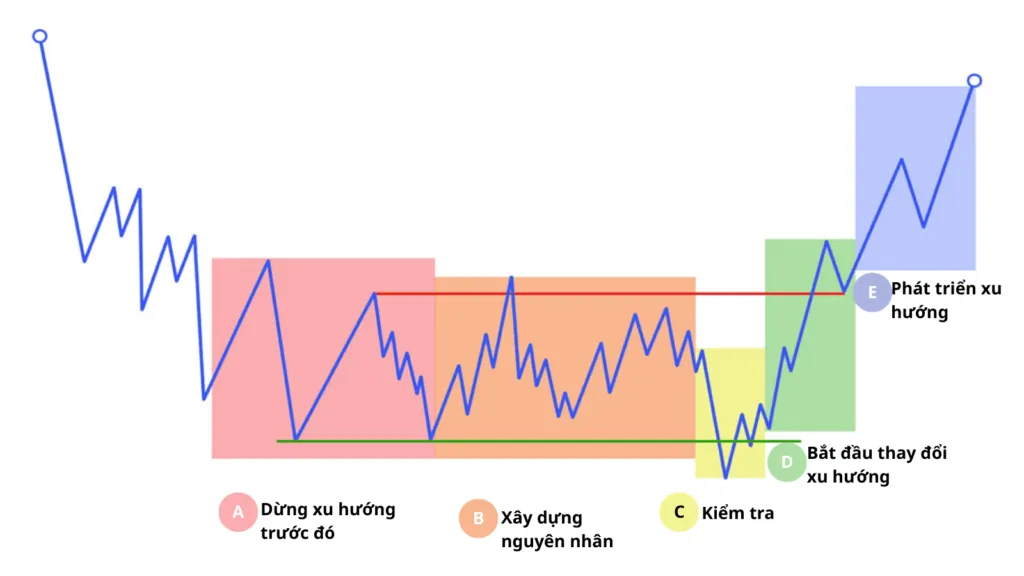 Figure 5: Dividing the 5 Wyckoff phases
- Phase |A|: Stopping the previous trend.
- Phase |B|: Building cause.
- Phase |C|: Test.
- Phase |D|: Beginning to change the trend.
- Phase |E|: Trend development.
From the following parts, we will go deep into these five phases together with Wyckoff's structures.
Auction theory and the three Wyckoff laws will be an important foundation that any investor following the Wyckoff methodology is required to master.
5/5 - (1 vote)
Read structure 10x faster with JUKA
JUKA maps SMC structure — swings, BOS, CHoCH and inducement zones — automatically on any TradingView chart. No more hand-drawing structure for hours.
Get JUKA — $150