Wyckoff Part 8: Summary of 7 Common Distribution Patterns
A visual Wyckoff chart is worth a thousand words. In this part, we will continue discussing the Distribution phase and its forms.
I do not encourage you to go deep into the variant patterns, because they are hard to detect, and in essence they are simply combinations of conventional patterns joined together.
We only need to master the two Conventional Distribution forms: the distribution structure with UTAD and without UTAD.
The importance of context
Wyckoff schematics, whether accumulation or distribution, are like a map.
They tell you the position you should go to and how to get there.
Wyckoff structures provide you with contexts (Context).
Each phase in the distribution phase shows the change in price behavior (CHoB) from beginning to end.
As a Wyckoff technical analyst, you can grasp the important moment when the CO participates (based on the three Wyckoff laws and auction theory).
You know how the CO stops the uptrend, then distributes inventory into the hands of the public until that process ends and price enters a downtrend.
All of this is shown in the five phases contained within the TR range that we studied in part 7.
However, price does not always follow such a beautiful TR.
The distribution structure has shapes where price does not lie neatly inside a Trading Range; let us discuss the different shapes in the section below.
Wyckoff distribution patterns and variations
Distribution type 1: With UTAD
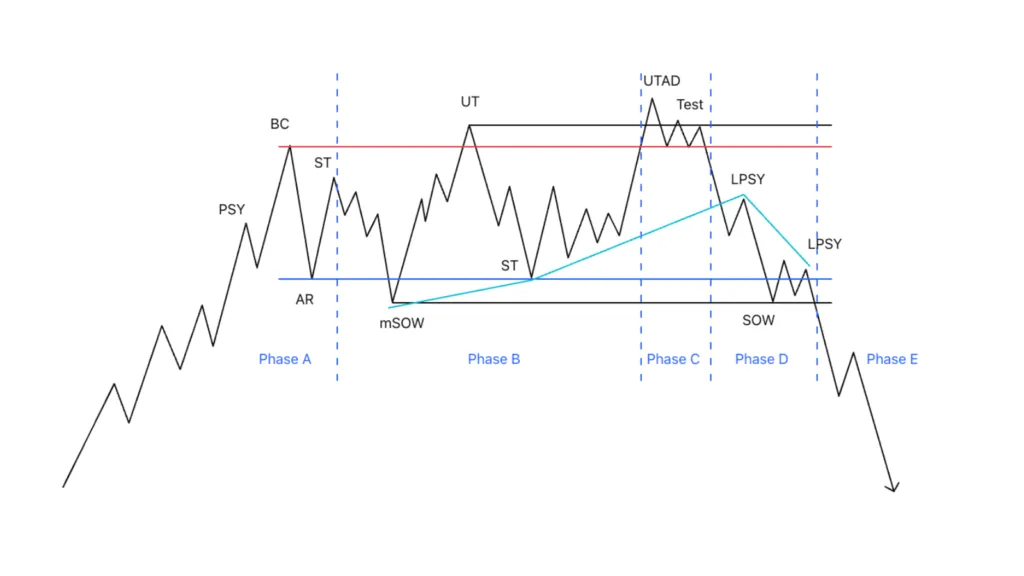 Figure 1: Conventional distribution form with UTAD
This is a common Distribution form, in which UTAD appears as the highest point in the TR.
After UTAD, price quickly breaks through The Ice and retests LPSY on small volume, which is a suitable position-opening point.
Example of a distribution pattern with UTAD in the SEI/USDT pair on the H1 timeframe:
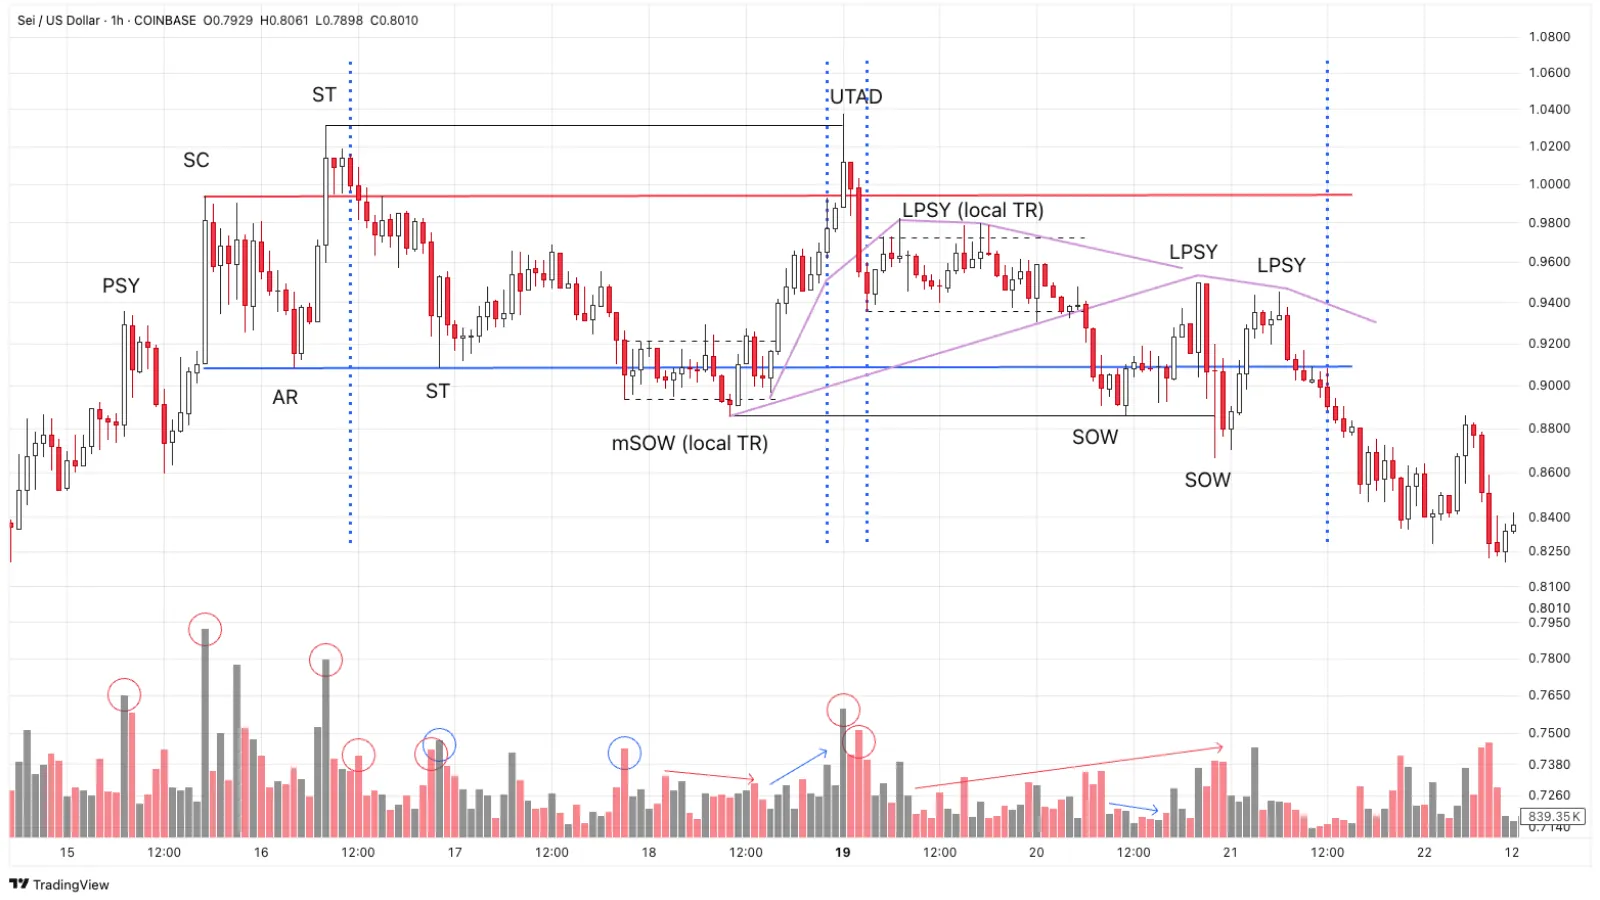 Figure 2: SEI/USDT distribution structure
- In phase A, we see large distribution pressure at the TR highs such as BC and ST, shown by high volume.
- Moving to phase B, there is strong demand supporting price at ST but no follow-through buying, causing price to fall and break through the lower boundary creating mSOW.
- mSOW is a local accumulation TR with gradually decreasing supply because the CO is re-absorbing supply from the public here.
- After the small accumulation phase, price easily rises into phase C and breaks through the highest high of the TR, which is UTAD.
- The UTAD candle has a long wick and large volume, showing the CO actively and strongly distributing the supply absorbed from the local TR below.
- Moving to phase D, price creates a local re-distribution TR with many wicks at the upper boundary, proving there is active selling pressure not allowing price to recover.
- Price falls beyond the lower boundary (SOW) with gradually increasing volume, showing the CO is continuing to distribute while demand has been exhausted.
- We can easily draw The Ice lines after price punches through with a long-bodied candle.
- Good entry positions are the LPSYs (which are also tests of the local re-distribution TR).
In the example above, at the mSOW position we can carry an accumulation bias and mark this as a potential phase C, but afterward at the UTAD position we completely reverse the bias to distribution. The flexibility to change bias between accumulation and distribution is essential for a Wyckoffian.
Distribution type 2: Without UTAD
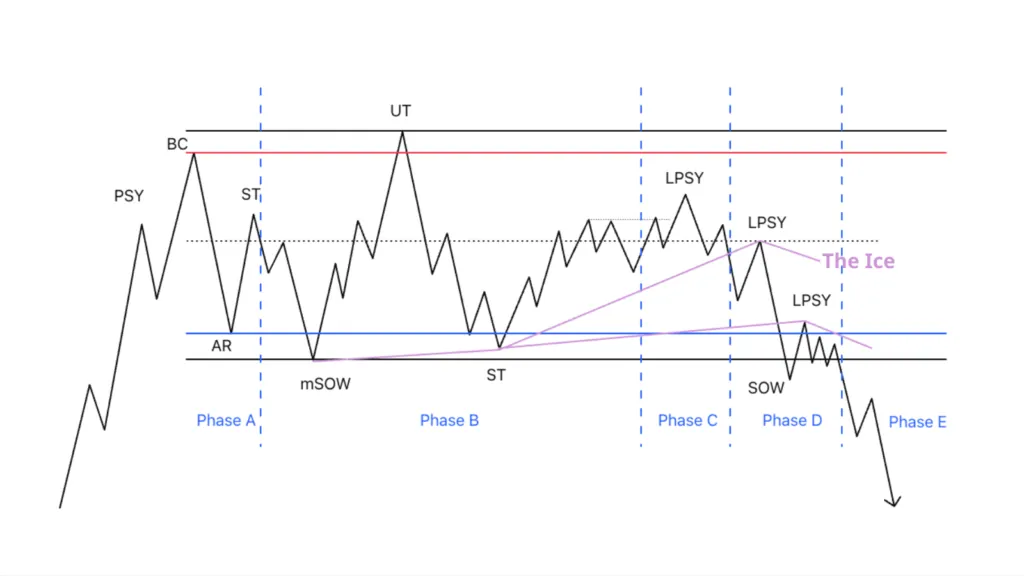 Figure 3: Distribution form without UTAD
This is a common distribution form, however it is hard to recognize phase C because price always has the potential to create a UTAD at any time.
Example of a Distribution without UTAD form in the EUR/USD currency pair:
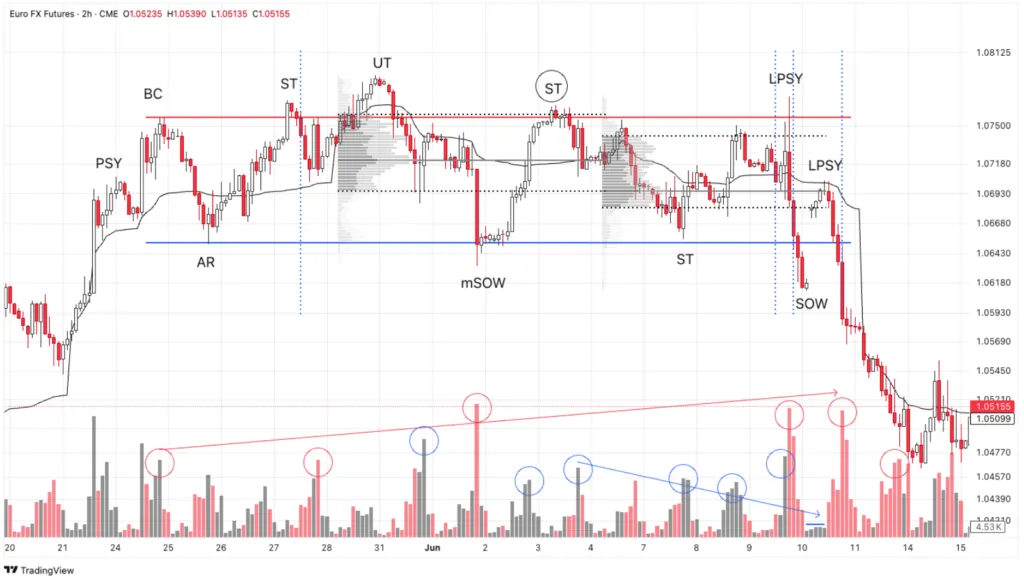 Figure 4: Euro distribution structure
- Selling volume gradually increases and buying volume gradually decreases throughout the TR formation process, showing supply gradually dominating demand.
- The circled ST position is very easy to mistake for phase C, however observing that demand volume afterward is still large, we need to observe more.
- Only when an LPSY appears, breaking through the ST high and going down with a red candle with a long pulled wick, do we mark this as a potential phase C.
- After that, price breaks down through the lower boundary of the TR with strongly increasing volume, then retests at the phase D LPSY position on exhausted volume. Only now are buyers truly exhausted.
- This LPSY position is in confluence with the previous day's VAL + today's POC + weekly VWAP, suggesting a short-selling point with a high win rate.
Note: with forex pairs we should use the CME exchange's futures codes to read volume instead of OANDA or FXCM exchanges. Refer to the FX codes on Trading Hub 3.0's Telegram channel.
Variation type 1: The pine tree model
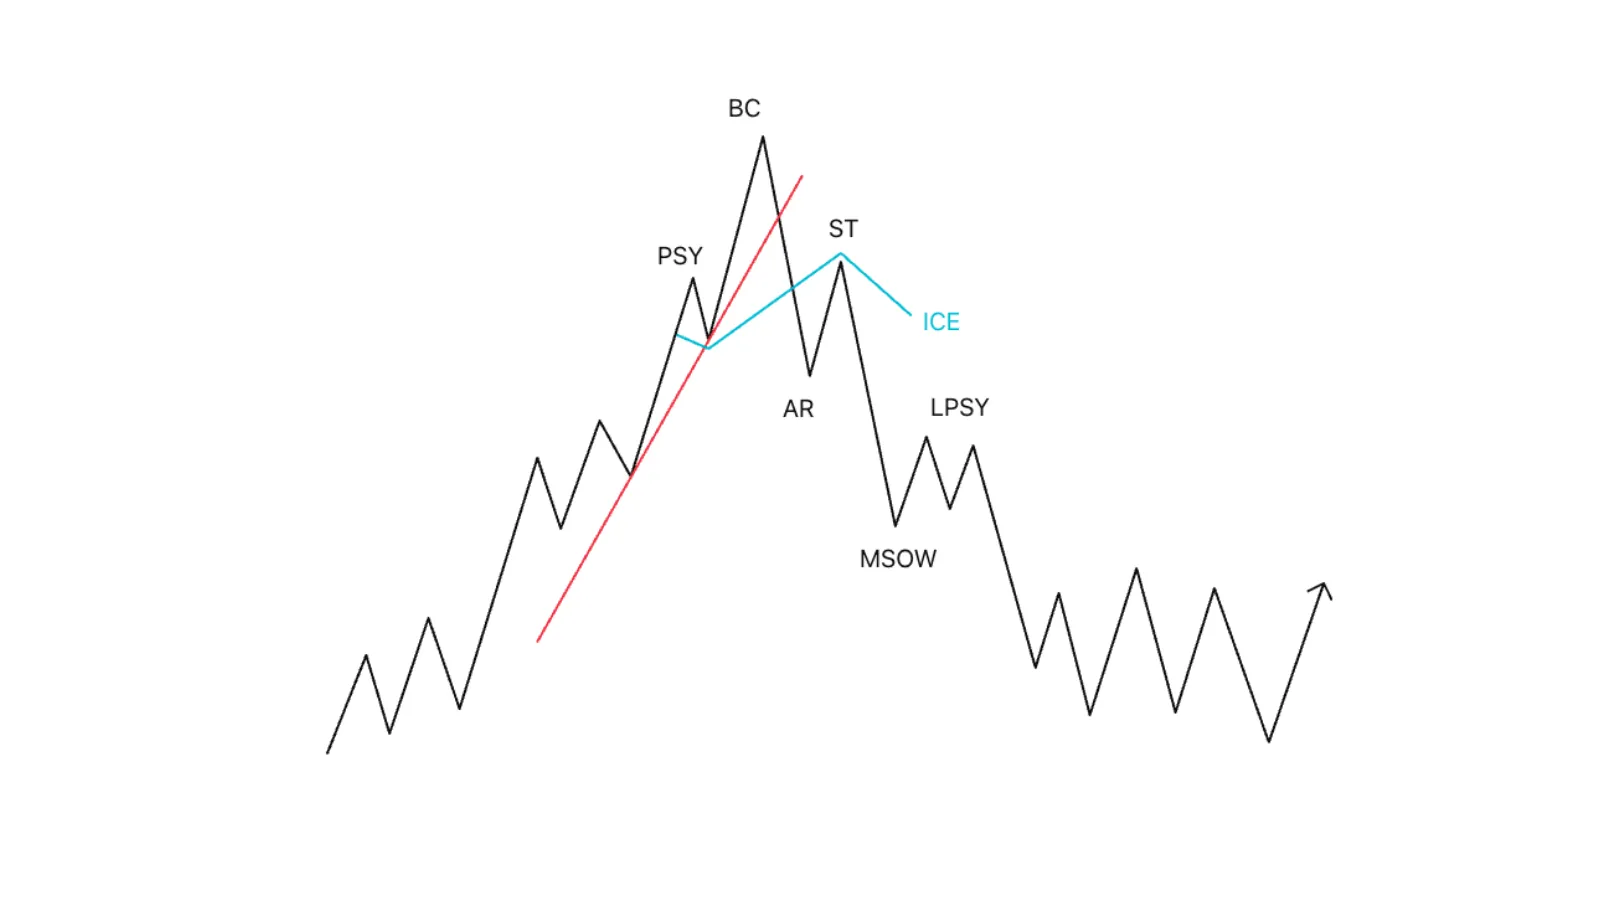 Figure 5: Hypodermic distribution structure
This model is called Hypodermic by Wyckoff (the pine tree model or needle model).
At the end of an uptrend, price is often maintained or attempts to recover through a series of "anesthetic injections".
These are artificial stimuli, shown by pushing price and trading volume up high.
However, afterward the market quickly falls back again.
The Hypodermic variation can make an uptrend nearly stall yet still persist for a longer time, as if clinging to the market with "artificial life".
When the goal is nearly achieved, the market falls into a "Teepee" distribution state (a pointed pyramid shape) or forms a steeply sloping downtrend with lower highs before collapsing quickly.
The CO sold most of their inventory at the pyramid, causing phase A to often have large volume, but afterward volume gradually decreases until phase D because the CO stands aside. By phase E, ITFs (institutional trend-following funds) only then begin to sell, causing volume to rise high.
Example of a Hypodermic distribution model in the EUR/USD pair:
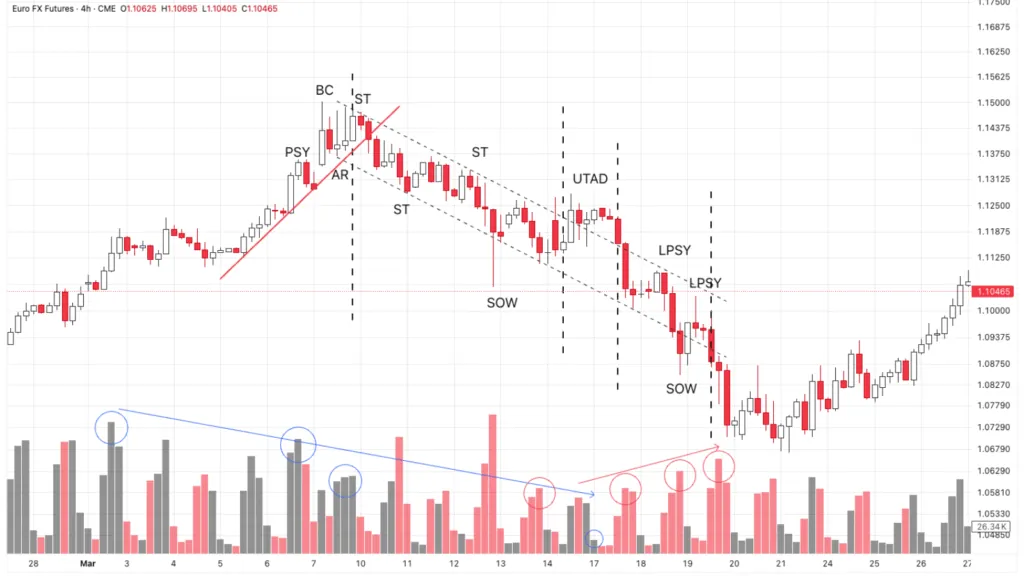 Figure 6: Hypodermic needle model in the EUR/USD pair
- Volume gradually decreases from phase A to phase D.
- Volume gradually increases from phase D to phase E.
- Usually this shape will be a swing inside a much larger other TR.
Another example of the USD/CAD pair, a needle variation combined with a local re-distribution TR:
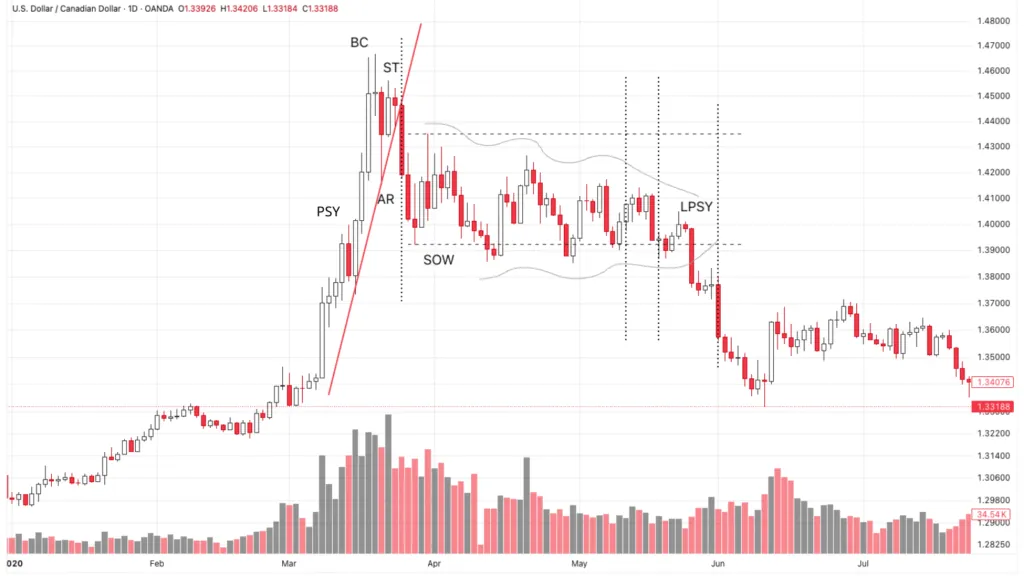 Figure 7: Pine tree distribution model USD/CAD
The Hypodermic model is quite common in forex and crypto but not easy to detect and trade.
Variation type 2: The double top model
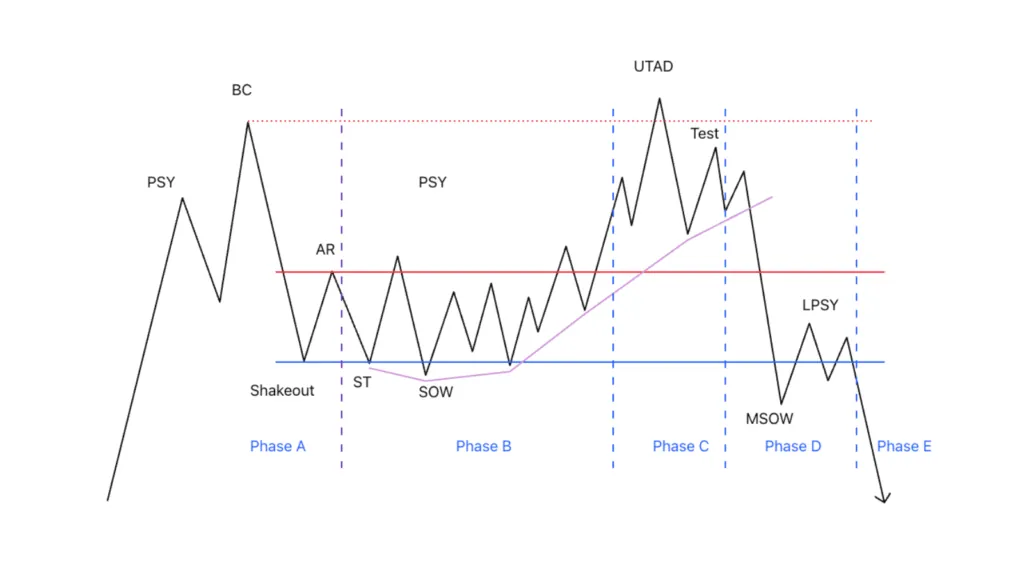 Figure 8: Double top distribution variation
The double top model is a familiar reversal pattern, also called the cat-ears model.
Price fails to rise after escaping the accumulation zone and quickly falls after buyers are exhausted.
Example of the BTC/USDT pair, double top model:
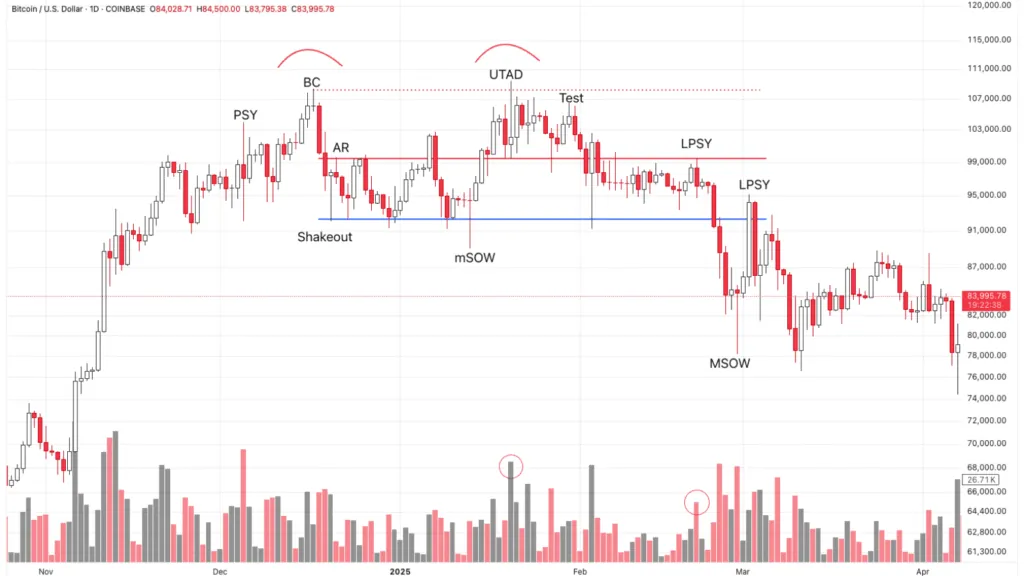 Figure 9: Bitcoin double top distribution model
- At the mSOW position is the local spring of the local TR.
- Price quickly rises and breaks out of the range but quickly becomes exhausted because sellers overwhelm and push price down on large volume.
- After getting back inside the TR, low volume shows weak buying support.
- The LPSY position at the upper boundary has high volume showing strong distribution by sellers pushing price down out of the TR.
Variation type 3: The head and shoulders pattern
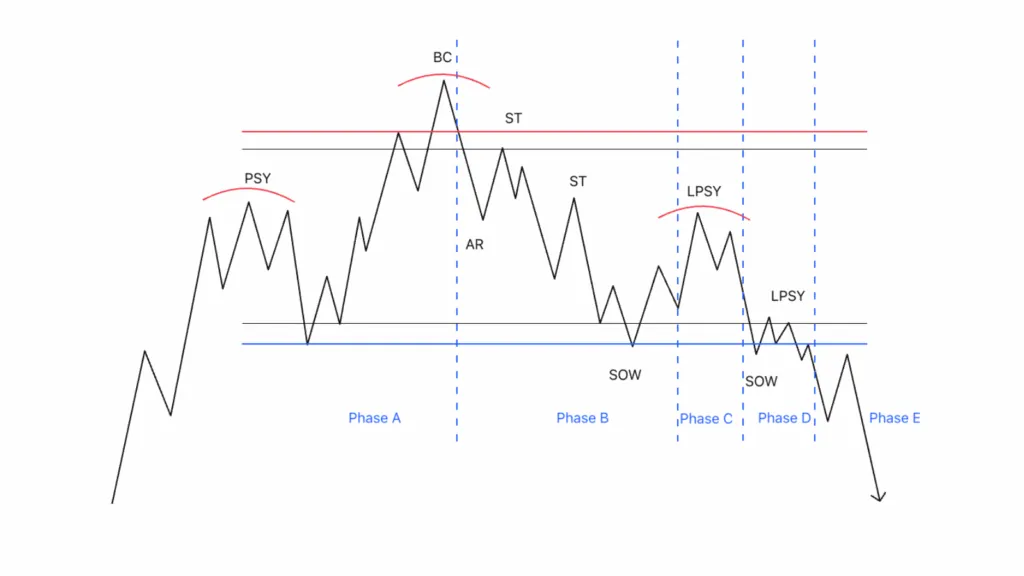 Figure 10: Head and shoulders distribution model
Head and shoulders (head and shoulders) is a common reversal pattern.
Not only head and shoulders, most reversal shapes we have learned in trading can be explained by the Wyckoff distribution structure.
Example of the PYTH/USDT pair with a head and shoulders distribution form:
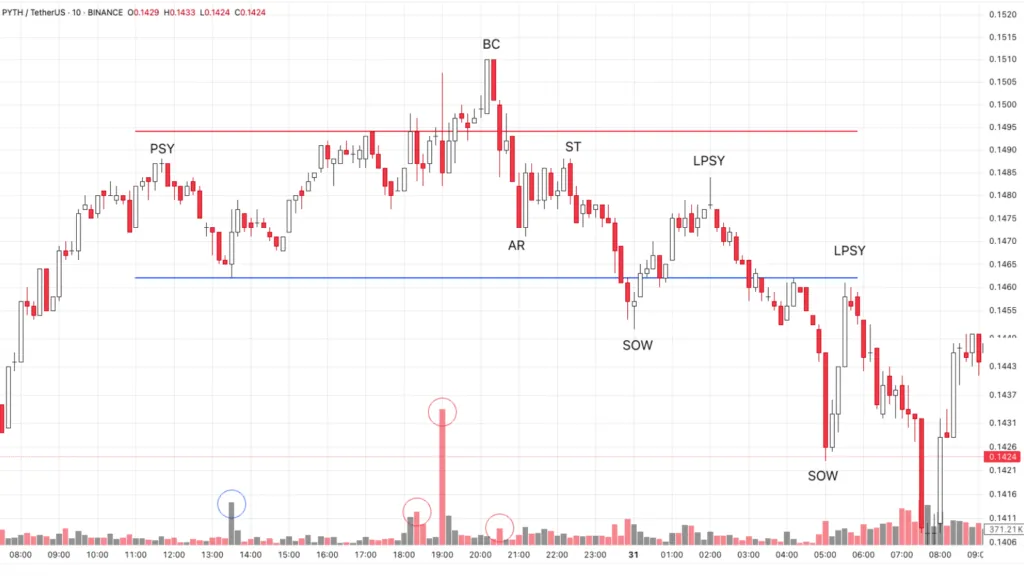 Figure 11: Head and shoulders distribution model PYTH/USD
- The highest volume column in the TR is selling volume at the high.
- After the selling volume, not much active buying appears at the lower boundary area.
- As always, the appropriate trading time lies at LPSY events.
With the Pyth chart, we can also draw a conventional TR with this variation form, but it will be hard to recognize in the early stage.
Variation type 4: The rising wedge model
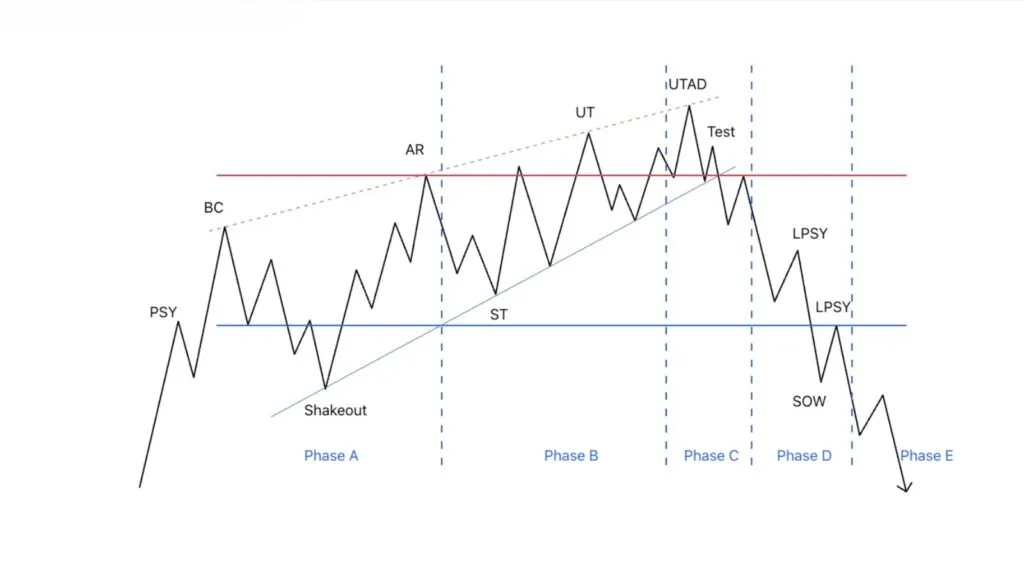 Figure 12: Rising wedge distribution model
Price rises neatly inside a rising wedge, formed by two converging lines (an along-trend demand line and a reversed supply line).
The shakeout at the end of the wedge causes buyers to become exhausted and price quickly falls with large range and volume.
Example of a rising wedge distribution form in the AUD/USD forex pair:
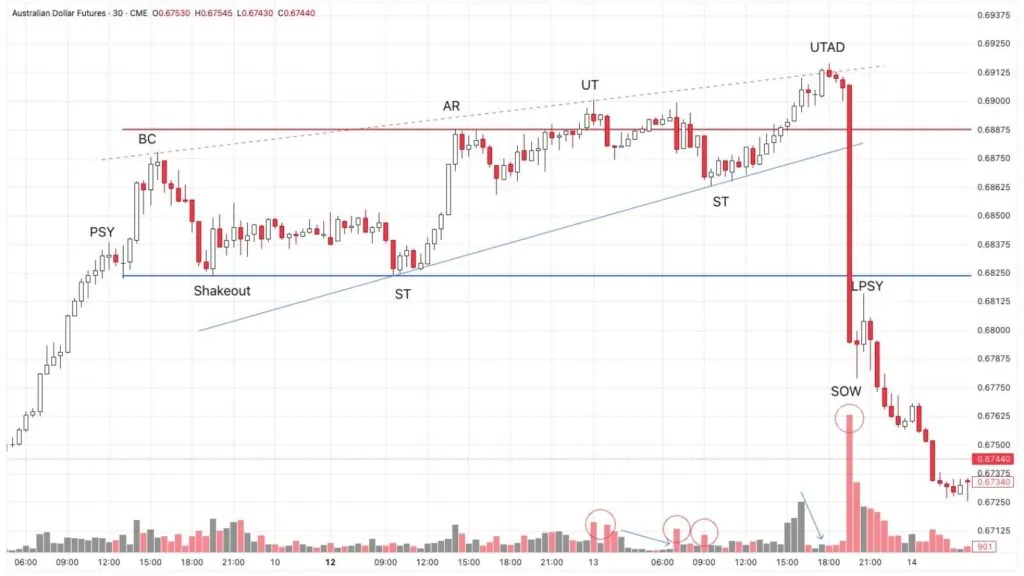 Figure 13: Wyckoff distribution structure variation: rising wedge
- Price is in an uptrend and lies neatly inside two converging lines (a triangle shape or a rising wedge).
- At the high positions of the wedge, selling volume is high and buying demand is absent.
- Demand appears, pushing price up to the UTAD position and quickly becomes exhausted afterward, shown by very small volume.
- When buyers are exhausted, the CO distributes the remaining inventory, causing price to fall sharply.
- In this example we see it is very hard to open a sell position due to the sudden fall in price.
Once again, I do not encourage readers to try to draw Wyckoff distribution variation shapes.
The variant patterns are in essence pieced together from conventional distribution structures.
5/5 - (2 votes)
Read structure 10x faster with JUKA
JUKA maps SMC structure — swings, BOS, CHoCH and inducement zones — automatically on any TradingView chart. No more hand-drawing structure for hours.
Get JUKA — $150