Wyckoff Part 10: What Is Volume Profile? Applications of Volume Profile in Trading
This article will help readers understand the meaning and use of the powerful tool Volume Profile (VP) and its applications.
According to the law of supply and demand, we know price tends to go from one supply-demand equilibrium zone to another supply-demand equilibrium zone.
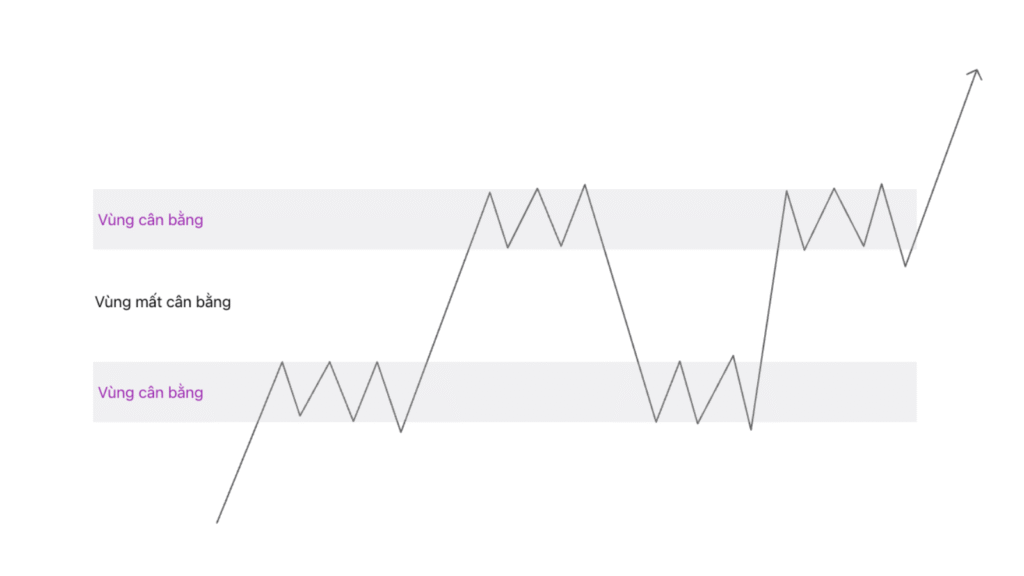 Figure 1: Equilibrium zones and imbalance zones
These equilibrium zones are where the most trading volume is concentrated because, according to auction theory, this is the area where buyers and sellers feel comfortable bidding against each other.
What is Volume Profile?
Volume Profile is a tool that measures trader interest at each specific price level based on trading volume.
Volume Profile is a variation of Market Profile, built on the three variables of auction theory: Price, Time, Volume.
Thus we will have two forms of volume:
- Volume at time, which is vertical volume measuring the volume of each candle, telling us the level of trader interest at specific points in time (Tells us when).
- Horizontal volume profile will measure the volume of each price level, showing which price levels traders are most interested in (Tells us where).
The structure of Volume Profile
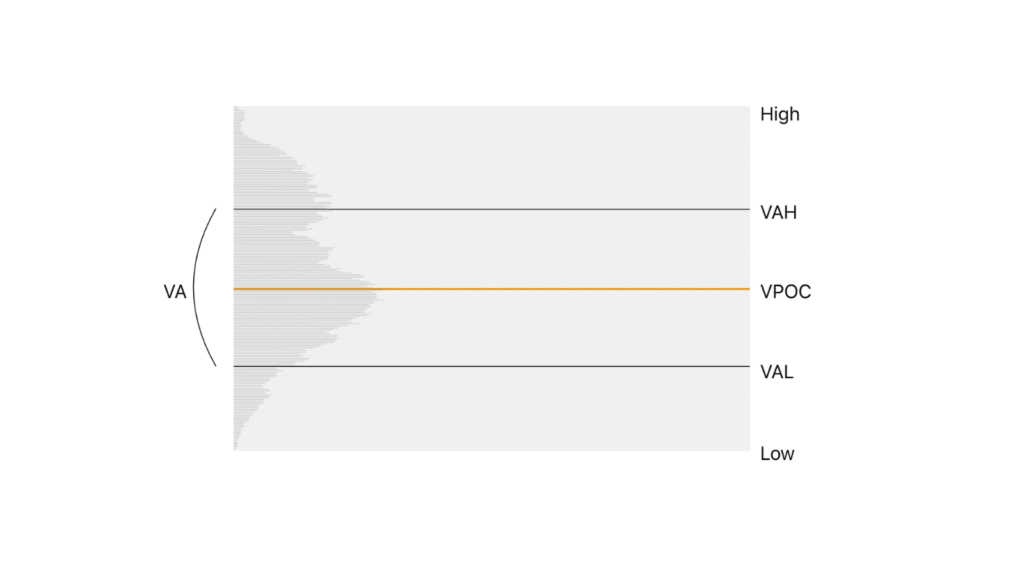 Figure 2: The structure of Volume Profile
The components that make up Volume Profile are shown in the table below:
| Component | Explanation |
|---|---|
| VA | Value Area |
| VAH | Value Area High |
| VAL | Value Area Low |
| High | The upper extreme point of Volume Profile |
| Low | The lower extreme point of Volume Profile |
| VPOC | Volume Point of Control - The fair price level |
| HVN | High Volume Node |
| LVN | Low Volume Node |
VA (Value Area)
VA — the value area is the price zone traded the most, or where supply and demand are most balanced. VA represents 68.2% of the total trading volume of the entire Volume Profile.
VA is determined as the zone between VAH and VAL.
The zone outside VA will account for the remaining 31.8% of the total trading volume of the entire Volume Profile.
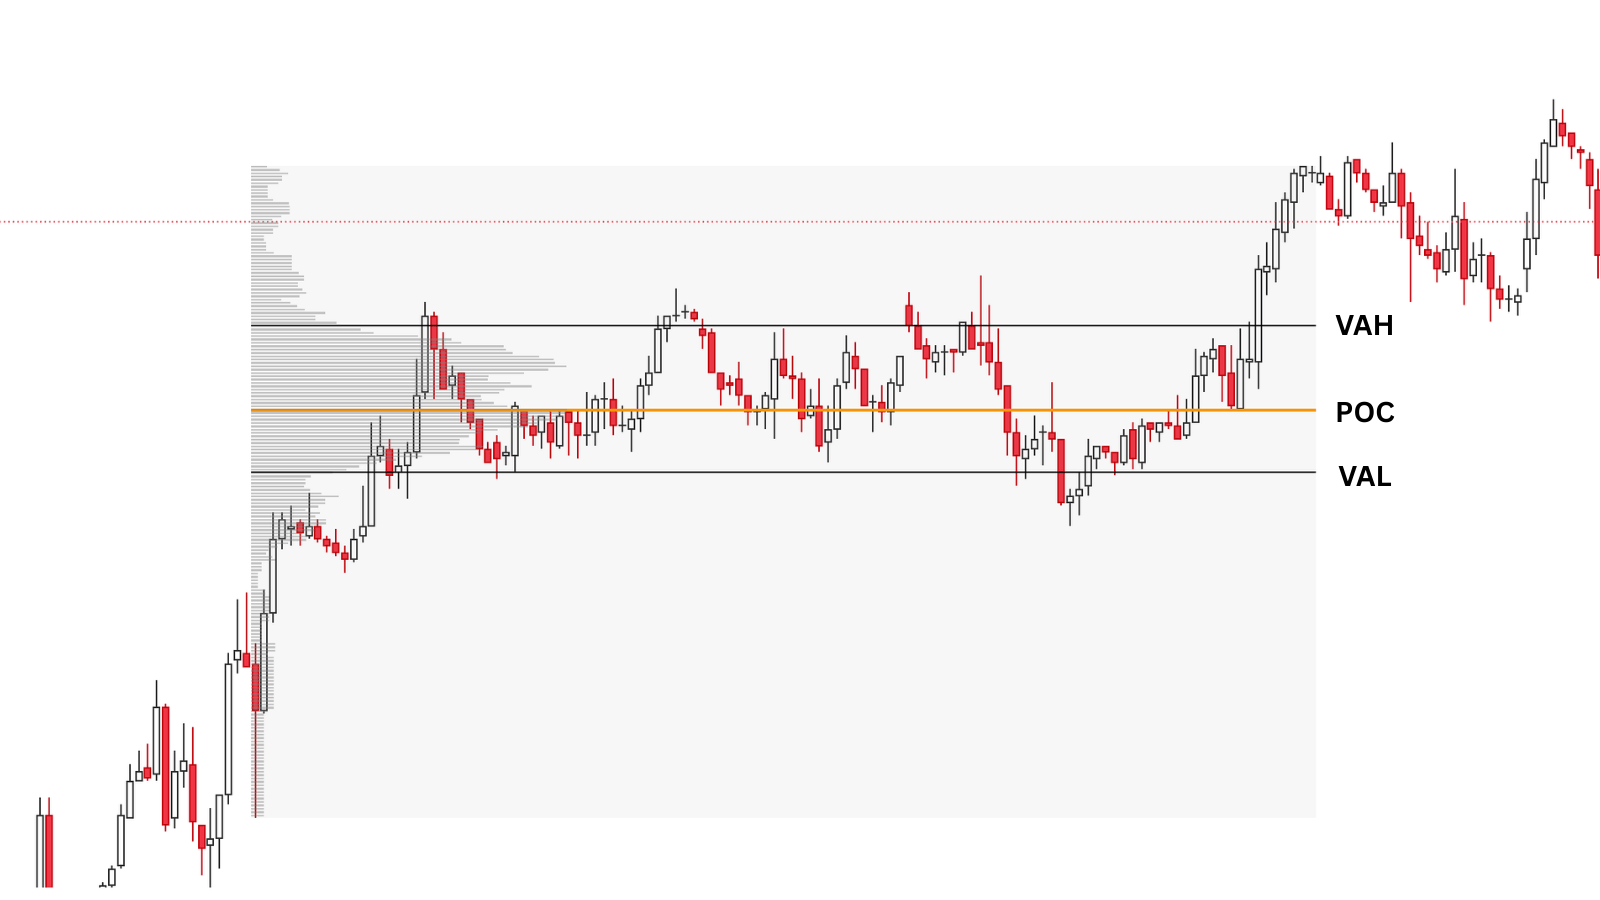 Figure 3: Value Area of Volume Profile
In figure 3 we have a wide Volume Profile zone, in which the value area of this VP lies between VAH and VAL. This is the price zone concentrating 68.2% of the trading volume of the entire VP.
We see price fluctuating in this value area; VAH and VAL act as resistance and support zones for price.
VPOC (Volume Point of Control)
VPOC or POC is the most balanced price level in a VA. This is where buyers and sellers accept the most.
If price moves above POC it proves the buying side is in control, and conversely, if price lies below POC then the selling side is in control.
POC is where the most trading volume is concentrated, so when price escapes the VA zone it will likely return to retest POC before continuing the uptrend.
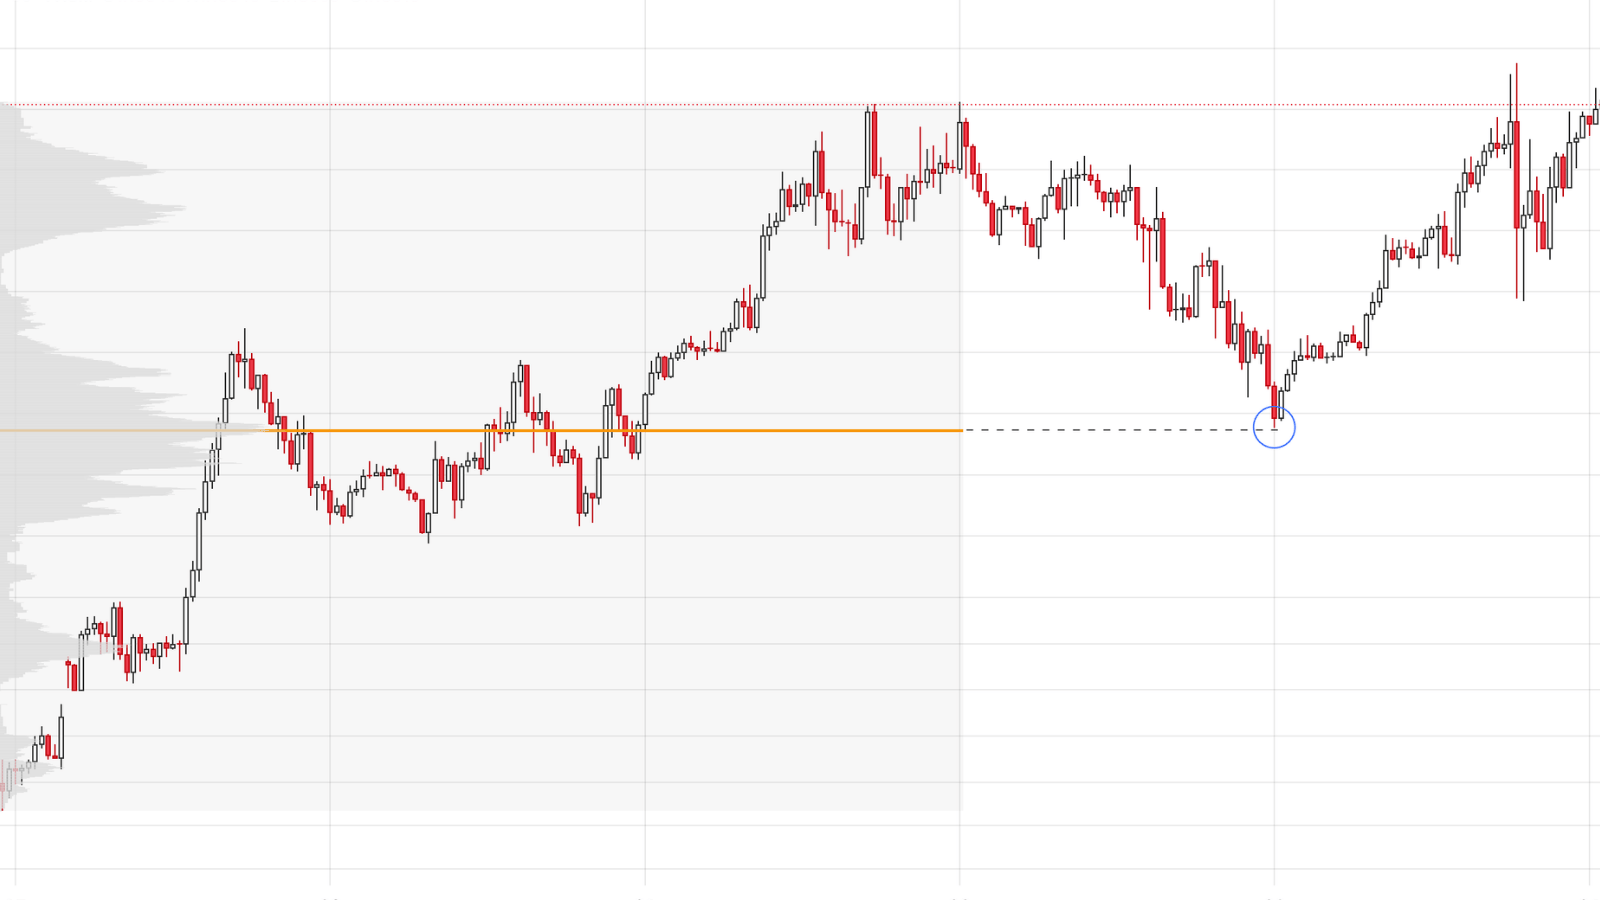 Figure 4: Price meeting POC and reversing
Figure 4 shows that in an uptrend, price returns to find a VA zone and reverses when it meets the POC of that VA zone.
HVN (High Volume Node)
HVN is a short-term equilibrium zone, shown as a protruding zone in the volume profile.
This is where buyers and sellers feel satisfied trading, so volume is concentrated mainly in these areas.
Each HVN can be considered a small VA zone and has a POC inside it.
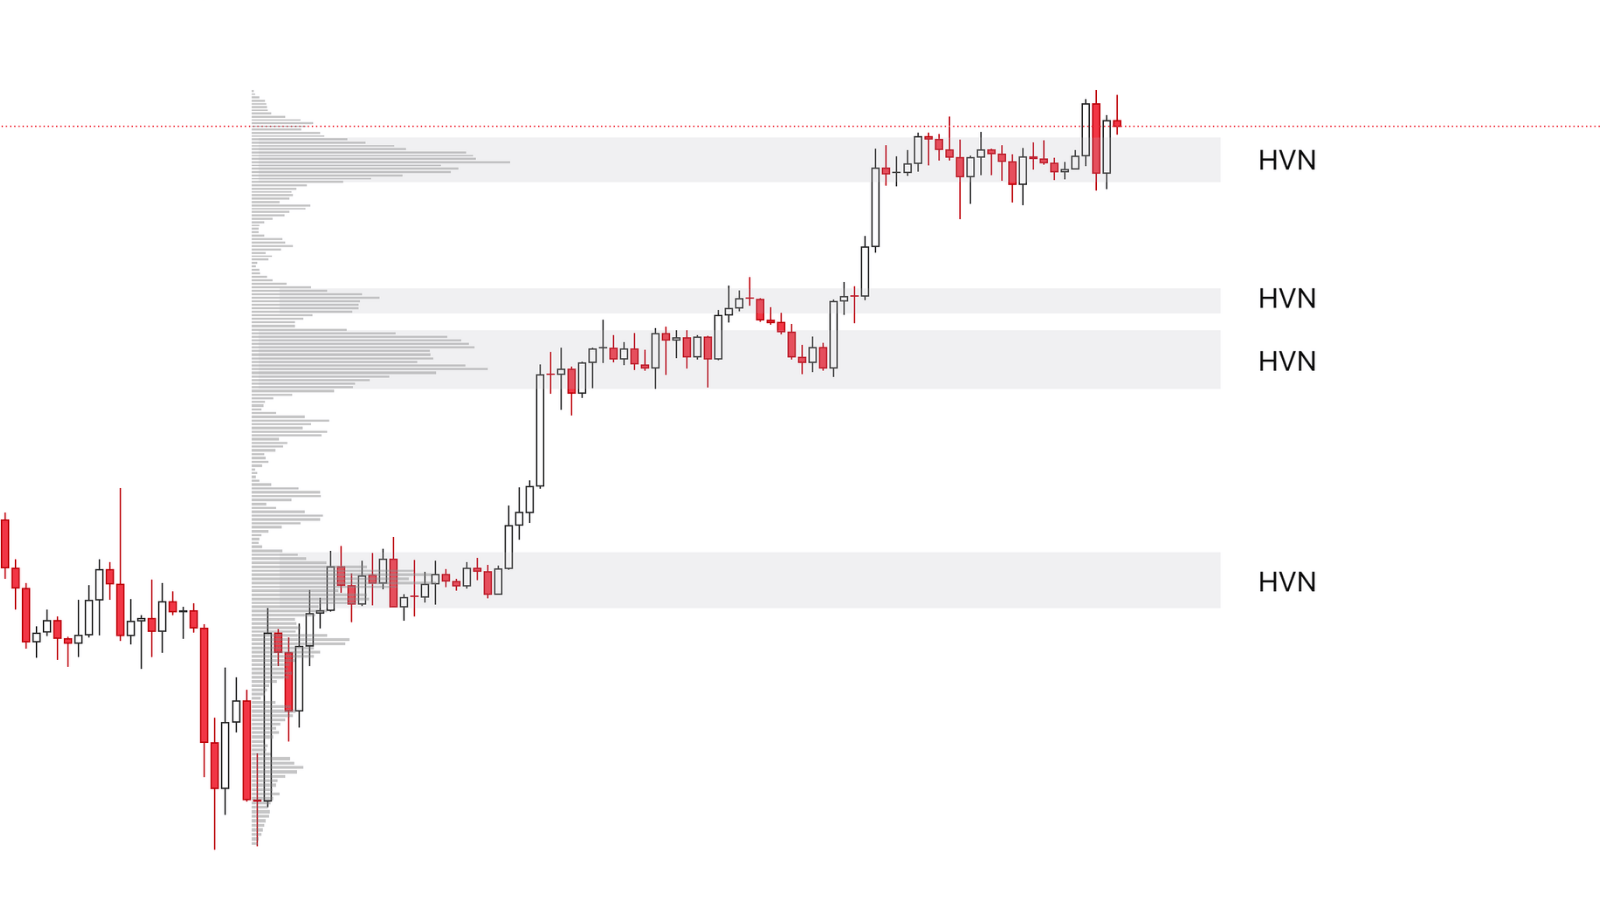 Figure 5: High Volume Node in Volume Profile
Figure 5 shows HVNs on the Bitcoin chart, which are places where buyers and sellers comfortably accept bidding; here price often goes sideways or creates a pullback.
HVN is where there is consensus between buyers and sellers, so in the future price may return to reach consensus again in this zone.
→ We can consider HVN like a "price magnet".
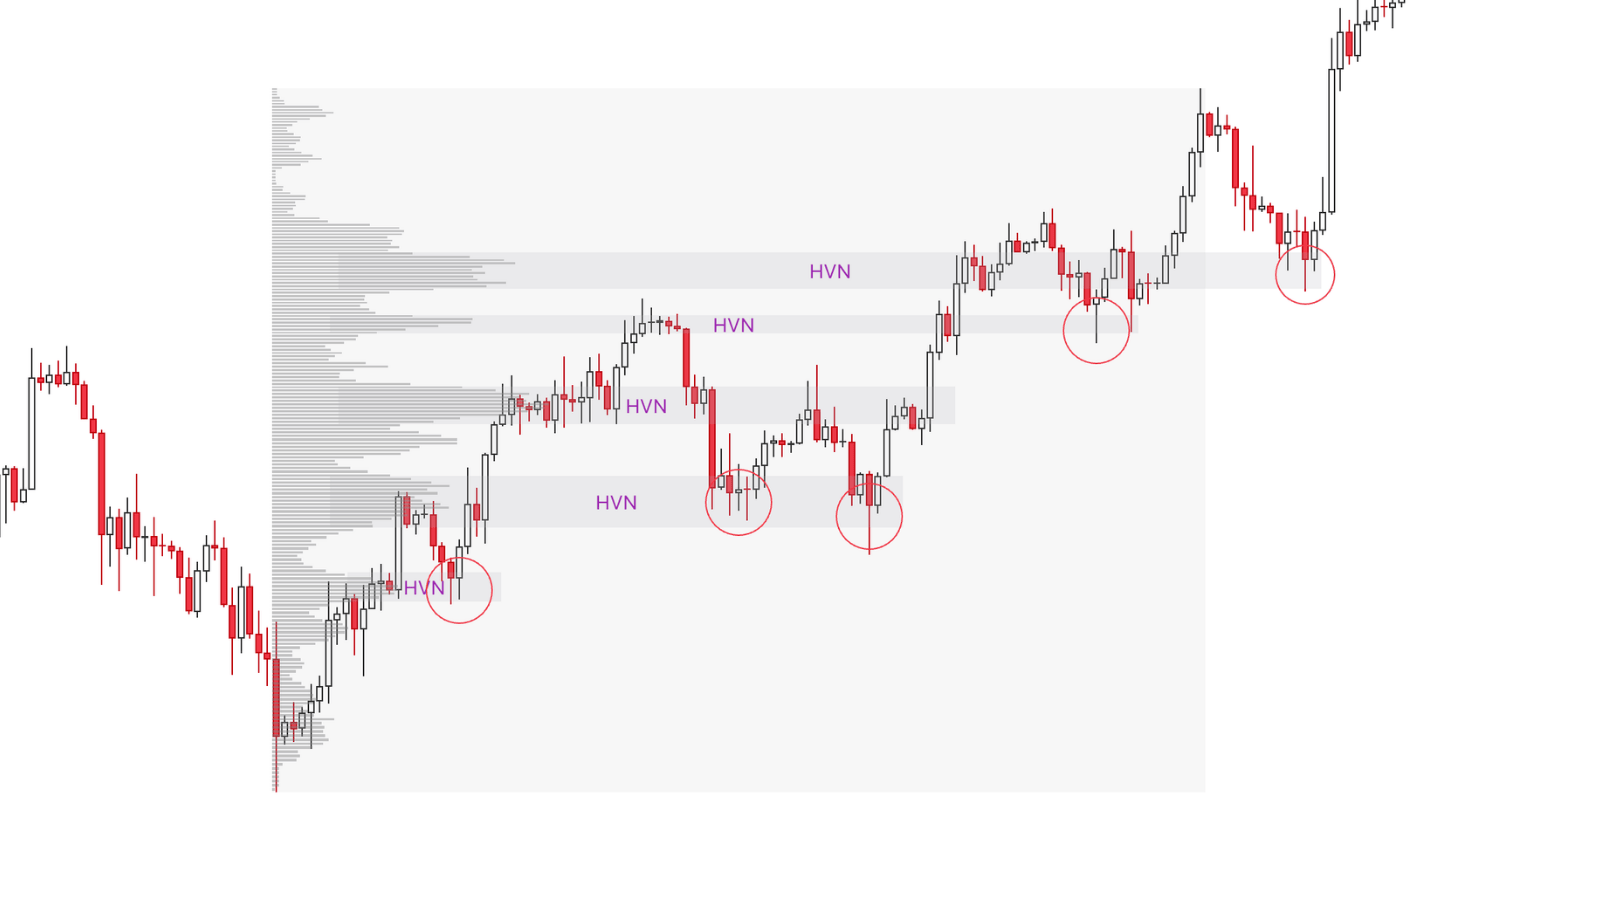 Figure 6: HVN acting like a magnet attracting price
Figure 6 shows HVNs acting like a magnet; price tends to return to the nearest HVNs in a pullback before continuing the previous trend.
LVN (Low Volume Node)
LVN is a supply-demand imbalance zone, shown as an indented zone in the volume profile.
This is where buyers and sellers are not comfortable trading, so horizontal volume is small (a trough).
LVN can be considered unfair price zones.
They do not receive consensus from both the buying and selling sides, so in the future price is also expected not to have consensus there, causing rejection.
Rejection can be shown by price moving quickly through this area, or price reversing as soon as it meets this area.
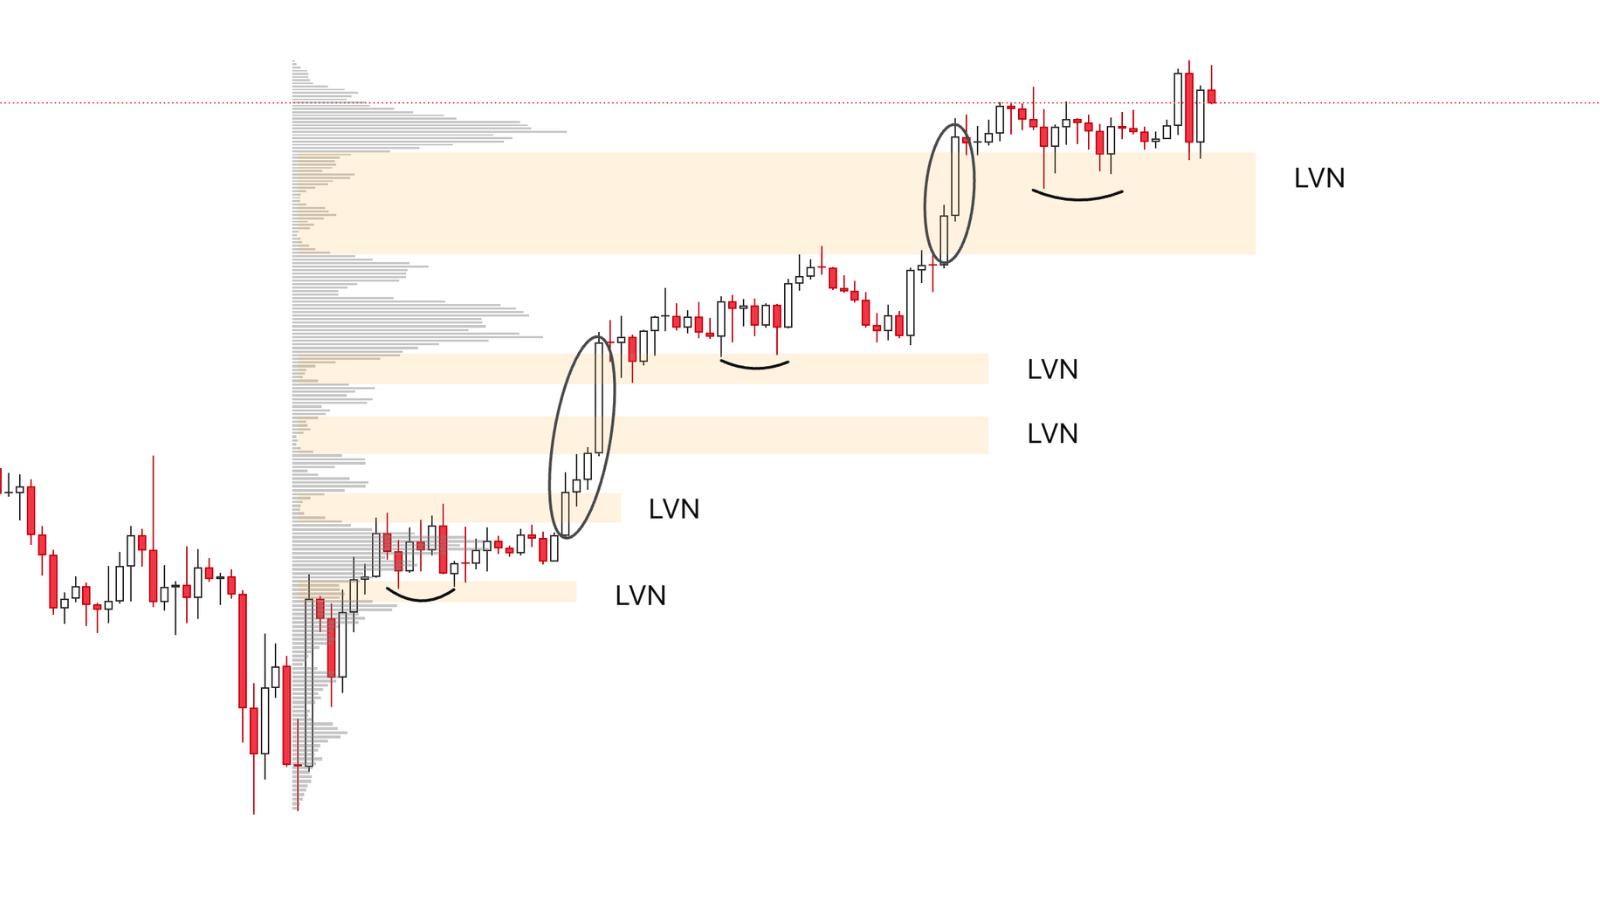 Figure 7: Low Volume Node in Volume Profile
Looking again at the Bitcoin chart, we see LVNs act in two ways: pushing price through or rejecting it.
In a clear trend, when price is pushed strongly up it creates an imbalance zone, an LVN; in the future price will tend to reject this LVN zone.
In short, price "hates" LVNs and "likes" HVNs. HVNs and LVNs lie alternating with each other.
The SMC method, which was separated from Wyckoff, calls LVN IMB/FVG.
A volume profile has only one VA but can have many HVNs and LVNs. We can flexibly use HVNs and LVNs as entries or take profits.
Types of Volume Profile
Session Volume Profile
Session Volume Profile is a form of volume profile showing the balance level by session, each session corresponding to one day.
This form of volume profile is useful if you are an intraday trader.
Because today's trading session is still developing, we will mainly use the volume profile of the previous day's session.
When price is going in a clear trend, the POC, VAH and VAL levels are places to observe to open positions.
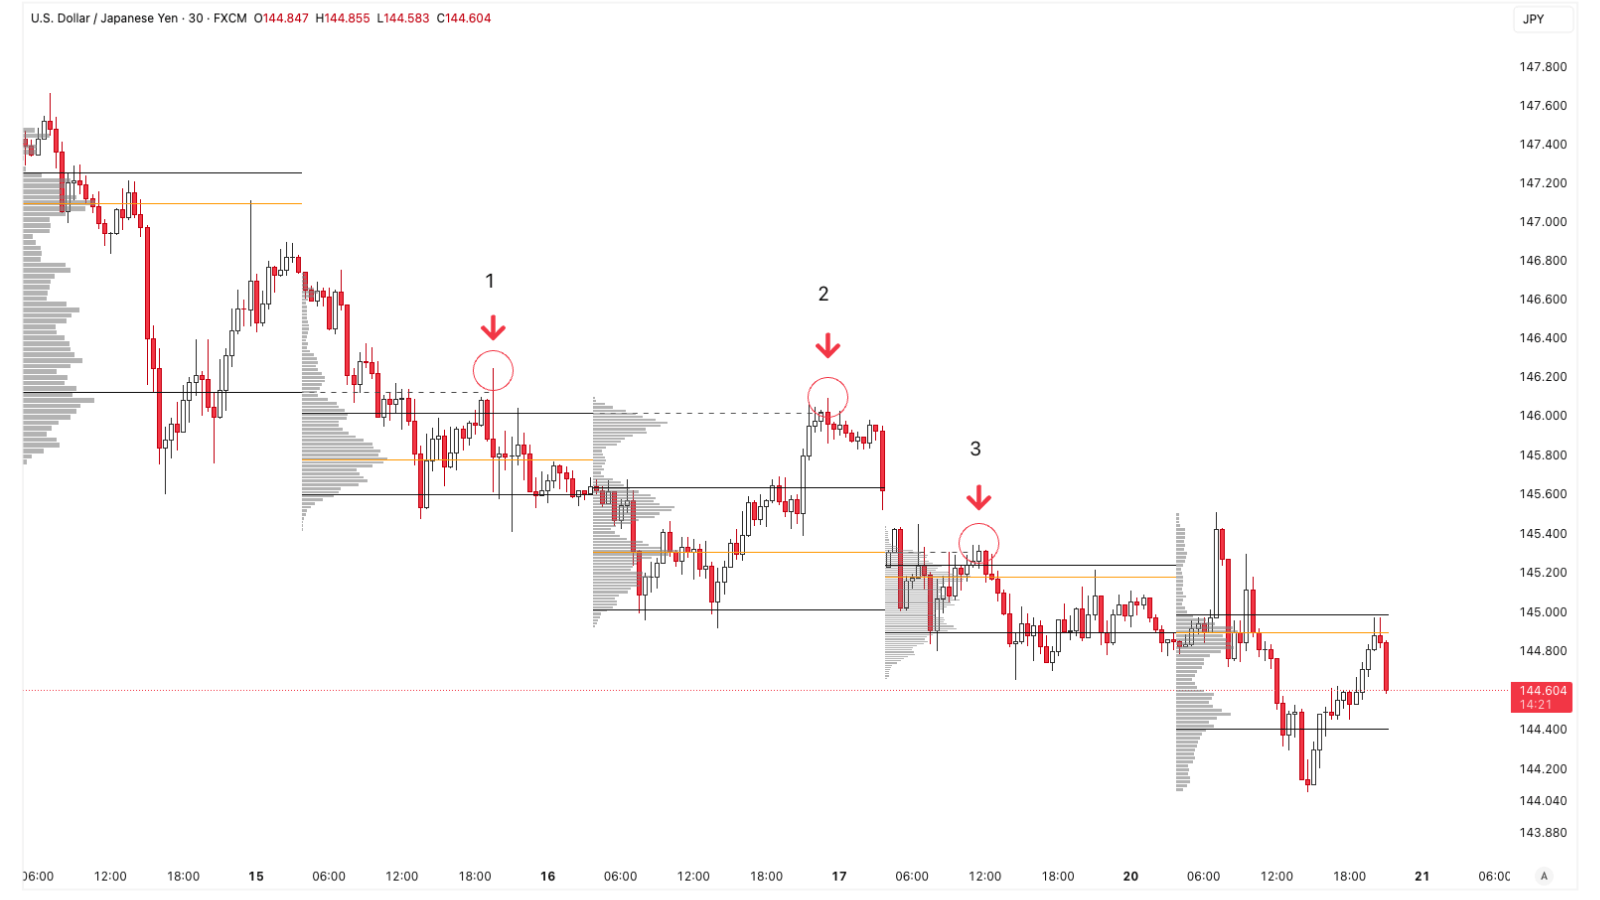 Figure 8: Session Volume Profile in the USDJPY pair
In the example in the figure, a clear downtrend is forming:
- Position 1: price pulls back to the VAL of the previous session's VP.
- Position 2: price pulls back to the VAH of the previous session's VP.
- Position 3: price pulls back to the POC of the previous session's VP.
With Session Volume Profile, we should apply the 80% rule, covered in part 11.
Fixed Range Volume Profile
This is a form of Volume with high flexibility; it can help traders check volume at any area by manually dragging by hand.
Fixed Range VP is often used when price is trending or when it fluctuates in an equilibrium range.
Example 1 of Fixed Range VP when there is a downtrend:
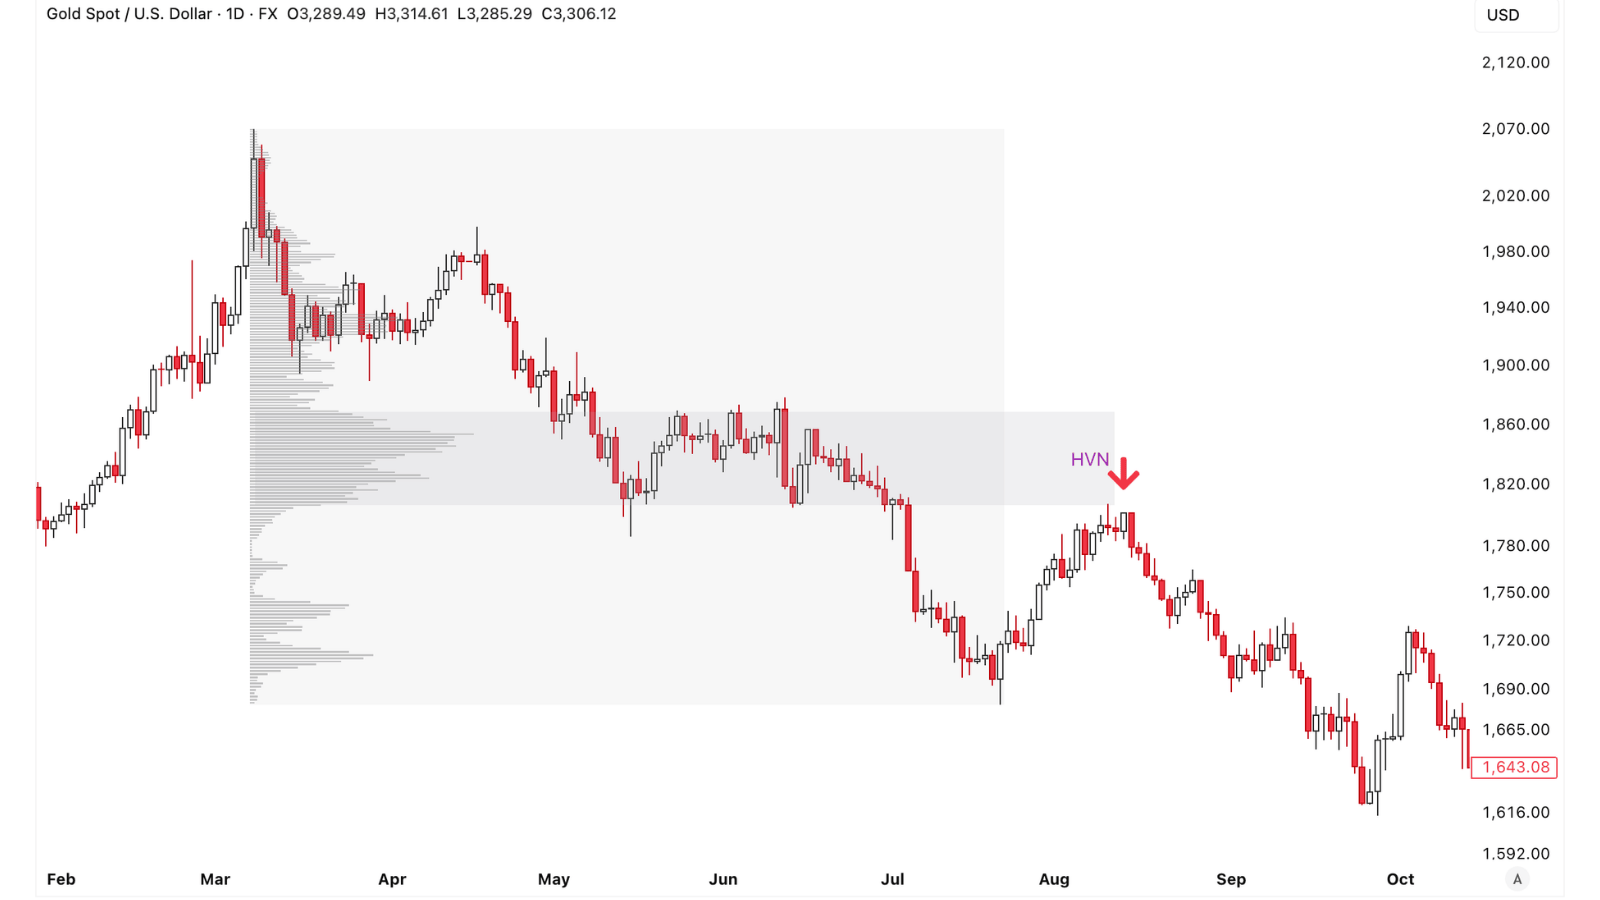 Figure 9: Fixed range volume profile XAU
- The market goes in a downtrend.
- Price pulls back to an HVN zone, which is a previous supply-demand equilibrium zone.
- Price then rejects this zone and continues the downtrend.
Example 2 when there is an uptrend:
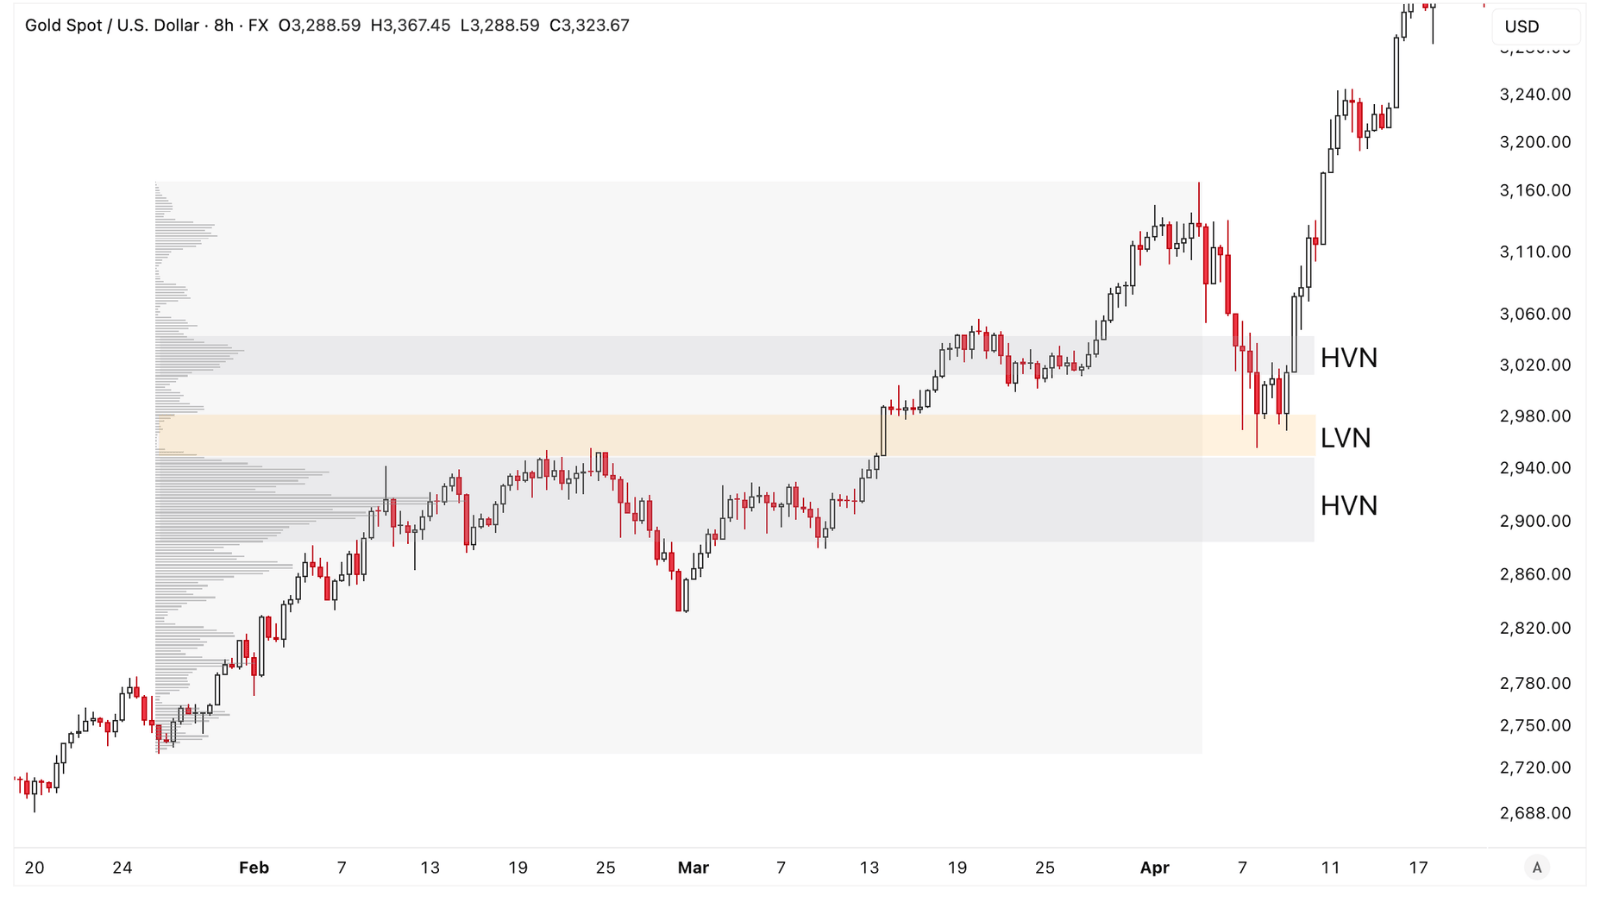 Figure 10: Fixed range VP XAU
- Gold goes in an uptrend.
- A corrective pullback rejects the first HVN zone by going through it.
- Price wants to find the larger HVN zone below, however it is blocked by the previous LVN zone and turns back.
Example 3 of Fixed Range VP when lying in an equilibrium zone:
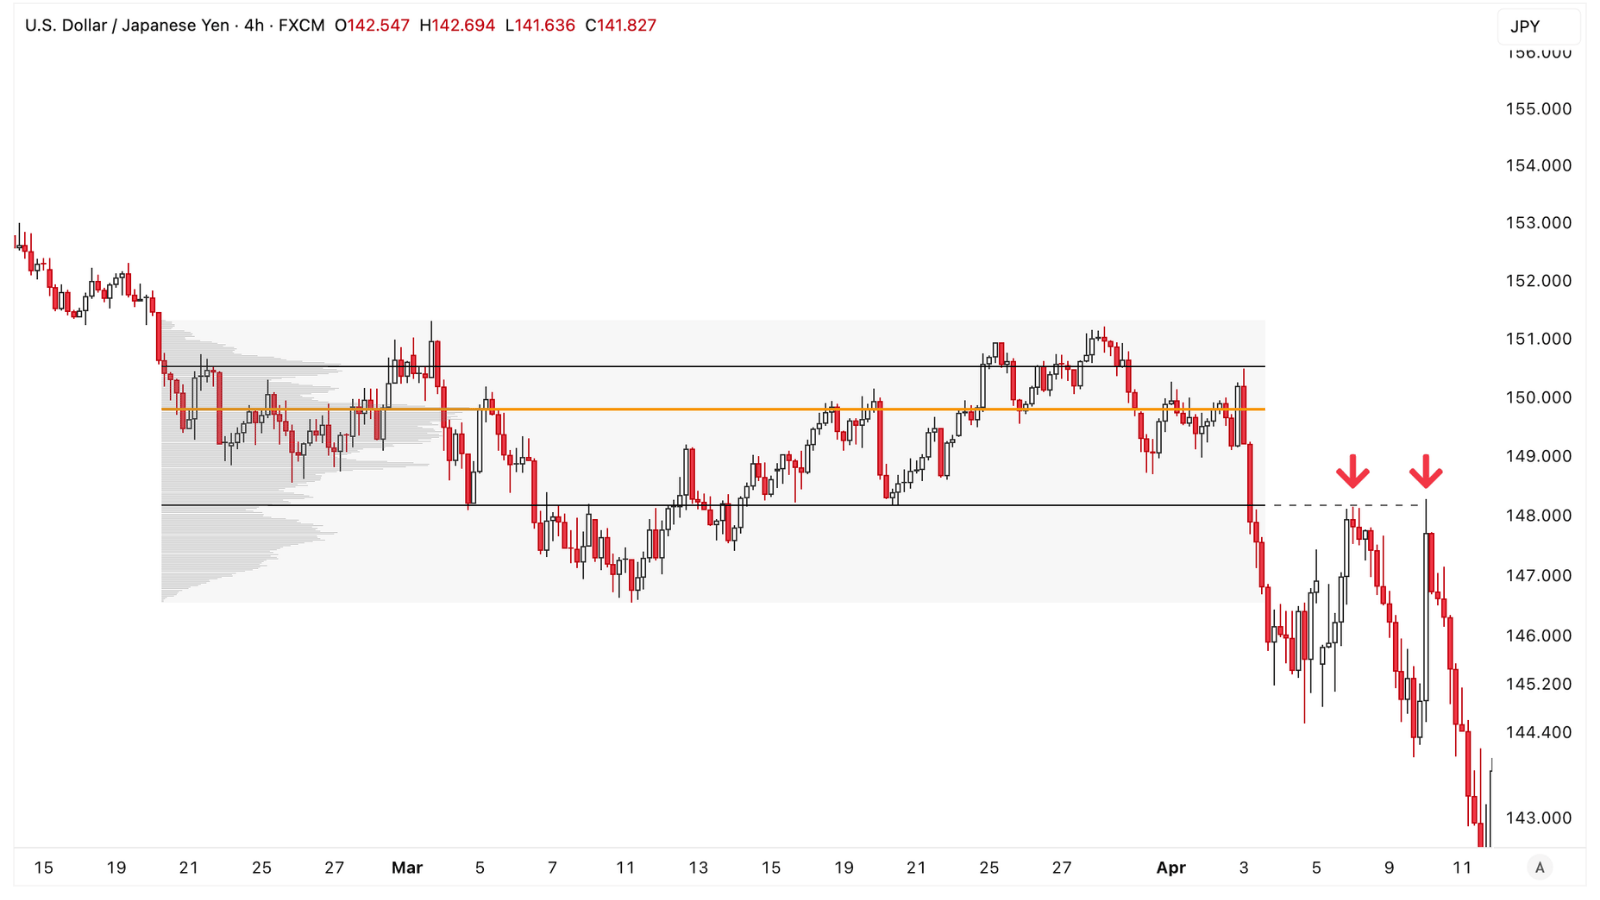 Figure 11: Fixed Range Volume Profile in an equilibrium zone
- Price of the USDJPY currency pair goes in a supply-demand equilibrium zone (seen as sideways).
- After that price becomes imbalanced and falls below.
- Price returns to test the equilibrium zone at the VAL position and is rejected, then continues falling.
Visible Range Volume Profile
This is a form of Volume Profile showing the entire volume of all price levels on the chart. You just drag the chart and volume will change accordingly.
With this form we will assess the overall context of the entire market without being disturbed in the short term.
Pay attention to HVNs/LVNs, which will be suitable places to open positions and take profit.
Example of Visible Range Volume Profile:
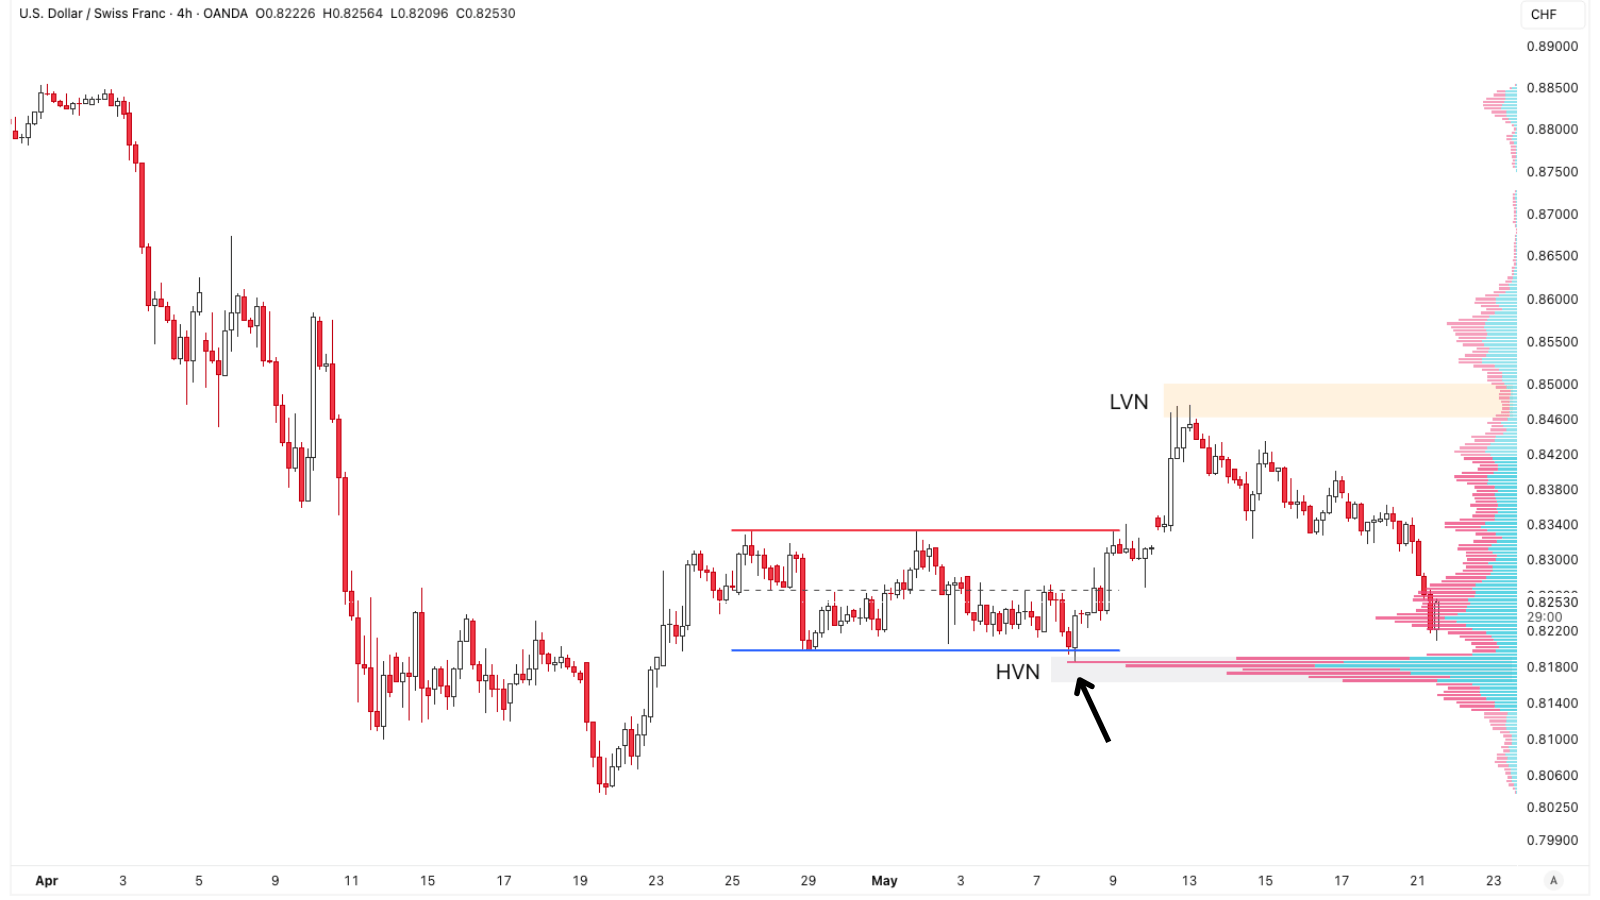 Figure 12: Mixed Volume Profile
- Observing a Wyckoff TR, we see a potential Spring event appear.
- At the Spring position, price rejects the HVN and returns into the range; open a buy position at the rejecting rising candle.
- Price rises, meets an LVN zone and is pushed back. This is a suitable take-profit place.
The example above shows that combining Volume Profile with Wyckoff is completely feasible.
Applications of Volume Profile
Volume Profile provides objective information for traders and fits the Wyckoff context.
Applications of Volume Profile in trading:
1. Identifying Wyckoff structures
The upper and lower boundaries of a Wyckoff structure will always be created by two LVN zones.
When price lies between two LVN zones it will continuously reject, turn back, and create resistance and support zones.
Until price exceeds an LVN, we will determine whether that structure is accumulation or distribution.
After that we wait for price to return to test at the VAH, VAL and POC positions.
In this way we do not even need to draw the two Wyckoff boundary lines.
Example of identifying structure in the USDJPY currency pair on the m30 timeframe:
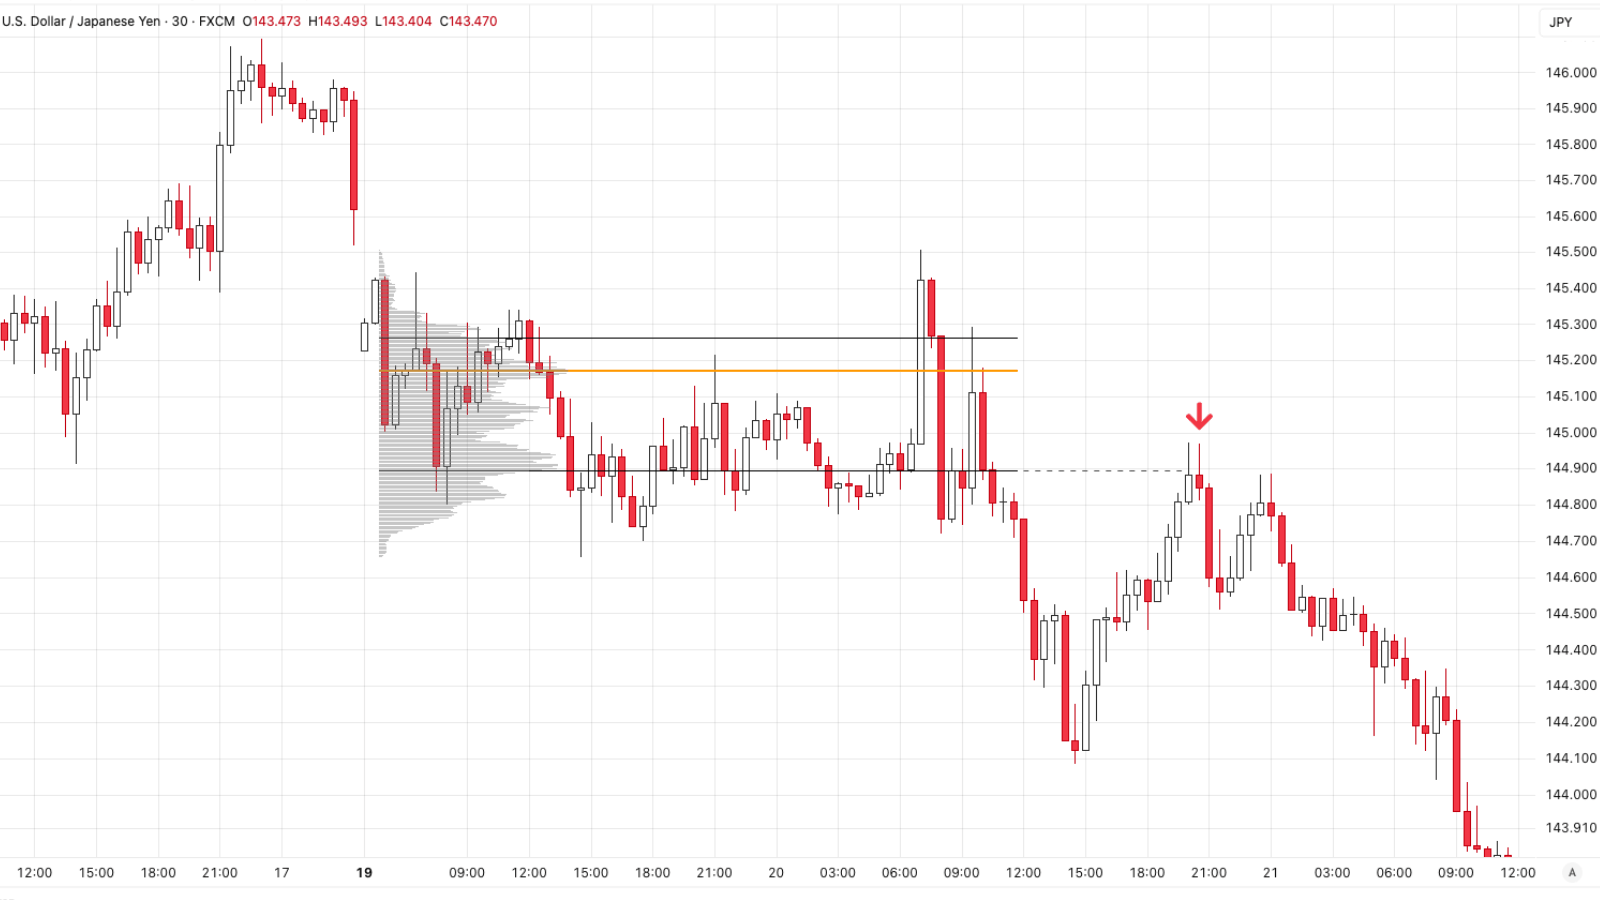 Figure 13: Using VP to identify structure
In the example above:
- Noticing price going sideways, we draw a Fixed Range VP covering this entire range.
- Price breaks down out of VA after a potential UTAD; we suspect this is a re-distribution structure.
- Price returns to test the VAL of the value area; this is a potential LPSY in Wyckoff, suggesting a short sell order.
2. Identifying market bias
We always prioritize trading in the direction of the uptrend of the last HVN zone created.
Recall the meaning of HVN: when price goes sideways in an HVN it means price is in a state of temporary supply-demand balance. Only after price breaks up or down out of the HVN do we have a next bias.
- When price lies above the nearest HVN zone, control lies with buyers; we have a bullish bias.
- And when price punches down through the nearest HVN zone, control lies with sellers; we change the bias to bearish after a confirmation (test phase).
Example of using VP to identify bias in the NZDUSD pair on the m15 timeframe:
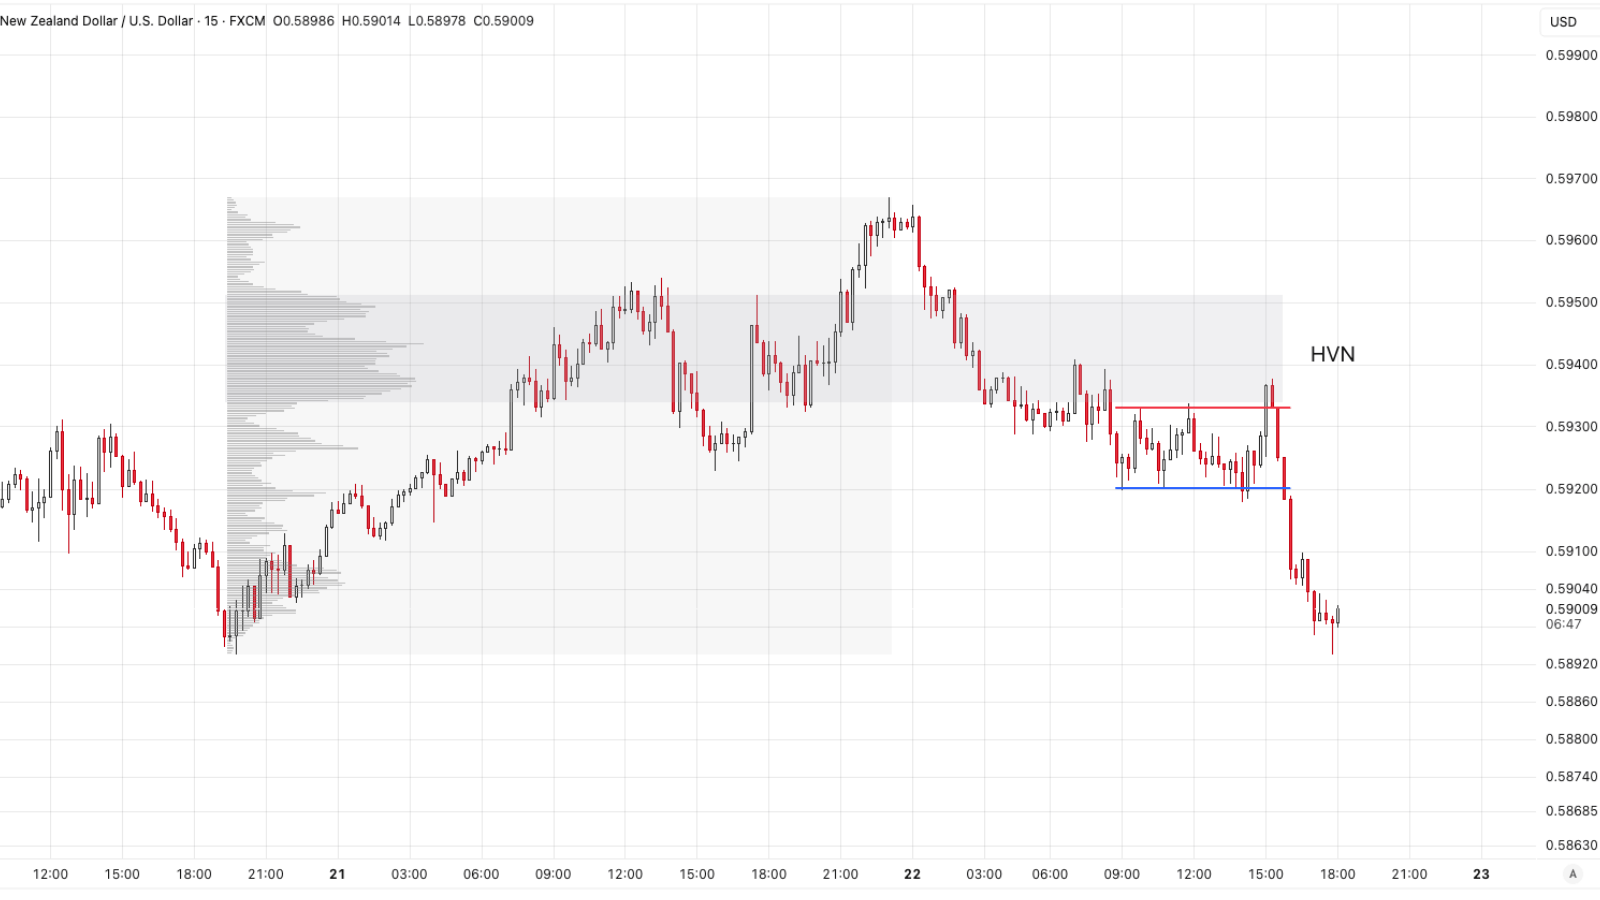 Figure 14: Identifying a bearish bias with Volume Profile
In figure 14:
- Price goes in an uptrend, leaving HVNs and LVNs. We will draw a Fixed Range VP from the low to the current high of the uptrend.
- Observing price moving down through the nearest HVN, the bias at this point is still bullish; the bearish bias is confirmed after price retests the HVN and is rejected to continue falling afterward.
- In this case, the phase retesting the HVN is the UTAD of a Wyckoff re-distribution structure.
Still with this example, we will draw a Fixed Range VP from the nearest high to low:
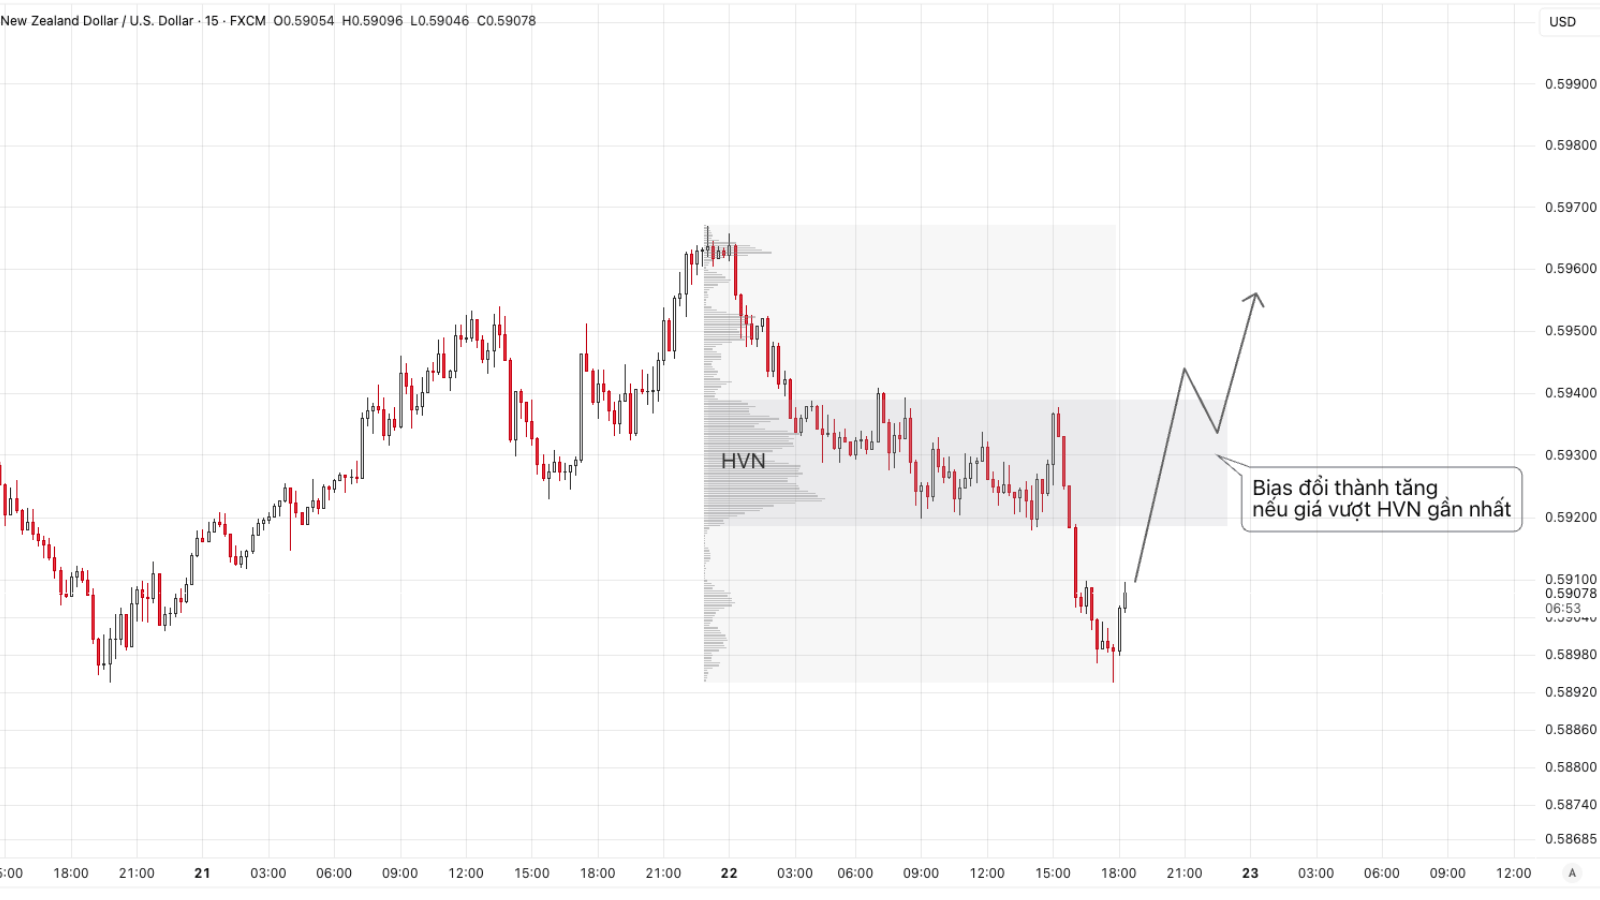 Figure 15: Identifying a reversal based on Volume Profile
- The bias at this point is still bearish.
- If price moves above the HVN and retests with successful rejection, we will change the bias to bullish.
- Note that we should not depend on this HVN, because the downtrend is still continuing.
- If price continues falling and creates another HVN below, we will determine the bias when price exceeds that HVN because that is the nearest HVN.
We will study in depth how to combine Volume Profile and Wyckoff in the next part.
5/5 - (2 votes)
Read structure 10x faster with JUKA
JUKA maps SMC structure — swings, BOS, CHoCH and inducement zones — automatically on any TradingView chart. No more hand-drawing structure for hours.
Get JUKA — $150