Wyckoff Part 11: Combining Volume Profile and VWAP to Find Entries
Volume Profile is a useful indicator of Auction Theory, and auction theory is similar to the Law of Supply and Demand, the most important law of Wyckoff.
In the previous part we learned about Volume Profile and its applications. This part will go deeper into how to use VP combined with the Wyckoff method.
Trading principles with the VA value area
The 80% rule
This is a rule in Market Profile and is also applied to Volume Profile due to the similarity in theory.
According to the 80% rule, if price goes into a VA and stays inside for at least 2 candles, there is an 80% probability that price will go through the entire VA zone (from VAH to VAL or vice versa).
Using Session Volume Profile, if price lies outside yesterday's session VA, then when price gets back into yesterday's session VA and stays inside it for at least 60 minutes (2 candles of 30 minutes), price will have an 80% chance of going through that entire VA.
How the 80% rule works:
- Price opens outside VA (above VAH or below VAL).
- It returns into the VA zone.
- It stays inside VA for at least 2 units of time (2 candles).
- There is an 80% probability that price will travel the entire VA (for example: from VAL up to VAH or vice versa).
Applying Session VP to the USDJPY currency pair on the m30 timeframe:
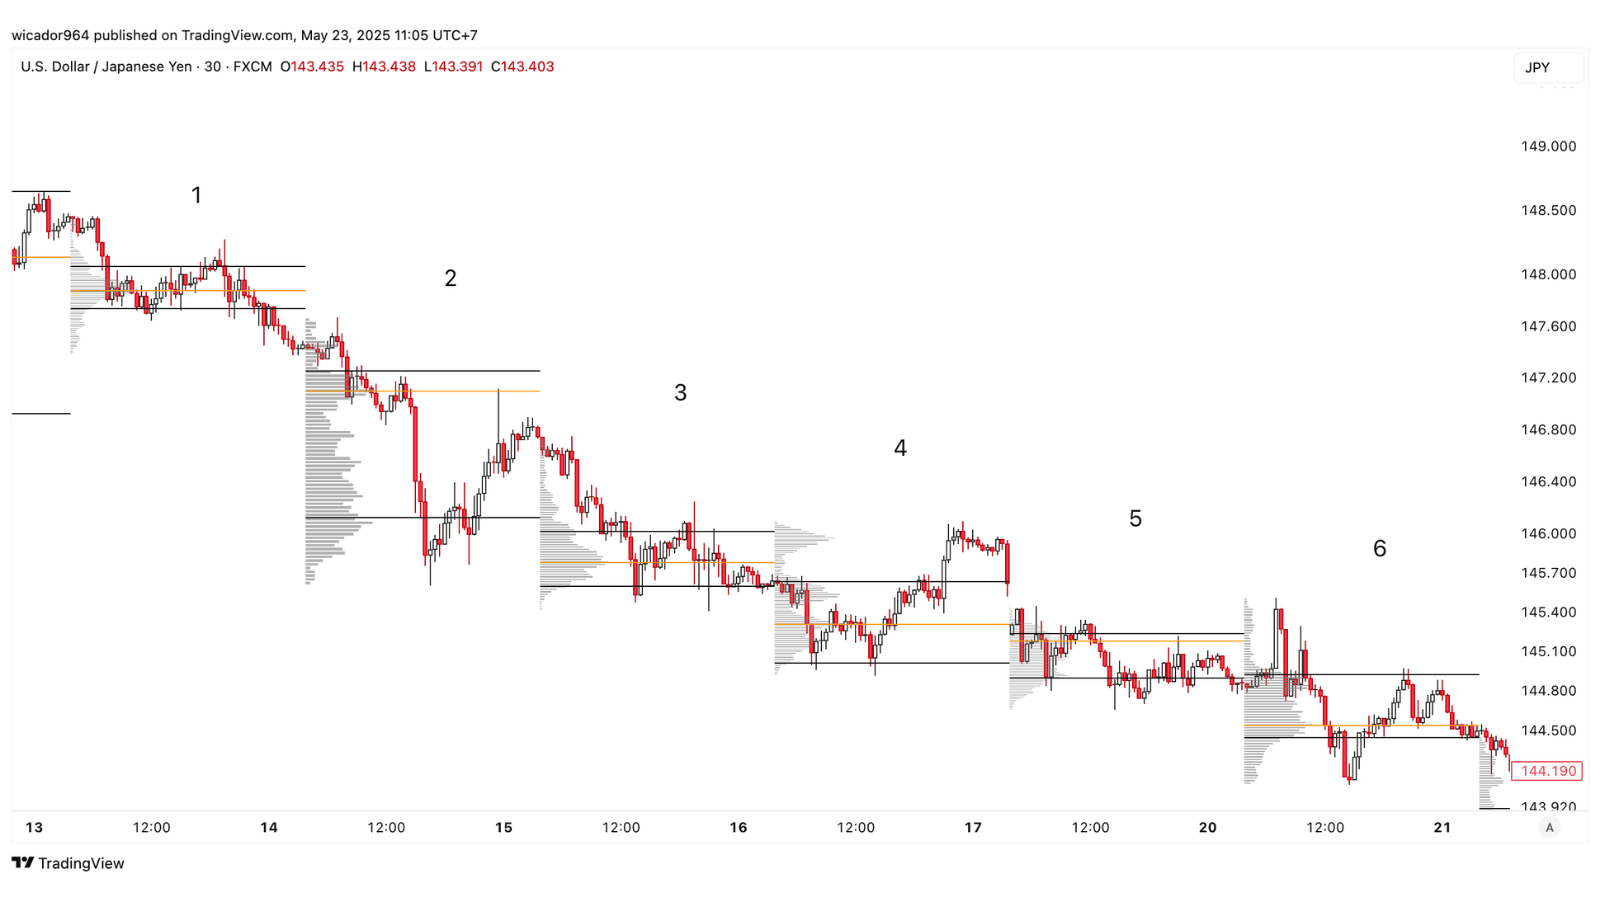 Figure 1: The 80% rule of Volume Profile
There are 6 volume profile sessions corresponding to 6 consecutive days.
Among them, on days 2 and 3 price rejected the previous day's value area as soon as it touched VAL. On days 4, 5 and 6 price accepted the previous day's value and returned into VA.
Only on days 4 and 6 did price follow the 80% Volume Profile rule. On day 5 price did not follow this rule.
Although on day 5 price did not reach VAH, price went at least to the POC of day 4 before reversing.
The 80% rule has higher accuracy when price goes sideways.
Interaction with VA
A VA zone has three important price levels that price will interact with: VAH, POC, VAL.
From the 80% rule, we develop different cases when price interacts with a VA as in the figure below.
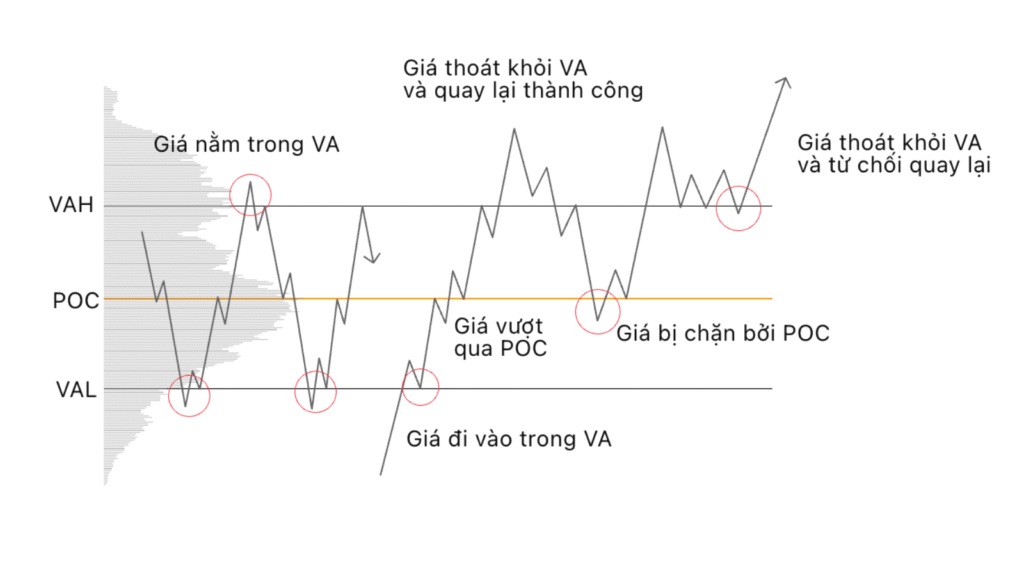 Figure 2: Cases of interaction with VA
When price goes into a VA, the nearest target is POC:
- If price exceeds POC, the next target is the opposite extreme zone.
- If price is blocked by POC, price will return and exit VA.
When price exits a VA:
- If price returns to test VA and enters successfully, repeat the process above.
- If price returns to test VA and is rejected, price will continue the trend and find another VA zone. The process above is repeated.
Example of the NZDUSD pair applying Session Volume Profile when price goes sideways:
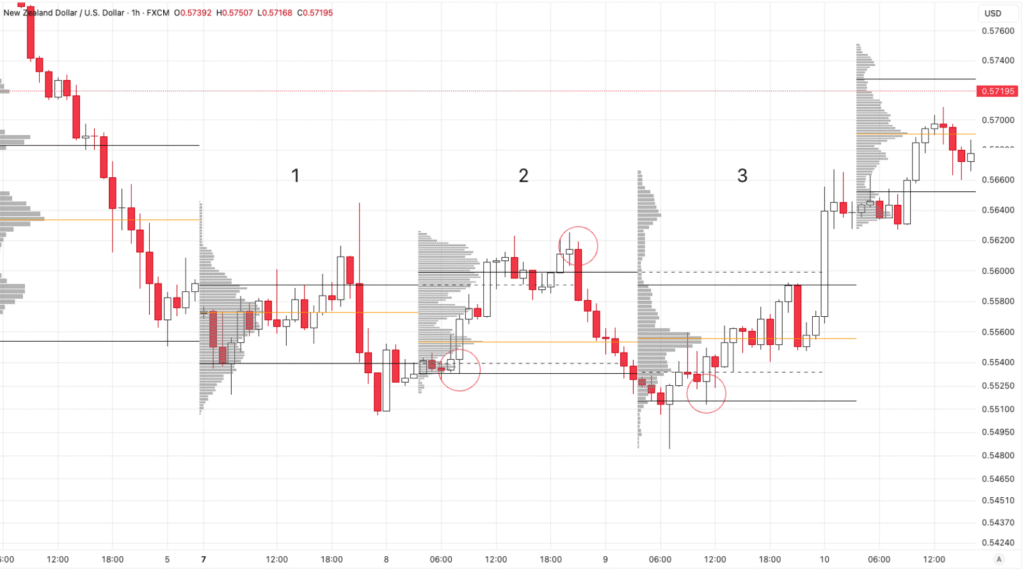 Figure 3: Example of interaction with VA in NZDUSD
- Observe three VA zones of 3 consecutive days. Day 2 has two times price entered the VA of day 1 and price went to the opposite boundary of day 1's VA (dashed line).
- Day 3: price entered the VA of day 2 and price went to the opposite boundary of day 2's VA (dashed line).
In the example above, we see that on day 1 price rose into the VA of the previous day and was blocked by POC and then reversed.
Example of the CHFUSD pair applying Session Volume Profile in an uptrend:
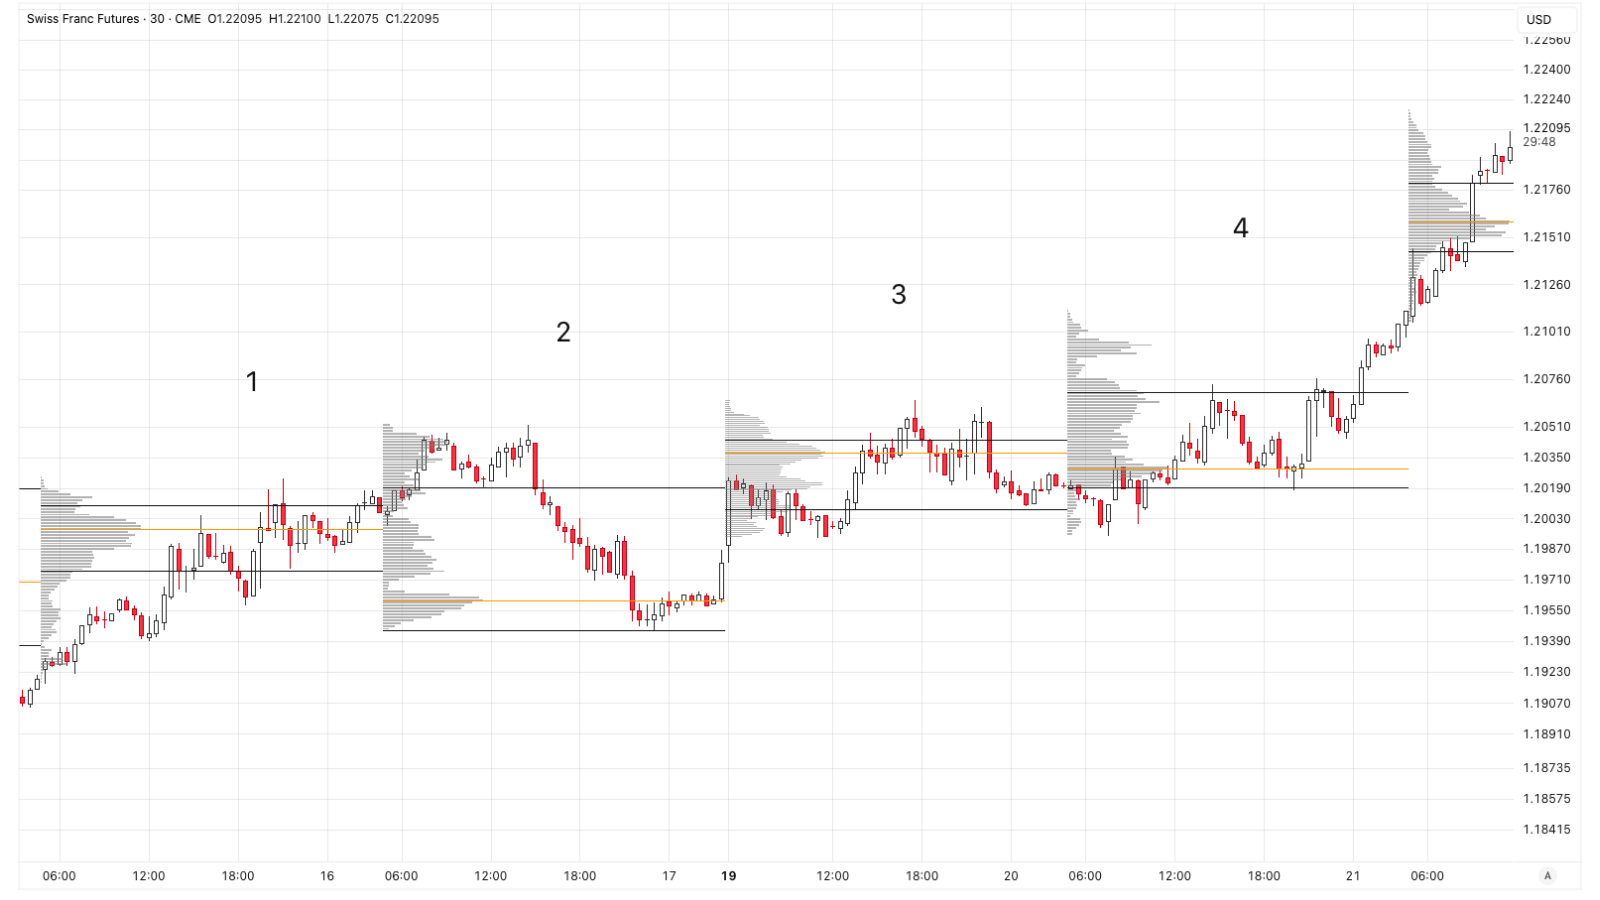 Figure 4: Example of interaction with VA in an uptrend
On days 2 and 4 price followed the 80% rule; on day 3 price did not follow this rule because on day 3 price was blocked by the POC of day 1.
A Wyckoff analyst will not simply trade purely based on the Volume Profile indicator. They will recognize that at the start of day 4's session, price has a Shakeout event of a small TR; this position is in confluence with the VAL of day 3.
Applying the 80% Volume Profile rule we will know price has an 80% chance of going up to the VAH of day 3; plus the potential Shakeout event, we can confidently enter a Buy order here.
What is the VWAP line?
VWAP (Volume Weighted Average Price) — The volume-weighted average price line. The trading volume of price levels above VWAP equals the trading volume below it.
Thus VWAP is an important equilibrium line; when price touches VWAP, the probability of rising and the probability of falling are equal.
Similar to POC, in a balanced market, price levels below VWAP are cheap and price levels above VWAP are expensive.
When the market becomes imbalanced, this is no longer true because price will push strongly in one direction beyond VWAP. At this point VWAP becomes a resistance or support line supporting price movement along the trend.
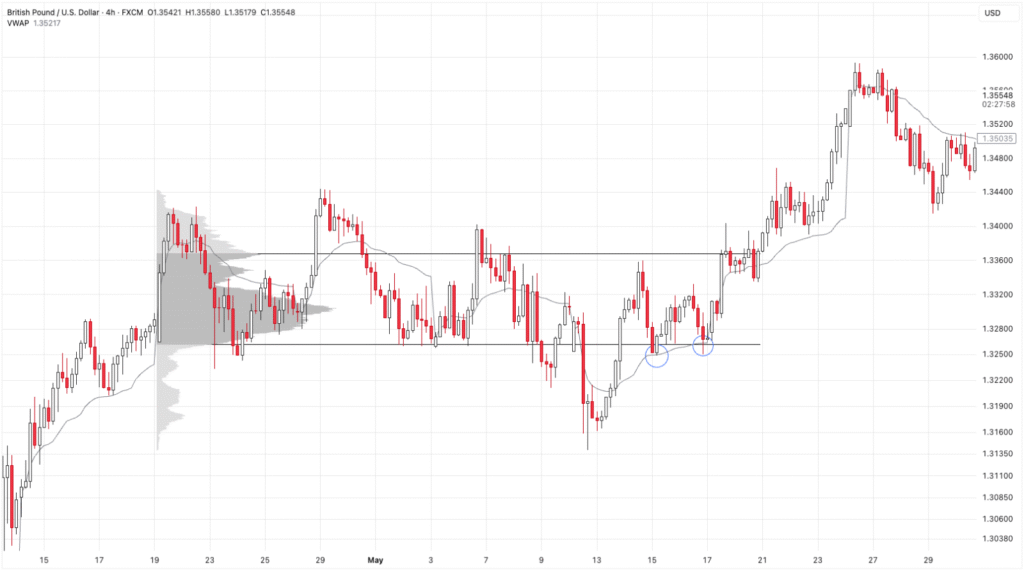 Figure 5: The VWAP line becoming a price support line
In figure 5, in the early stage price goes sideways in the value area; the VWAP line appears like a position accumulation line of the CO.
After a potential Spring phase, price returns to the value area and begins to become imbalanced and forms an uptrend. At this point VWAP shows its role well as a price support line.
Combining with Wyckoff
We will need the confluence of Volume Profile, VWAP and Wyckoff events.
Whenever you detect price going sideways, determine the length and timeframe of that Wyckoff range to decide which Volume Profile and VWAP to use.
- For intraday trading, use Session VP and Session VWAP.
- For longer-term trading, use weekly VP and weekly VWAP.
Or we can also use Fixed Range Volume Profile for each Wyckoff structure.
A VA with a width nearly equal to the Wyckoff TR is an ideal VA.
After applying VP and VWAP to the chart, the next analysis steps are:
- Context: Which side is in control? Is price sideways or trending?
- Scenario: If X then Y
- Position: Entry, Stoploss, Take profit.
Context
Price going sideways
Price going sideways means supply and demand are balanced; we are not sure which side will win, so it is best to:
- Wait for a shakeout (price escapes the equilibrium zone and returns).
- Trade at the boundaries (buy low, sell high).
This stage is phases B and C in Wyckoff. Always prioritize potential Spring/UTAD events.
Price going in a trend
If the shakeout fails, i.e. price becomes imbalanced and does not return to the value area, we know which side is in control, so it is best to trade with the trend.
- Breaking out of the equilibrium zone: price will look for a retest point after the break (Wyckoff Phase D).
- Going far from the equilibrium zone: price will go in a price channel with gradually higher or lower highs and lows (Wyckoff Phase E).
Scenario
Wyckoff is highly flexible, not in formula form, so we need to put forward scenarios: If it is X, then next it may be Y.
That means all the traces price leaves for us need to be confirmed by subsequent movement.
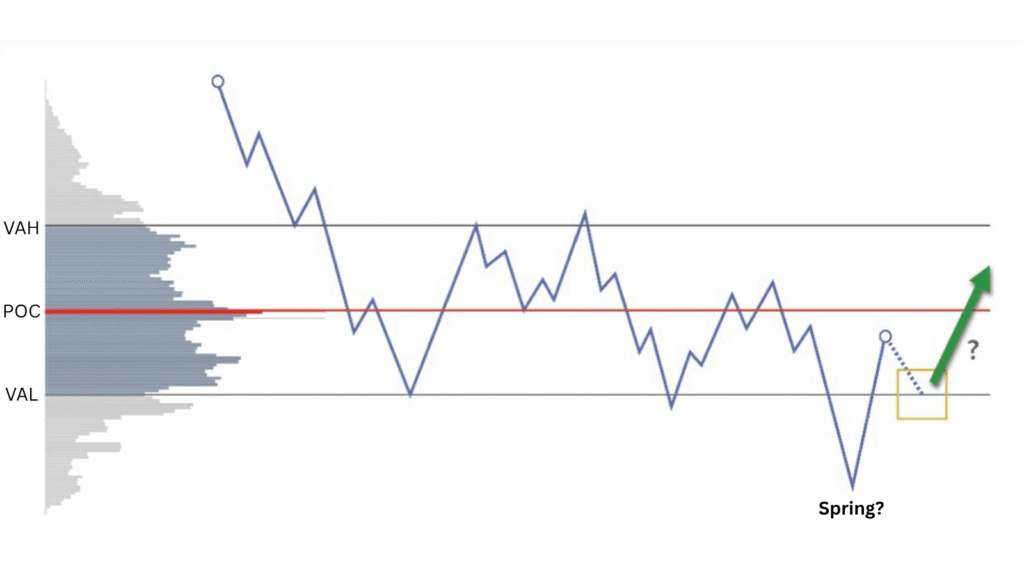 Figure 6: Scenario: price has just created a potential Spring
Suppose when price lies in the middle of VA, we need two scenarios:
- If price has just created a potential Spring, we will wait for the LPS test to open a buy position.
- If price has finished creating an LPS, we will wait for price to reach the upper boundary to evaluate.
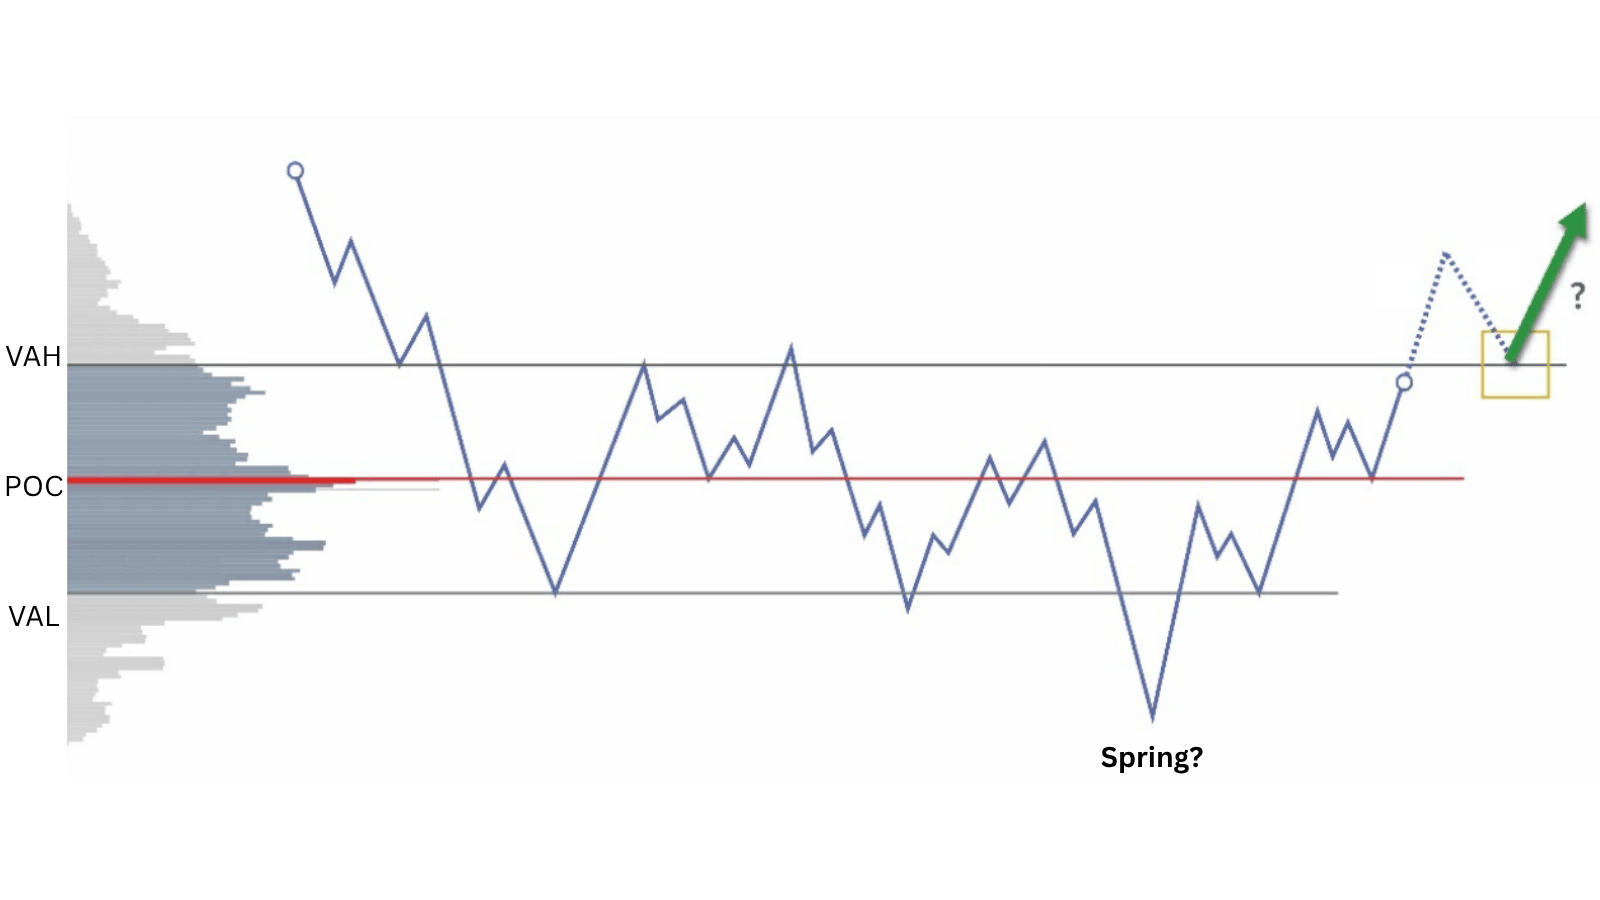 Figure 7: Scenario: price rises to the upper boundary
 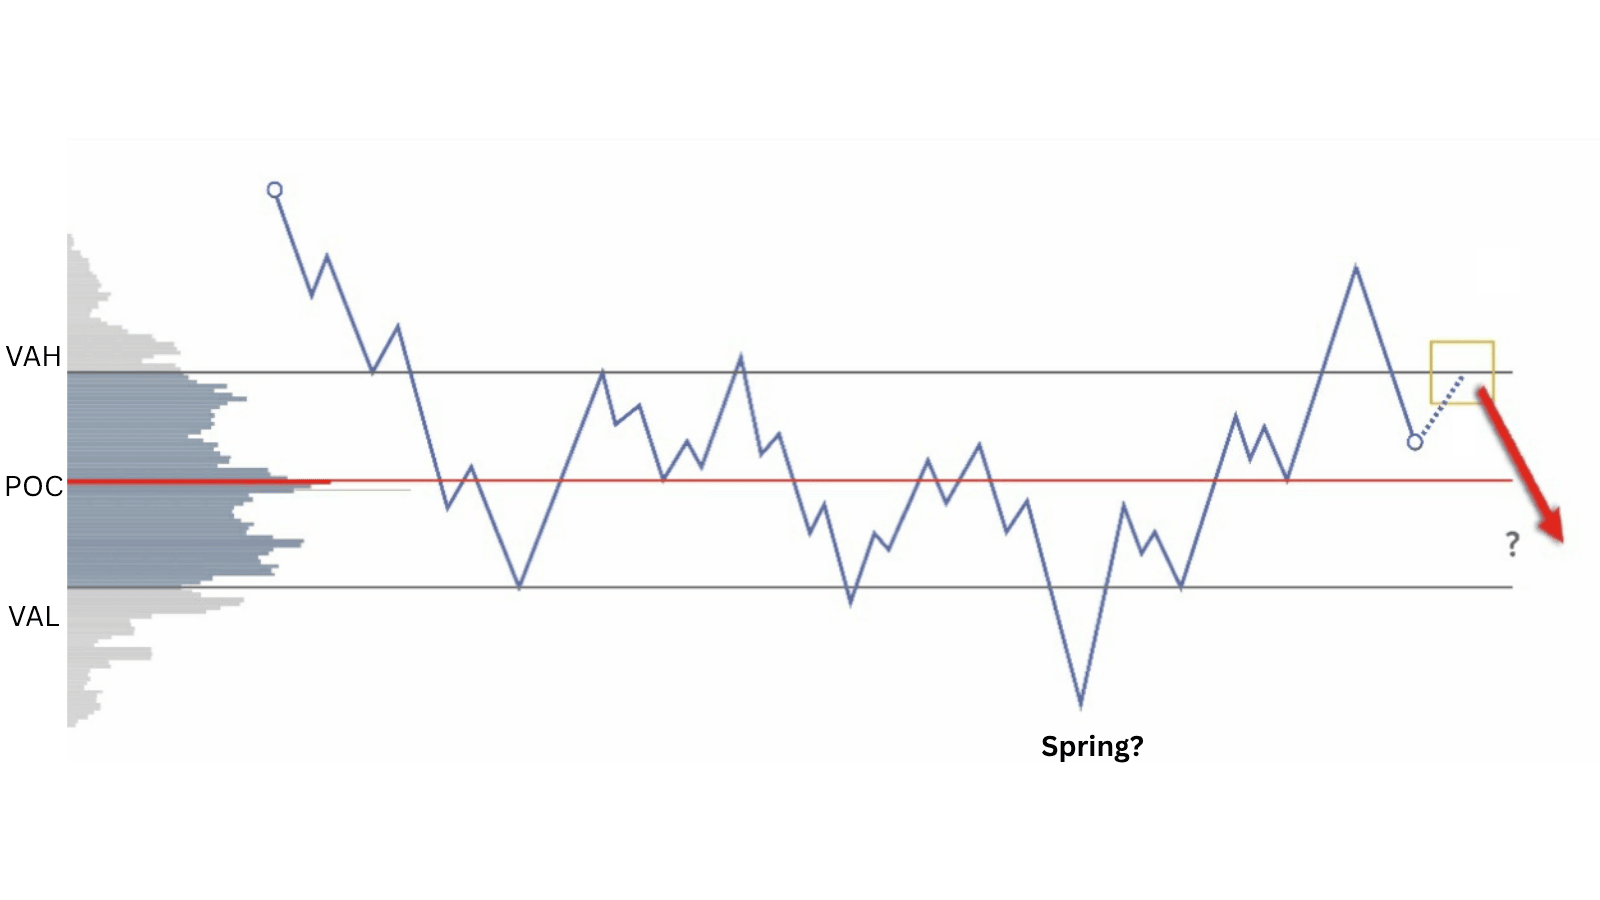 Figure 8: Scenario: price returns into VA
And when price rises to the upper boundary, we again build two scenarios:
- If price breaks the boundary (potential SOS), we will wait for the BU test at VAH or POC to open a buy position.
- If price returns into VA (potential UTAD), we wait for the LPSY test to open a sell position.
Evaluate the possibilities the market is likely to form, and change bias when price does not follow the initial scenario.
Opening a position
What is an SBar candle?
When the scenario has been built, what needs to be done is to wait for a proactive candle to exceed important levels to open a position.
Important levels include:
- LVN: a low volume node inside the range is a strong barrier level that price needs to exceed before entering an order. The area outside VA (below VAL or above VAH) can also be considered an LVN.
- VWAP, POC: These are two price levels that help determine which side is controlling the market → wait for price to exceed them to know which side wins.
A proactive candle is an SBar candle created by the CO, pushing price in one direction beyond the levels mentioned above, with characteristics:
- Large range, closing price lying near the candle high (if rising) or near the candle low (if falling).
- Relatively large trading volume.
- Appears after important positions such as Spring, LPS, Test…
A rising proactive candle is called SOSBar; a falling proactive candle is called SOWBar.
With Footprint + Delta support tools we can evaluate SBar candles more accurately.
Entry
Placing limit orders will not be appropriate because we do not know for sure whether the scenario put forward is correct.
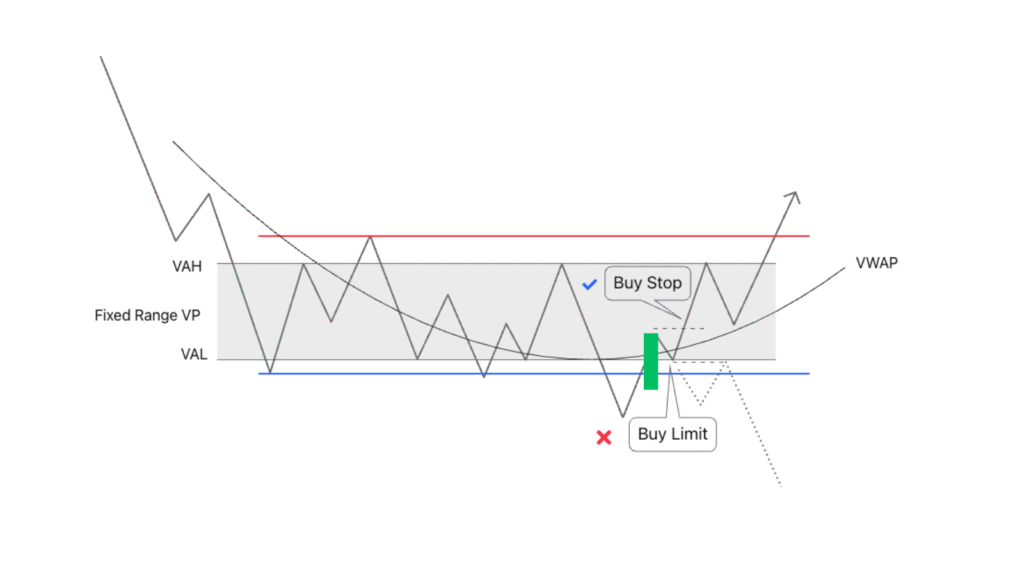 Figure 9: Entering a Stop order after an SBar candle
In the figure, if we place a limit order, it is very likely price will go down because the potential Spring phase predicted at first is actually SOW, and price is only rising to create LPSY and then continue the downtrend.
A Buy Stop order will avoid this possibility:
- In the case of buying up, we can place a Buy Stop order after an SOSBar candle.
- In the case of selling down, we place a Sell Stop order after a SOWBar candle.
Stoploss
The SBar candle is a proactive candle created by the CO; they will protect their position in case price goes against their bias.
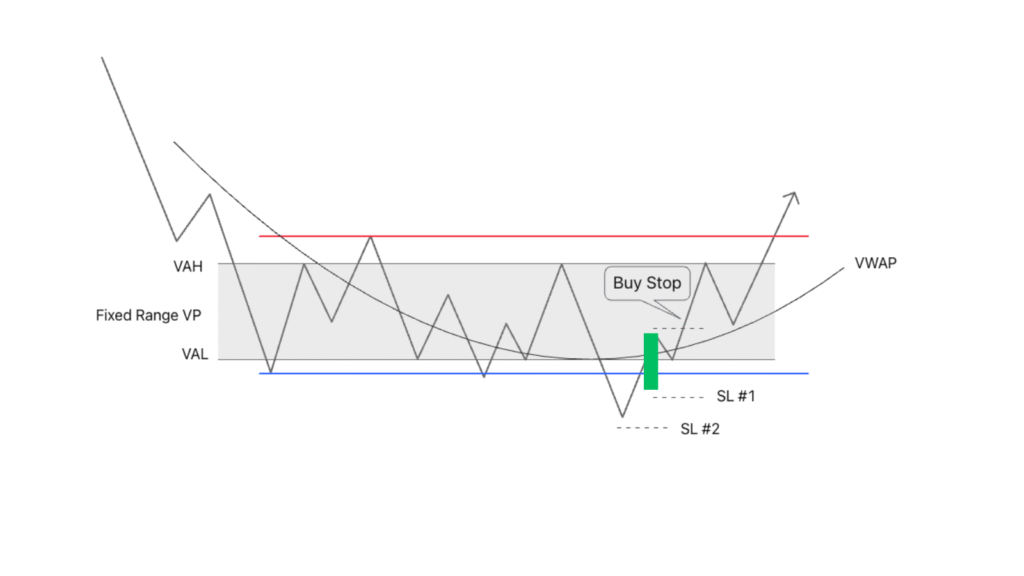 Figure 10: How to place a stop-loss order
Suitable stop-loss placement positions:
- Below the SOSBar candle if buying, or above the SOWBar candle if selling.
- The stop-loss order will be safer when protected by VAH/VAL extremes, or POC, VWAP.
Thus there will be several stop-loss levels depending on the specific case; you need to balance the R:R ratio at an acceptable level. First, build yourself a suitable risk management strategy.
Take Profit
Some effective take-profit areas:
- Climax candles: these are candles that appear when overbought (SC) or oversold (BC), signaling the stopping of the previous trend and a change of behavior.
- VAs in the past: price tends to move to the nearest high-volume area because that is where buyers and sellers once accepted bidding; it is very likely in the future they will also accept those areas.
- In addition, we can apply the cause and effect law using a PnF chart to calculate the price target.
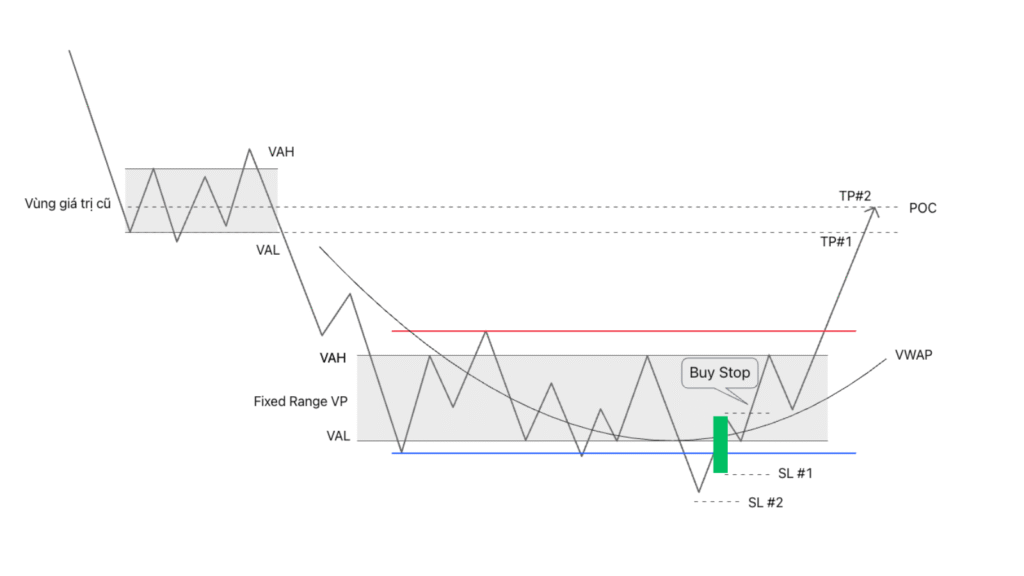 Figure 11: How to place a take-profit order
Practical examples
Example 1: GBPUSD on the H1 timeframe
Context analysis:
- Price goes sideways after a deep decline (it could be accumulation or re-distribution). Apply Fixed Range Volume Profile and Session VWAP.
- Notice that in the circled area, price has a shakeout from the Wyckoff demand line (also VAL) and returns into VA.
- Looking at Weis Volume, we see signs of supply exhaustion (Weis is cumulative volume often used in markets where traditional volume is hard to analyze such as forex, with similar usage).
Scenario:
- If this is a Spring, price will rise beyond the upper boundary. We can wait for a test to enter an order or enter right after there is an SBar exceeding VWAP upward.
- If price rises and cannot exceed VAH, price may reverse and become a potential UTAD.
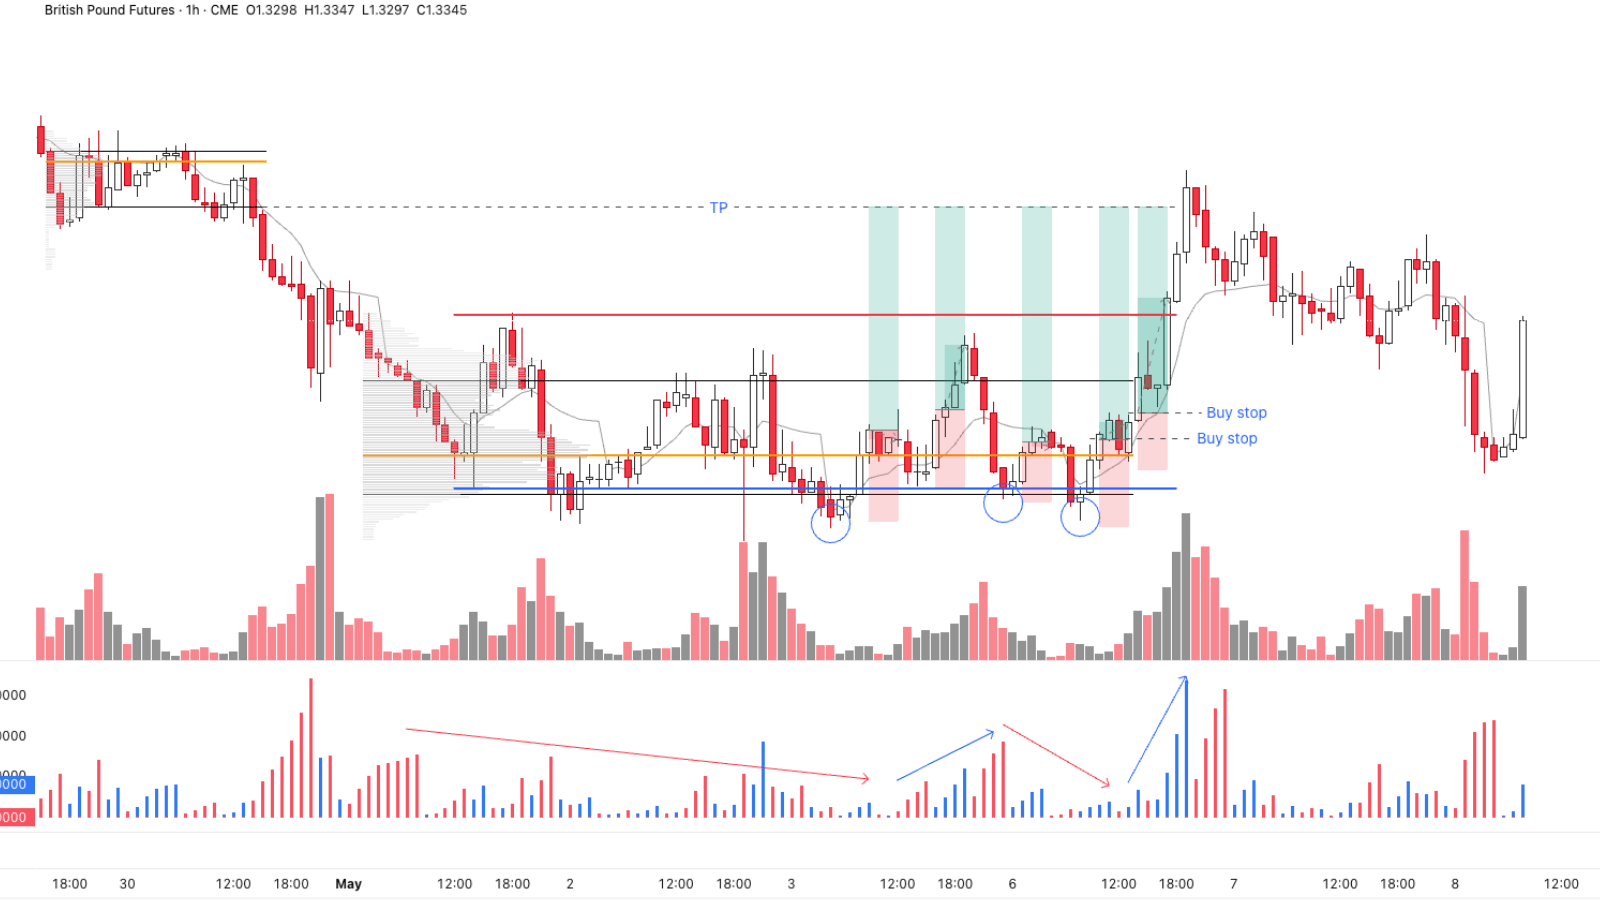 Figure 12: Wyckoff 2.0 entry module in the GBPUSD pair
Analysis of 5 Buy Stop positions after SBar candles in figure 12:
- Position #1: lies above VWAP, no test yet.
- Position #2: lies above VWAP/POC, has had a test.
- Position #3: large supply, lies below VWAP, no test yet.
- Position #4: lies above VWAP, after the previous test of large supply.
- Position #5: lies above VWAP/POC, has had a test at #4, strong Sbar candle.
At positions 1 & 2, price did not exceed VAH so there is a risk of becoming LPSY (Re-distribution without UTAD). However, afterward price fell and did not exceed VAL, so the accumulation scenario is still feasible.
We do not always have beautiful entries like positions 4 & 5.
Sometimes position 5 will not have a direct test and price will go straight up because the test at #4 already exhausted supply.
Waiting for a beautiful position can make traders miss opportunities, however entering a position early can increase risk.
To accurately determine an SBar candle, there is a trading school based on data such as Footprint, Bookmap.
Example 2: ETHUSDT on the m15 timeframe
Context analysis:
- After a failed Spring phase, price cannot rise further when it meets the previous day's session POC, suggesting a potential UTAD event.
- The SOWBar candle returns into the TR but has not exceeded the VWAP line, causing us to be unable to enter a sell order here yet.
- After that, price falls deeply beyond the lower boundary of the TR with gradually increasing volume, creating a potential SOW.
Scenario:
- Wait for price to recover to create LPSY to open a sell position (high probability).
- In the case price creates a Spring, we will wait for price to retest to open a buy position (low probability).
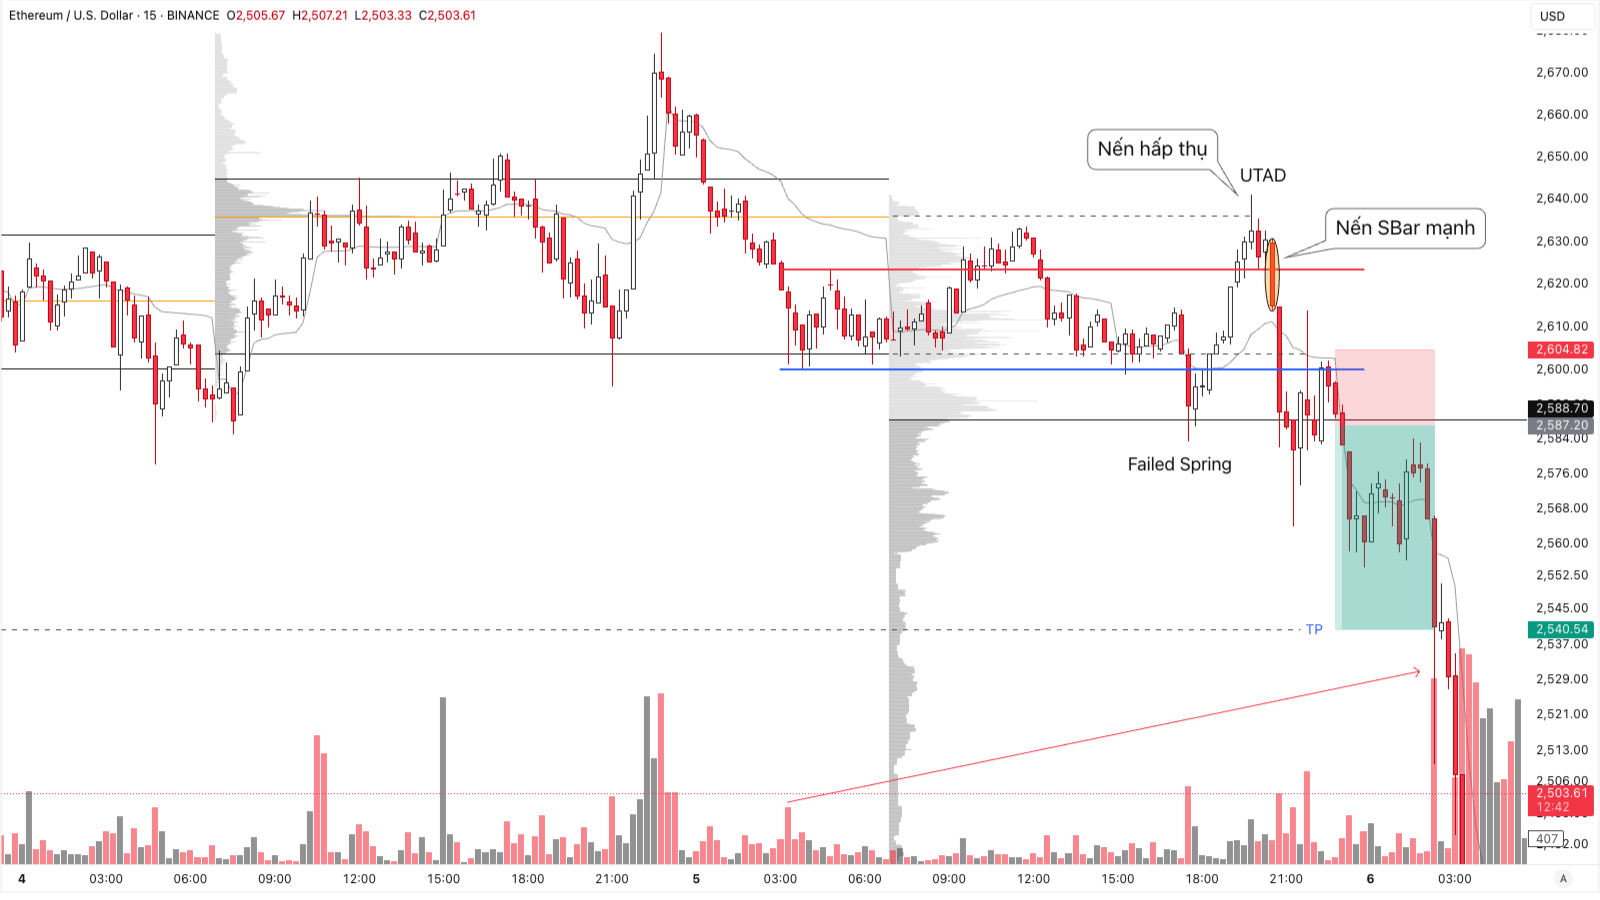 Figure 13: Wyckoff 2.0 Module ETHUSDT
Opening a position:
At the SOW position, price pulls a wick on large volume and recovers up like a Spring.
However, when touching VWAP in confluence with the previous day's VAL, a long-wick candle on large volume shows rejection of the value area.
After that price retests the confluence level one more time and continues to be rejected by several falling SBar candles. We can open a Sell Stop position after a clear SBar candle. Take profit at POC in the past.
Comment: In the example above, when analyzing based on Footprint and detecting a set of Absorption + Proactive candles (strong SBar), we can enter an order right after that SBar candle without needing to wait for a break down through VWAP.
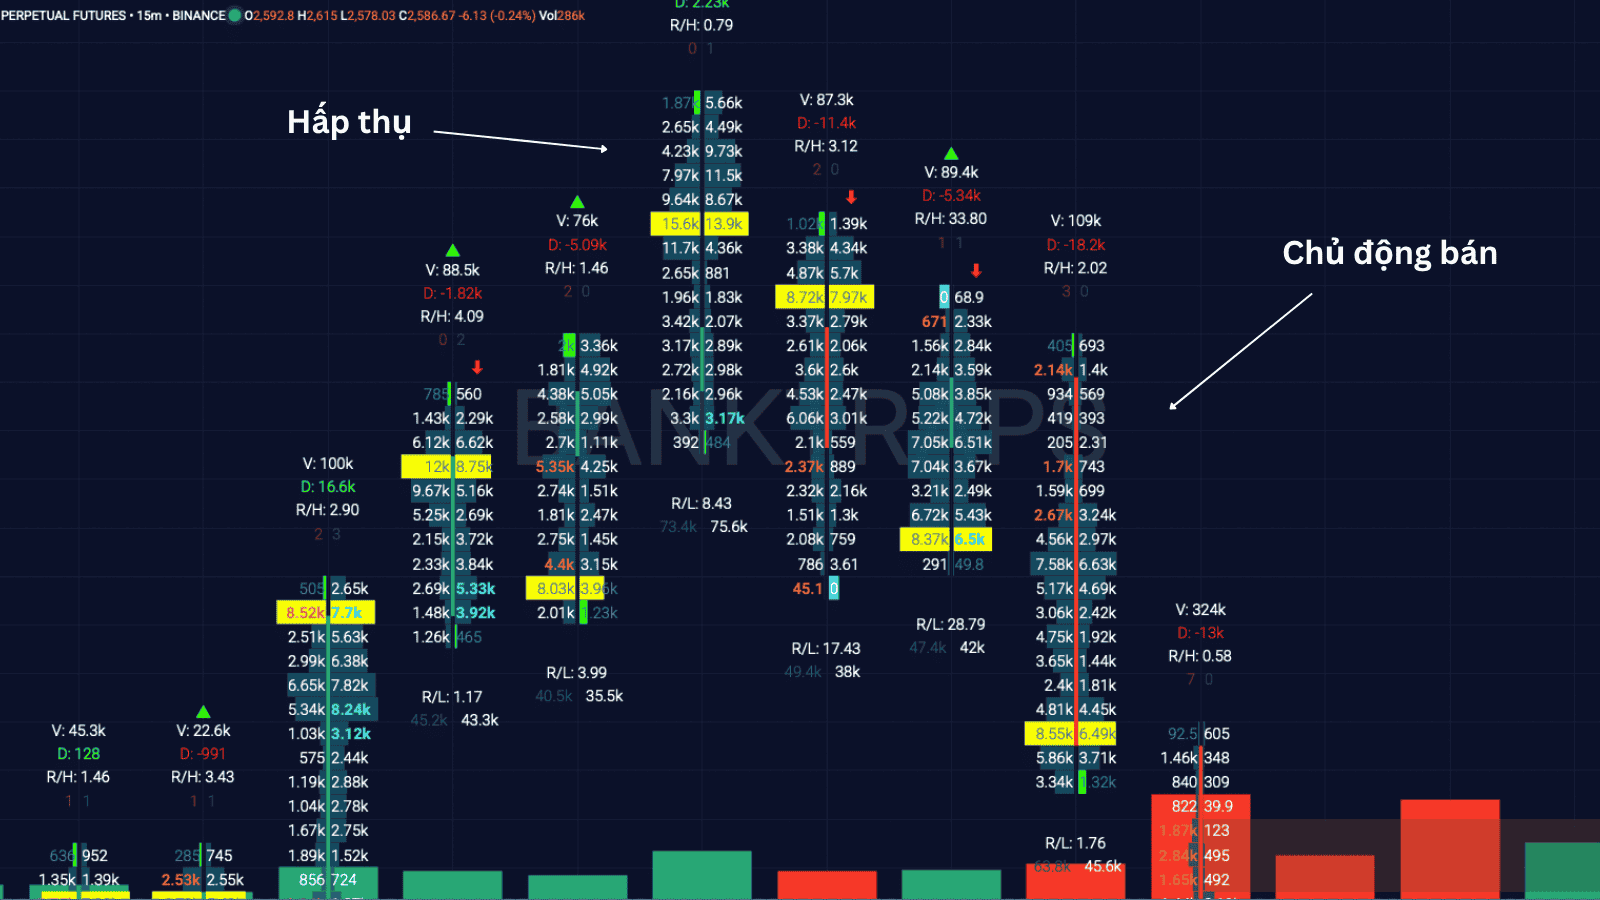 Figure 14: Absorption + Proactive candle set
Figure 14 consists of 4 reversal candles: 1 buying absorption candle + 2 buying exhaustion candles + 1 proactive selling candle.
The Footprint tool for the crypto market is used at Coinmap.tech. Trading Hub 3.0 will have an article in the near future.
Example 3: XRPUSDT on the H8 timeframe
Context:
- This is a large timeframe so we apply weekly Volume Profile.
- We detect price going sideways with a potential Spring event in confluence with the previous week's POC.
Scenario:
- After the Spring, price creates a strong SBar candle; the first scenario is that price will retest the SBar and bounce up.
- The second scenario: price tests and kills the SBar then goes down (Failed Spring). At this point wait for price to recover to LPSY to enter a Sell Stop order.
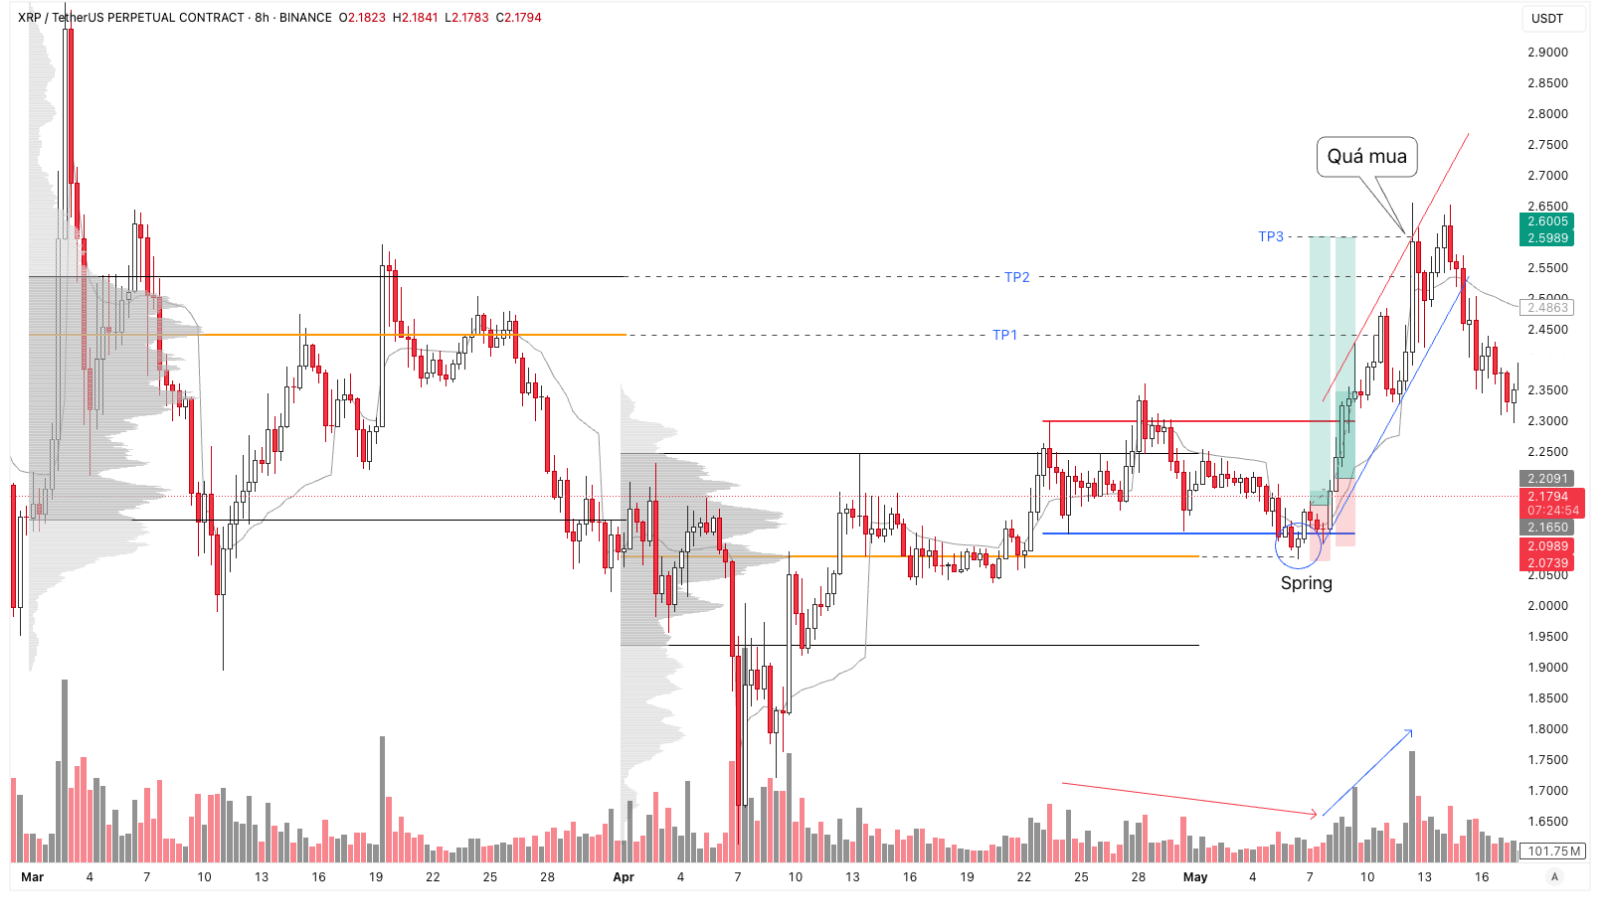 Figure 15: Wyckoff 2.0 Module XRPUSDT
Two Buy stop positions are opened here:
- Position #1 places a Stop order after the first Sbar candle (no test yet).
- Position #2 waits for the test and the appearance of a new SBar to place the order.
Both of these positions succeeded and price went straight to the overbought position (exceeding the supply line of the rising price channel).
Position #2 is safer because it appears after a retest of supply. However, sometimes the market does not carry out such tests.
5/5 - (5 votes)
Read structure 10x faster with JUKA
JUKA maps SMC structure — swings, BOS, CHoCH and inducement zones — automatically on any TradingView chart. No more hand-drawing structure for hours.
Get JUKA — $150