Trading Hub 3.0 (Part 8): What Is a Smart Money Trap (SMT)? – SMC
Many Smart Money Traders always trade based on BOS, CHoCH and OB, but in reality OB is not SMC. OB is only additional confirmation for a Buy or Sell. When we see any OB, we must confirm where the liquidity is, and only then will we know where the high-probability POI for Buy and Sell is.
If we join signal groups, we often see trades being called in a very "industrial" way, with SL usually very short at around a few pips or a fixed setup of 10-20 pips for each trade. This seems to minimise risk when calling a wrong trade, but in essence this is not SMC.
An SMC trader can set a stoploss of about 10 pips, and can also set 50 pips depending on the plan and the situation occurring on the chart.
Video on learning the Smart Money Trap
What is SMT in SMC?
A Smart Money Trap (SMT) is a trap set by Institutions / Banks to lure retail into trades. SMT can be a Fake BOS, Fake CHoCH, Fake OB, or IDM on any timeframe.
Many people have traded based on SMC, but they still lose money. The main reason is misunderstanding the essence of the problem.
Remember this mantra: When the market is bearish, never sell when price has not yet swept through the SMT, and always look for sell trades at the OB above the SMT. When the market is bullish, never buy when price has not yet swept through the SMT, and always look for buy trades at the OB below the SMT.
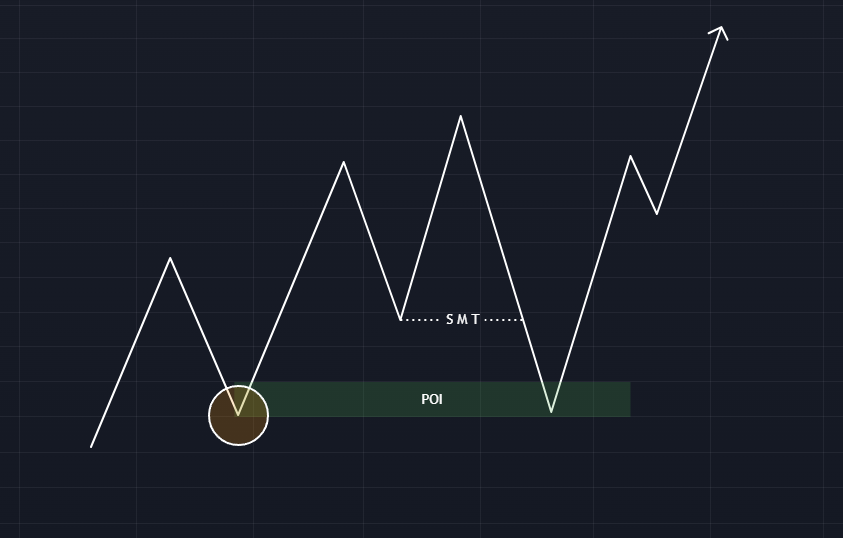 Buy below SMT in a bullish market
 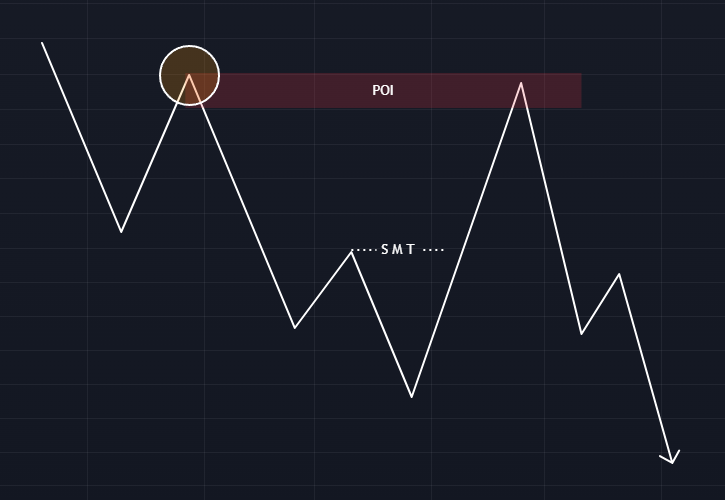 Sell above SMT in a bearish market
Tip: If after price passes IDM there are three OBs after that, it is very likely that the middle OB is the SMT. We should only focus on the first OB and the extreme OB.
Example of SMT
Most traders fail because they do not know how to identify where the real OB and POI are located.
Let us go through the following example to understand SMT.
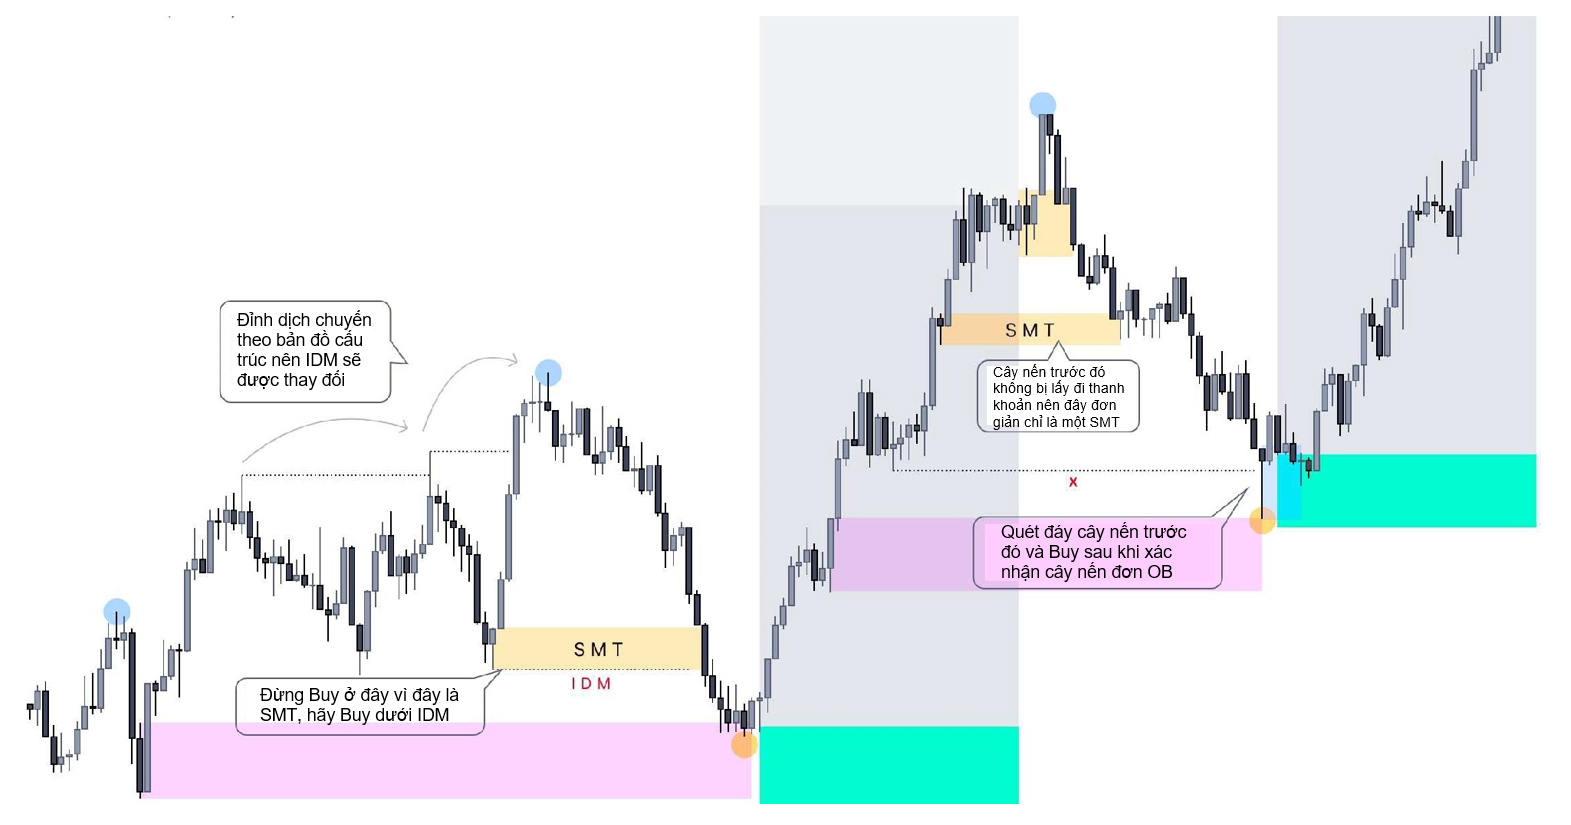 Identifying SMT when the market is bullish
In the example, the first SMT hides under an IDM. To increase, the market needs to sweep liquidity and return to tap the OB (see entry in the upcoming sections).
The second SMT is not an OB because it lies entirely within the range of the previous candle and does not sweep the liquidity of the previous candle. This is simply an SMT.
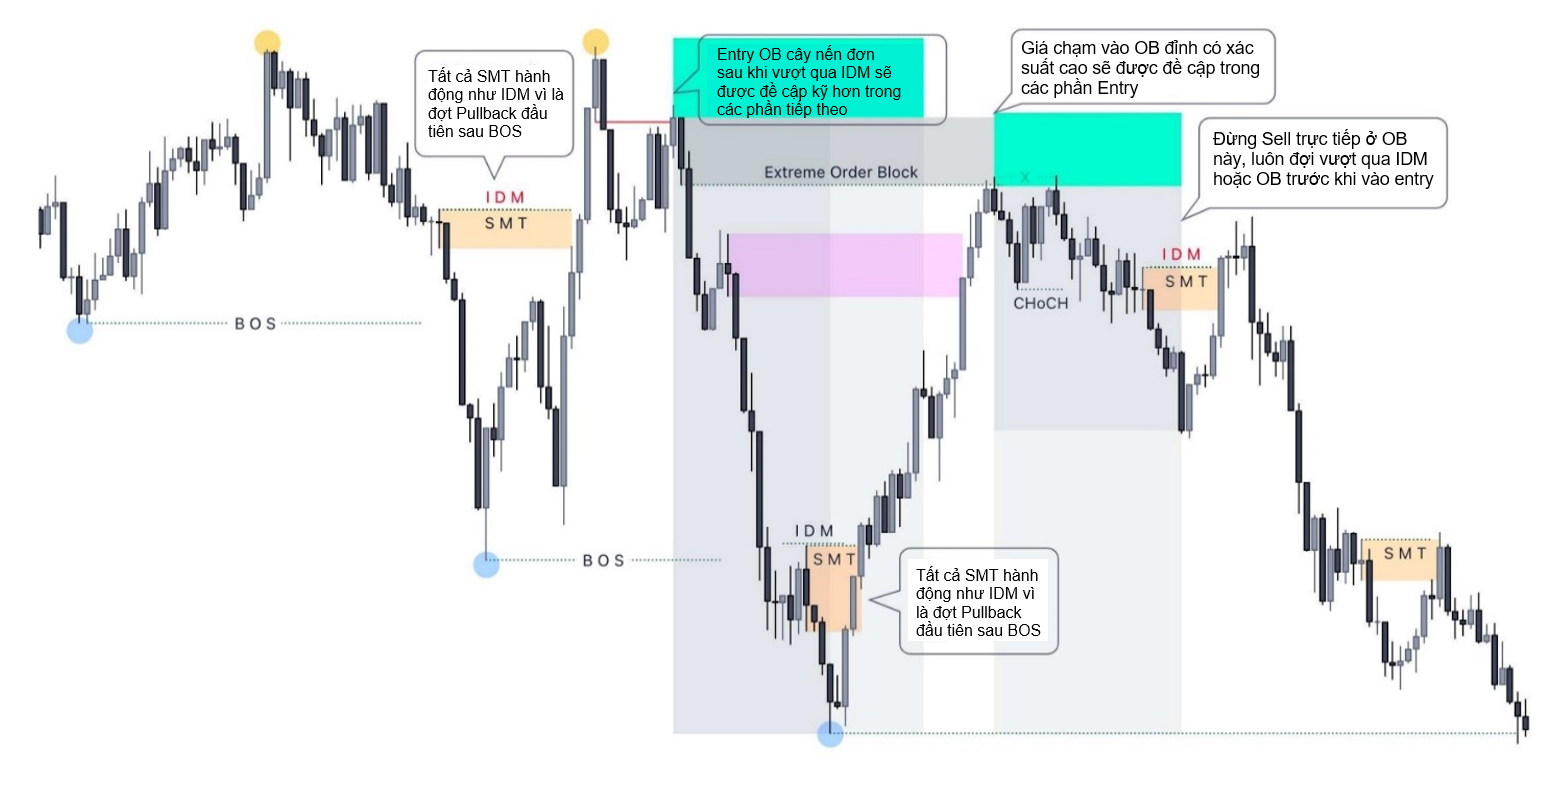 Identifying SMT when the market is Bullish
In the second example, the first SMT is an IDM that lures traders into a trade, although it looks like an OB that has swept the liquidity of the previous candle. The same applies to the following SMTs.
Let me repeat this another 1000 times: OB is not SMC. We should never rush into a trade when we see an OB, but must wait for IDM or a liquidity sweep with clear confirmation before Buying or Selling.
Rate this article
Read structure 10x faster with JUKA
JUKA maps SMC structure — swings, BOS, CHoCH and inducement zones — automatically on any TradingView chart. No more hand-drawing structure for hours.
Get JUKA — $150