Why traders are dropping slow indicators and switching to SMC?

SMC is the most logical method a trader can learn. Price does not move randomly: every reversal, every stop hunt, every breakout has a reason. SMC gives you that reason before you click — not after price has already run away.

Try JUKA free for 3 days Learn SMC free
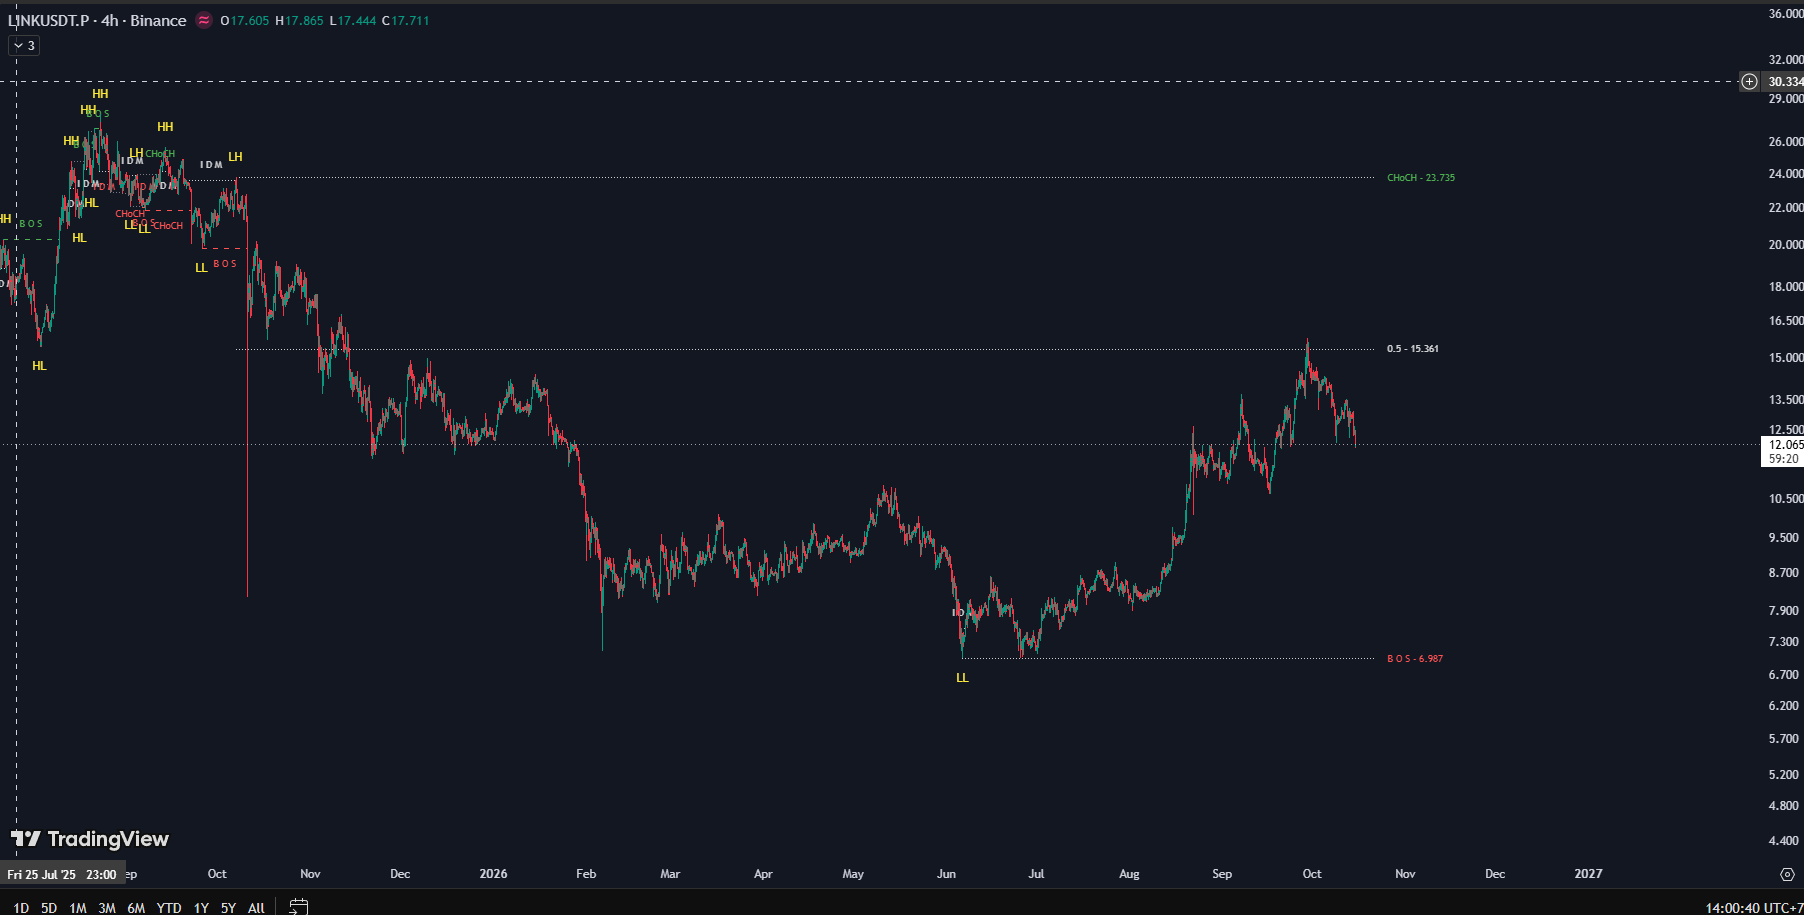
The JUKA indicator draws market structure with HH, HL, BOS, CHoCH, IDM labels and order block zones on TradingView

JUKA draws directly on the chart — structure drawn candle by candle

1. The closed 5-link logic chain

The power of SMC is that every concept connects into a cause-and-effect chain. Understand this chain and you understand why price moves the way it does.

1. Big money needs counterparties

Banks and large funds cannot buy or sell huge size in a single order. They have to accumulate gradually, and to accumulate they need someone selling on the other side. That is why the market always needs liquidity.

2. Liquidity sits where everyone can see it

The crowd's stop losses always cluster in the obvious places: above old highs, below old lows, above and below round price levels. So liquidity sits exactly where everyone can see it.

3. The sweep takes the liquidity

Price often pushes through an old high or low for one move to sweep out stop losses, then turns and goes in the real direction. Those who buy the breakout get stopped out; those who wait for the sweep to finish get the good position.

4. The footprints left behind: order blocks and FVGs

After the sweep, price moves hard and leaves footprints: the last opposing candle before the move is called an order block, and the gap between candles is called a fair value gap (FVG). That is where big money entered.

5. The destination is the opposite liquidity

Price travels from one liquidity zone to the next. Enter on the retracement, place the stop beyond the sweep, take profit at the opposite liquidity: entry, stop and target all have a reason — nothing is a guess.

2. Where SMC beats traditional indicators

Traditional indicators describe price that has already moved. SMC explains why price is about to move.

🐢

Lagging indicators: RSI, MACD, MA

They are calculated from past price, so they only confirm after the trend has already run part of its course. Traders enter when price is nearly exhausted, and stops are placed on gut feeling because the indicator gives no invalidation point.

🧭

SMC: reason first, order second

Structure tells you the trend, liquidity tells you where price is headed, the sweep tells you the timing, and order blocks and FVGs tell you the entry. Every order answers three questions: why enter, where am I wrong, where do I exit.

🎯

Stops with a reason, targets with a reason

The stop goes beyond the sweep point or the order block boundary: if price breaks through there, the thesis is wrong and cutting the loss is correct. The target sits at the opposite liquidity zone. The minimum risk-reward under the guidance is 1:2 — not a number made up from feeling.

🧩

One system, not a basket of signals

RSI says buy, MACD says sell, the MA says wait: traders get confused because the signals have nothing to do with each other. SMC is a single system, from the higher timeframe for trend to the lower timeframe for entry — every piece serves the same thesis.

3. The concept blocks and the logic behind them

Every SMC concept answers one specific trader question.

Market structure

The logic behind it: higher highs and higher lows mean buyers are winning, and vice versa. Trend is not a feeling — it is something you read from highs and lows.

BOS — Break of Structure

The logic behind it: price breaking an old high in the trend direction means the trend is continuing. This is confirmation, not a signal to chase.

CHoCH — Change of Character

The logic behind it: the first break against the trend is an early warning that the other side has shown up. On its own it is not enough to reverse, but it is where every reversal begins.

Liquidity

The logic behind it: stop losses cluster at old highs and lows and key price levels. Know where liquidity sits and you know where price can be pulled.

Sweep

The logic behind it: a wick piercing a level and closing back inside is evidence that liquidity has been taken. A sweep is different from a real breakout: in a breakout, price stays outside the level.

Inducement (IDM)

The logic behind it: a small, obvious high or low in front of the real zone lures traders in early, and their stops become liquidity for the real move.

Displacement

The logic behind it: a strong move after a sweep proves which side is in control. Without displacement there is no confirmation — only a guess.

Order Block

The logic behind it: the last opposing candle before the displacement is where big money entered. A retracement back there is a chance to enter in the same direction at a good price.

Fair Value Gap (FVG)

The logic behind it: the gap between three candles is a zone where price has not traded in balance. Price often returns to fill the gap before continuing.

Premium / Discount

The logic behind it: above the 50% equilibrium of a range is expensive, below it is cheap. Buy in the cheap zone, sell in the expensive zone — instead of chasing buys in the expensive zone.

Killzone

The logic behind it: the London session (around 02:00–05:00 New York time) and the New York session (around 07:00–10:00 New York time) are when liquidity and volatility are highest — and when sweeps happen most often.
4. The 6-step process behind every trade

SMC is not inspiration. This is a repeatable process for every trade.

Step 1: Get the higher-timeframe trend

Read Daily or 4H structure to know which side is winning. Do not trade against the higher-timeframe trend.

Step 2: Mark the liquidity

Mark old highs and lows, previous session highs and lows, previous week highs and lows. Those are the places price can be pulled to.

Step 3: Wait for the sweep

Wait for price to sweep liquidity, ideally during the London or New York session. No sweep yet, no rush.

Step 4: Wait for displacement and a lower-timeframe CHoCH

After the sweep, wait for a strong displacement and a structure change on the 15M or 5M chart to confirm the new side is in control.

Step 5: Enter on the retracement

Enter when price retraces to the order block or FVG, in the direction of the displacement.

Step 6: Stop and target both have a reason

Stop beyond the sweep point or the order block boundary. Target the opposite liquidity zone. The minimum risk-reward under the guidance is 1:2.

5. Six reasons traders choose SMC

Read intent instead of guessing

Instead of asking "will price go up or down", the SMC trader asks "where is the liquidity and who is about to be swept". Ask the right question and the answer is right.

Avoid the breakout trap

Most traders lose because they buy breakouts and get swept. SMC teaches you to wait for the sweep to finish before entering — turning other people's trap into your entry.

Works in every market

The logic of liquidity and structure is the same in forex, crypto, stocks, indices and gold. Learn once, use it on every chart.

Flexible across timeframes

Take trend from the Daily or 4H chart, then enter on the 15M or 5M chart. Busy people swing trade, people with free time day trade — one system.

Combines with other tools

SMC does not force you to throw away everything you already use. Volume, news and other tools can still stand alongside this system.

The more you practice, the faster you read

At first you have to draw every zone by hand. Once you are used to it, one look at the chart shows structure, liquidity and entry. That is an accumulated skill, not a rented signal.

6. One short note

SMC is a framework for reading the market, not a money-printing machine. It works best when you are willing to practice, write fixed rules of your own, and manage risk with discipline on every trade. Learned the right way, SMC is a long-term edge — not a shortcut.

JUKA draws this entire logic on your chart

Learning SMC is one thing; drawing by hand every day is another. JUKA does that heavy work for you, right on TradingView.

📈 Automatic swing structure

HH, HL, LH, LL are marked as soon as they form — no hand-drawing needed.

💥 Live BOS and CHoCH

Structure breaks and changes of character appear together with the projection line.

🎯 IDM inducement zones

The liquidity zones big money is targeting are drawn before price gets there.

🧹 Liquidity sweeps

Wicks sweeping highs and lows are clearly marked the moment they happen.

⚖️ Premium and Discount

The 50% equilibrium zone plus previous session highs and lows show what is expensive and what is cheap.

🚫 No repaint

Structure that has been drawn is never redrawn or moved. What you see is what actually happened.

JUKA — Invite-Only Access
$50 per year
  • Full JUKA indicator on TradingView
  • Access granted by your TradingView username
Try free for 3 days — contact us on Telegram
JUKA — Full Source Code
$99 one-time
  • Full Pine Script source code
  • 5-minute setup guide
  • Free 1.x version updates

View the script on TradingView: Trading Hub 3.0 Structure Smart money concept (viewing the script does not grant access — invite access is granted by TradingView username).

Start in 3 steps

Step 1: Learn free

Read the 8-step SMC roadmap at the SMC learning page and download the free ebook at Free Ebook.

Step 2: Read the advanced guide

Download the 3-part Advanced SMC guide at Free Advanced SMC Guide to master the full theory and entry points.

Step 3: Try the indicator

Message Telegram @hotayxanhvn with your TradingView username to get a free 3-day JUKA trial.

Risk note: JUKA is an analysis and education tool. This is not financial advice, investment advice, or a recommendation to buy or sell any instrument. Trading involves a significant risk of capital loss.