Wyckoff Part 5: Summary of 7 Common Wyckoff Accumulation Patterns
As learned in the Accumulation Structure, to absorb supply and push price up successfully, the CO needs to ensure price will go up along the path of least resistance.
Wyckoff recognized that the CO's way of doing this is to create actions that induce the public to sell their goods or cause them to hit the stop losses of their buy positions.
The accumulation structure has many different shapes and variations; this article will summarize for readers the popular patterns.
The Wyckoff accumulation pattern structure
A brief review of the phases and events of the accumulation structure:
Phase A: Stopping the previous downtrend
- An oversold SC event is supported by the CO, causing price to rally to the AR level.
- Draw the TR range consisting of two parallel lines through SC and AR.
- After the third CHoB at ST, price changes to sideways, volume gradually decreases.
Phase B: Forming the cause
- Price continuously tests the upper edge (UA) and lower edge (ST).
- The CO absorbs most of the supply, volume gradually decreases toward the end.
- Phase B usually develops the longest; if Phase B is short it is a sign of haste.
Phase C: Test (or shakeout)
- The CO shakes out the remaining supply by pushing price below support (Spring or LPS) to test.
- The shakeout event does not necessarily have to touch the support line.
- If the CO cannot shake out the supply (volume is still large), the CO will prolong the absorption process or give up, letting price change into redistribution.
Phase D: Uptrend within the TR
- After a successful shakeout, price rises rapidly, breaking through the Creek (SOS), then pulls back to test (BU).
- Price should lie above the structure and not immediately return; otherwise it will become a bearish UTAD.
- Entry points include LPS and BU with small volume.
Phase E: Uptrend outside the TR
- Price goes within a rising price channel with gradually higher peaks (SOS) and bottoms (LPS).
- Suitable entry points are LPS with decreasing volume.
- The final take-profit point is when overbought occurs or price reaches the PnF target.
Accumulation patterns and variations
The accumulation structures with a Spring and without a Spring mentioned in the previous part are quite easy to identify. However, the market does not always create a pattern as we expect.
Besides the "textbook" cases, Wyckoff has some other forms.
Most of the different accumulation shapes are cases where price does not lie neatly within an ordinary TR.
Studying the variations is not necessary because they are very difficult to detect.
It would be very wrong to memorize patterns mechanically, but if you have time, turn on chart history and review all accumulation structures to practice.
When encountering a structure that does not follow an ordinary Trading Range, we can suspect and apply a variation to project a potential Phase C based on the three Wyckoff laws.
Accumulation Type 1: With a Spring
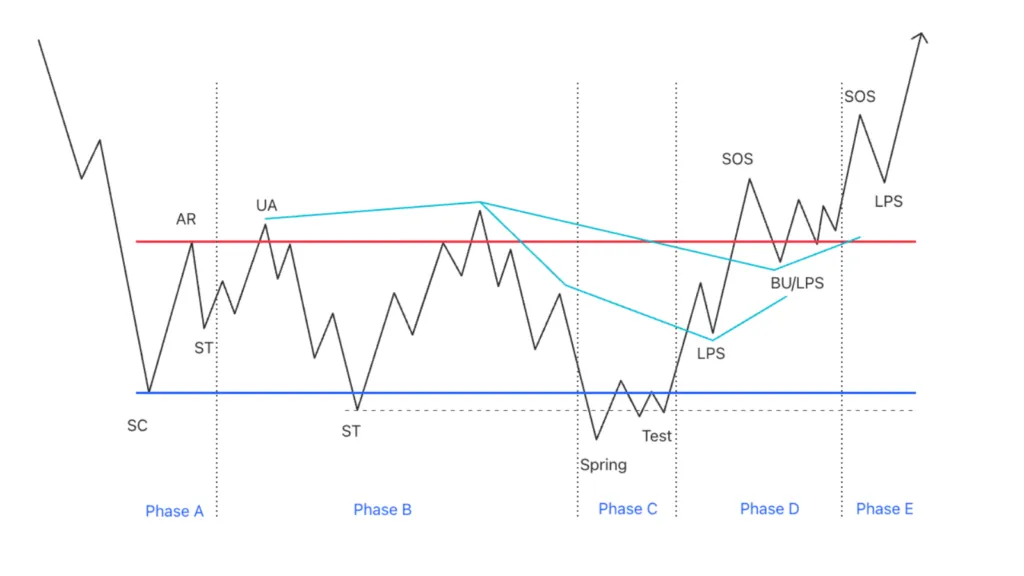 Figure 1: Accumulation structure with a Spring
This is a popular, easy-to-recognize form of accumulation pattern called Accumulation with Spring action. Characteristics:
- Review the usual signs of identifying accumulation in Part 4.
- We will study more deeply how to identify accumulation structures in the coming parts.
Example of an accumulation structure with a Spring on the ADA/USDT pair:
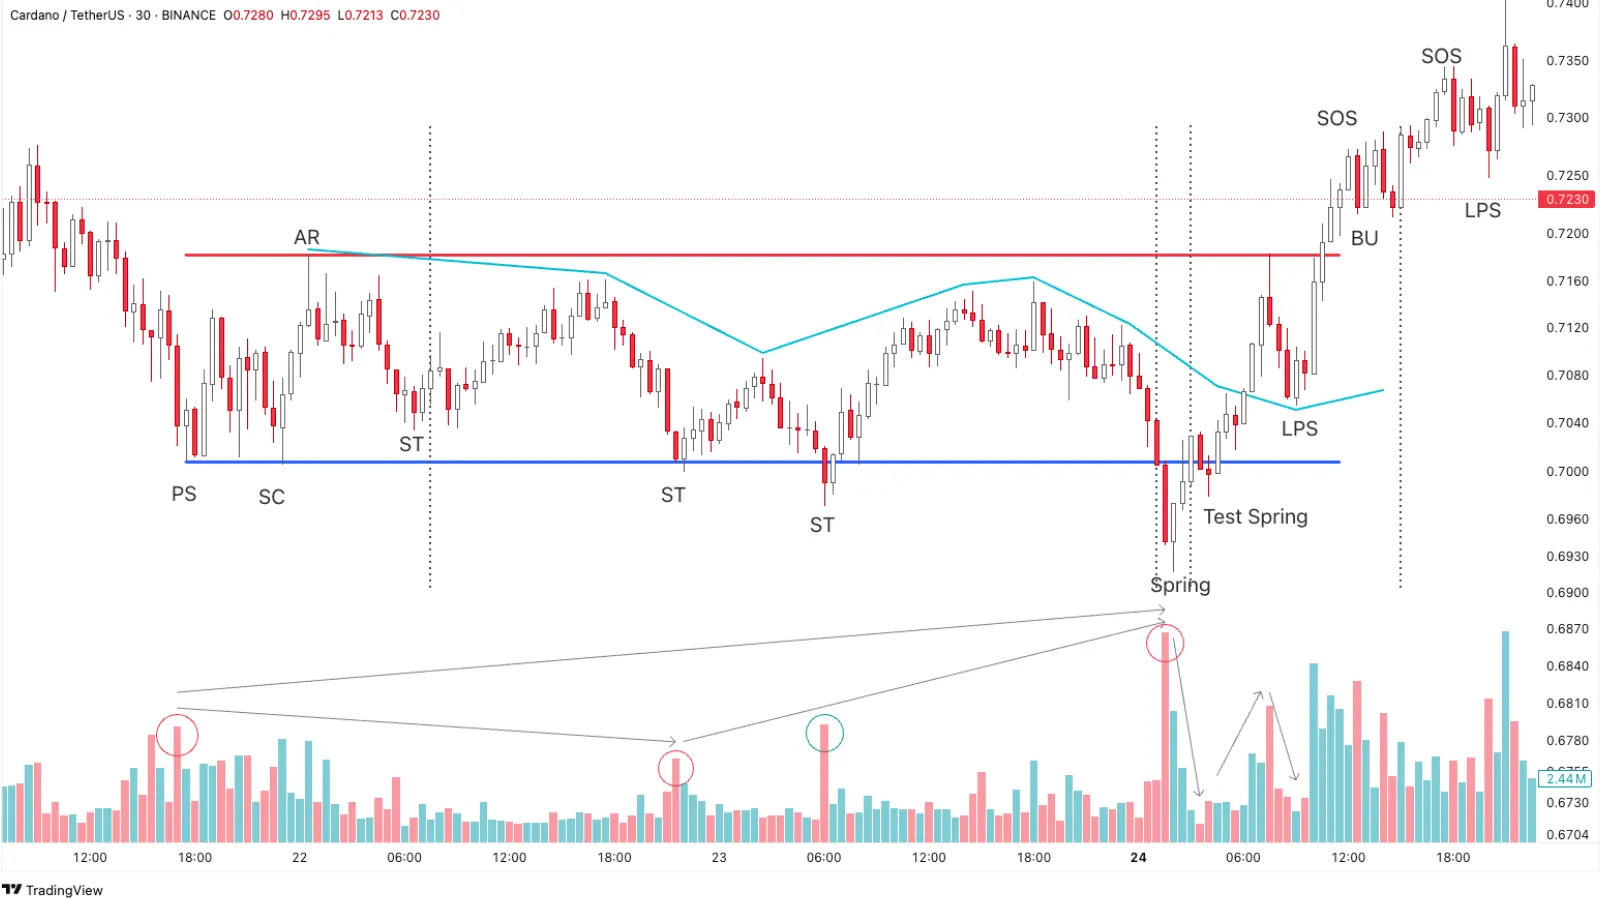 Figure 2: Accumulation structure with a Spring in ADA coin
- Volume gradually decreases in the first half of the TR, then gradually increases toward the end. This is the volume characteristic commonly seen in this type of structure.
- At the second ST in Phase B, there is strong demand support (circled in blue). This position is easily mistaken for a Spring. However, after price rises we see the spread gradually decreases and volume is small, showing buyers are not interested in continuing to buy.
- Afterwards price falls sharply with high volume, showing the CO's intention of actively selling to activate all the stop losses of buyers within the TR.
- This position is easily mistaken for the SOW of a distribution structure, but this is a Spring because right afterwards price immediately returns to the TR and the Test Spring phase with small volume shows sellers have weakened.
- Price goes up, exceeding the Creek with strong rising candles. The position to open a position is the retest of the Creek with decreasing volume (LPS).
Accumulation Type 2: Without a Spring
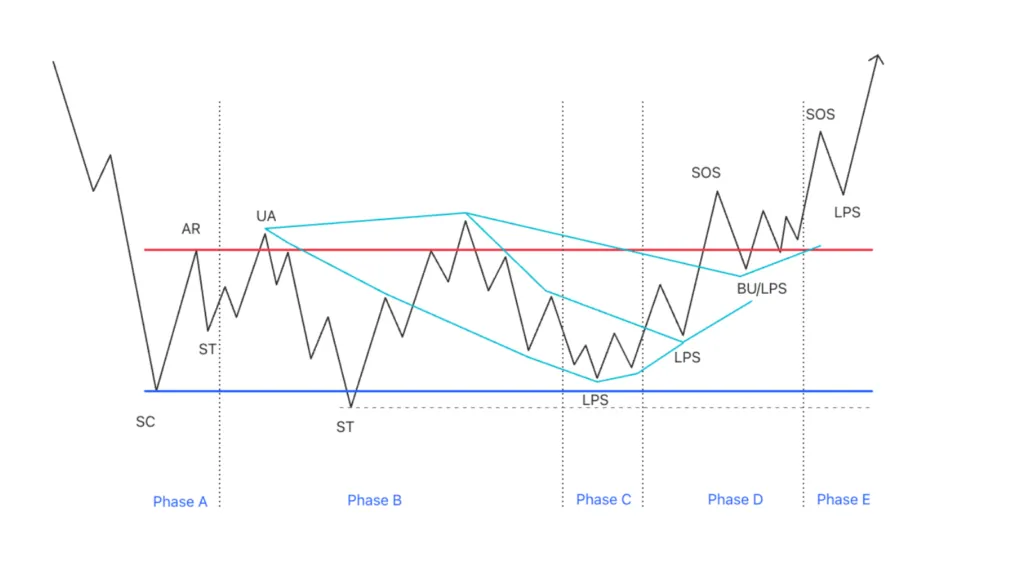 Figure 3: Accumulation structure with LPS
Also a common form of accumulation structure. Characteristics:
- The trading volume characteristic is similar to Type 1.
- The Phase C construction has no Spring; price does not go down to touch the lower edge because supply has been depleted.
Example of supply absorption in WDC stock without a Spring:
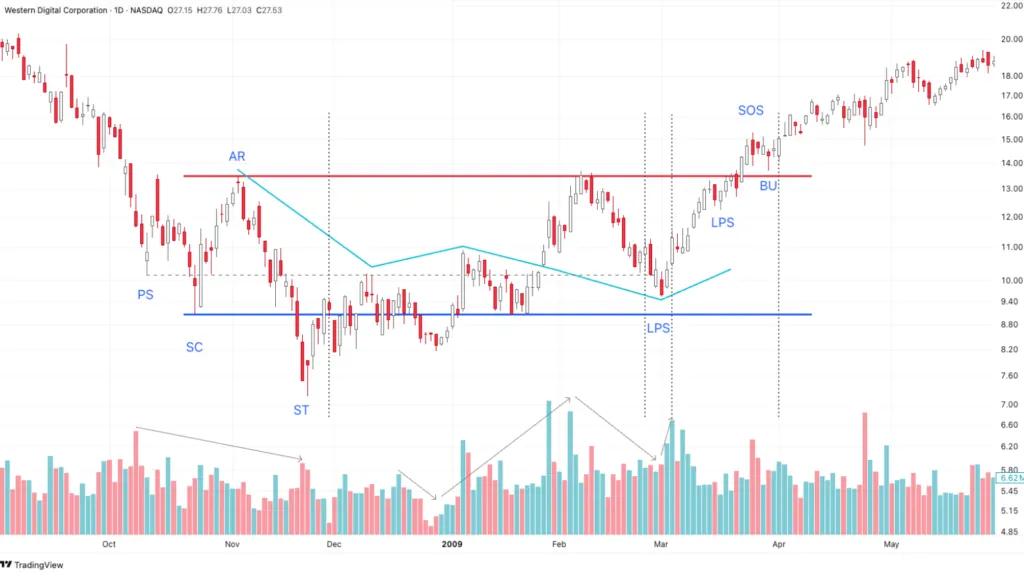 Figure 4: Accumulation structure without a Spring in WDC stock
- Trading volume at PS is high but decreases at SC and ST, showing sellers are exhausted.
- This structure shows buyers absorbing supply at a price level below PS when price lies below PS for a period of time with gradually decreasing volume, then suddenly rises with a strong candle.
- Price rises to test the upper edge of the TR with strong rising candles together with high increasing volume, showing the control of the buyers.
- Detect a potential LPS in Phase C when the falling swing has gradually decreasing volume. This LPS point also has a lower price than PS, where the CO absorbed supply beforehand, suggesting this is a supply test.
- We can draw a Creek line here after price rises from the potential LPS with high increasing volume. The entry point is after a strong rising candle with a closing price close to the upper edge.
The example above shows the importance of PS. Detecting that the CO wants to absorb below the PS price level is very important for determining bias.
Next we will study other accumulation patterns for reference purposes.
The cause of variations may be due to news factors or the CO's misjudgment of potential supply, causing absorption not to occur as expected and price having to seek local TR areas instead of absorbing at the main TR.
Variation Type 1: Inverse Head and Shoulders pattern
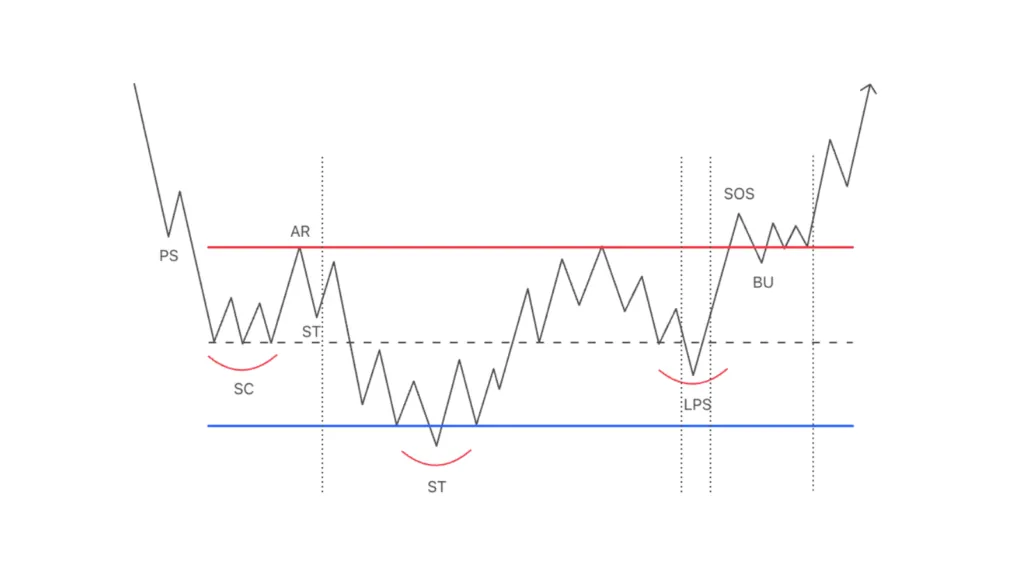 Figure 5: Head and shoulders accumulation pattern
This is the familiar head and shoulders reversal pattern. Depending on the length of ST in Phase B, there are some other names such as the cup and handle pattern, the holy grail, … Characteristics:
- Price weakens right from Phase A when there is no demand, causing Phase B to fall deeper than usual.
- The lower edge of the TR is drawn through the lowest point of the structure instead of SC.
- ST in Phase B lies in a local structure below the support line drawn from SC.
- LPS in Phase C may be a shakeout of the local structure above.
Example of the NZD/USD pair with an inverse head and shoulders accumulation pattern:
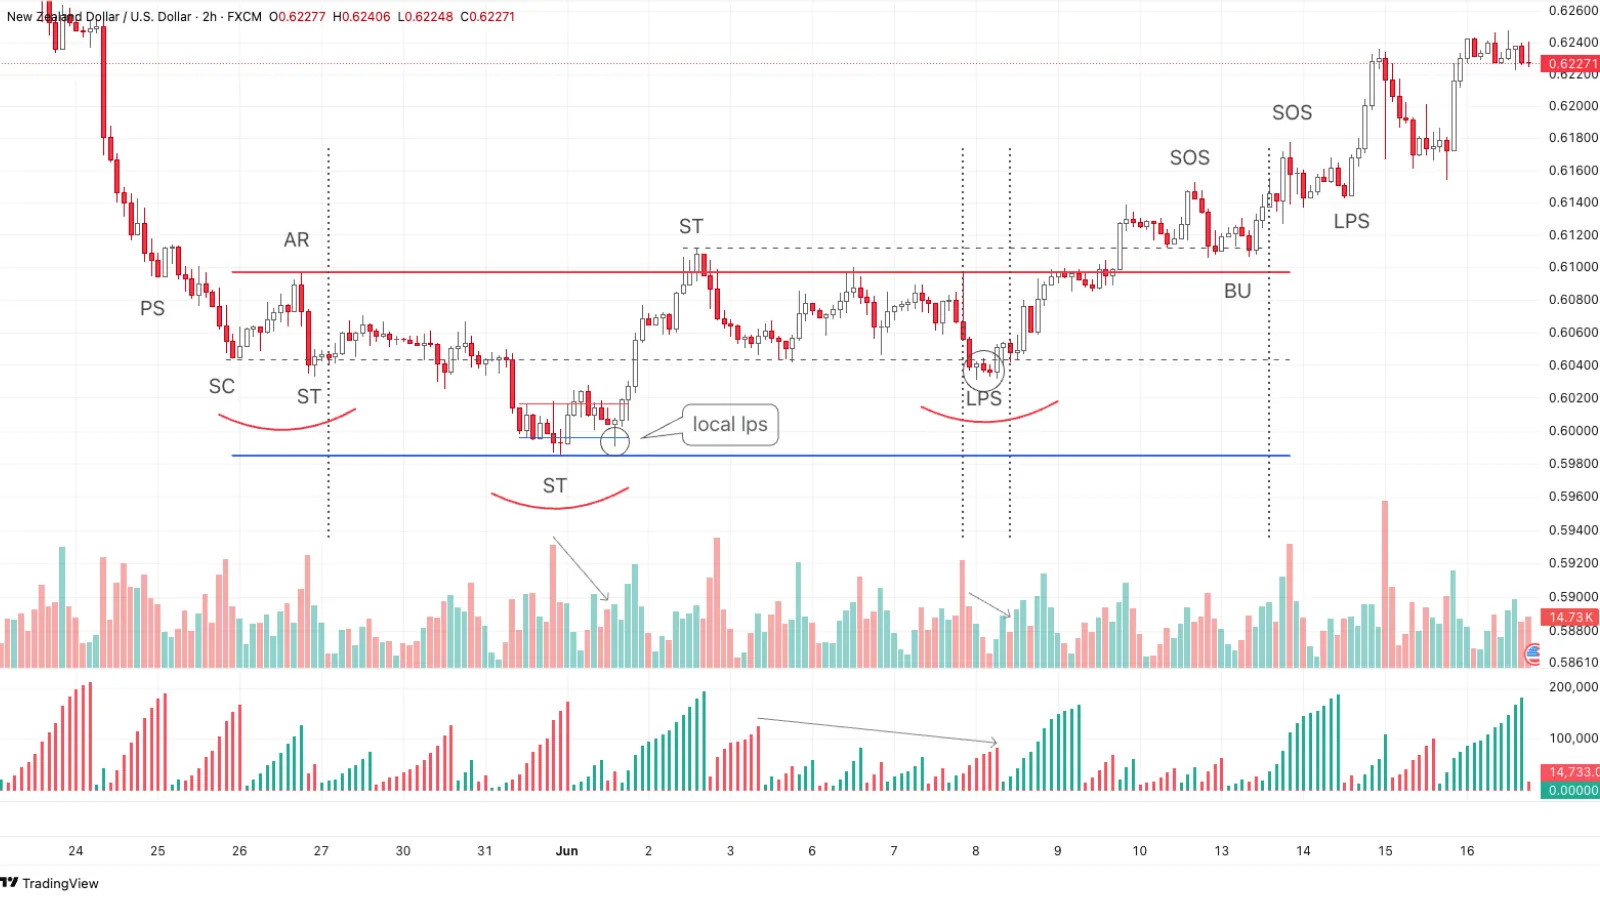 Figure 6: Inverse head and shoulders accumulation pattern on the NZD/USD pair
- Price does not respect the TR created by SC & AR but falls sharply, breaking through the lower edge into Phase B, then forms a local accumulation structure with volume gradually decreasing toward the end (Local LPS with low volume).
- Price breaks through the local TR and goes up to retest the upper edge ST, then falls to create a shakeout phase through a borderline drawn from SC, showing this is a potential LPS.
- At the potential LPS, volume decreases sharply, proving supply has been depleted; a strong rising candle appears with high increasing volume, suggesting opening a buy position.
Variation Type 2: Continuing Weakness pattern
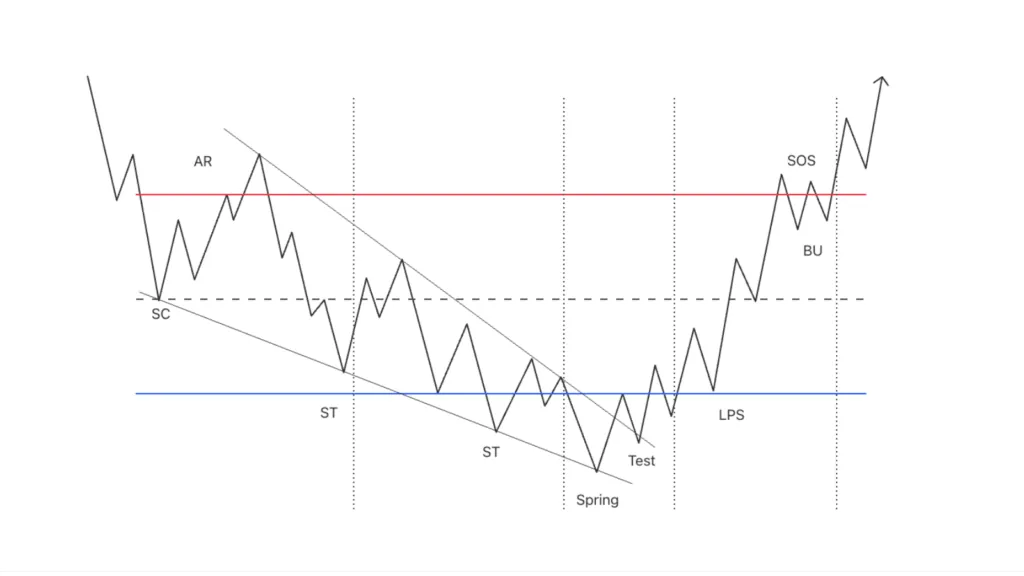 Figure 7: Accumulation structure in a falling wedge pattern
This pattern is called Continuous Weakness Trading Range or the falling wedge pattern. Characteristics:
- The pattern shows continuing weakness of demand as price is compressed in a falling wedge.
- The third CHoB is created after price falls sharply through SC and price cannot return to the upper edge, making the TR impossible to draw in the usual way.
- Absorption occurs inside the wedge.
- Demand appears after a breakout out of the wedge, pushing price rapidly up to the upper edge.
Example of an accumulation structure in a two-converging-lines pattern on the SP500 index:
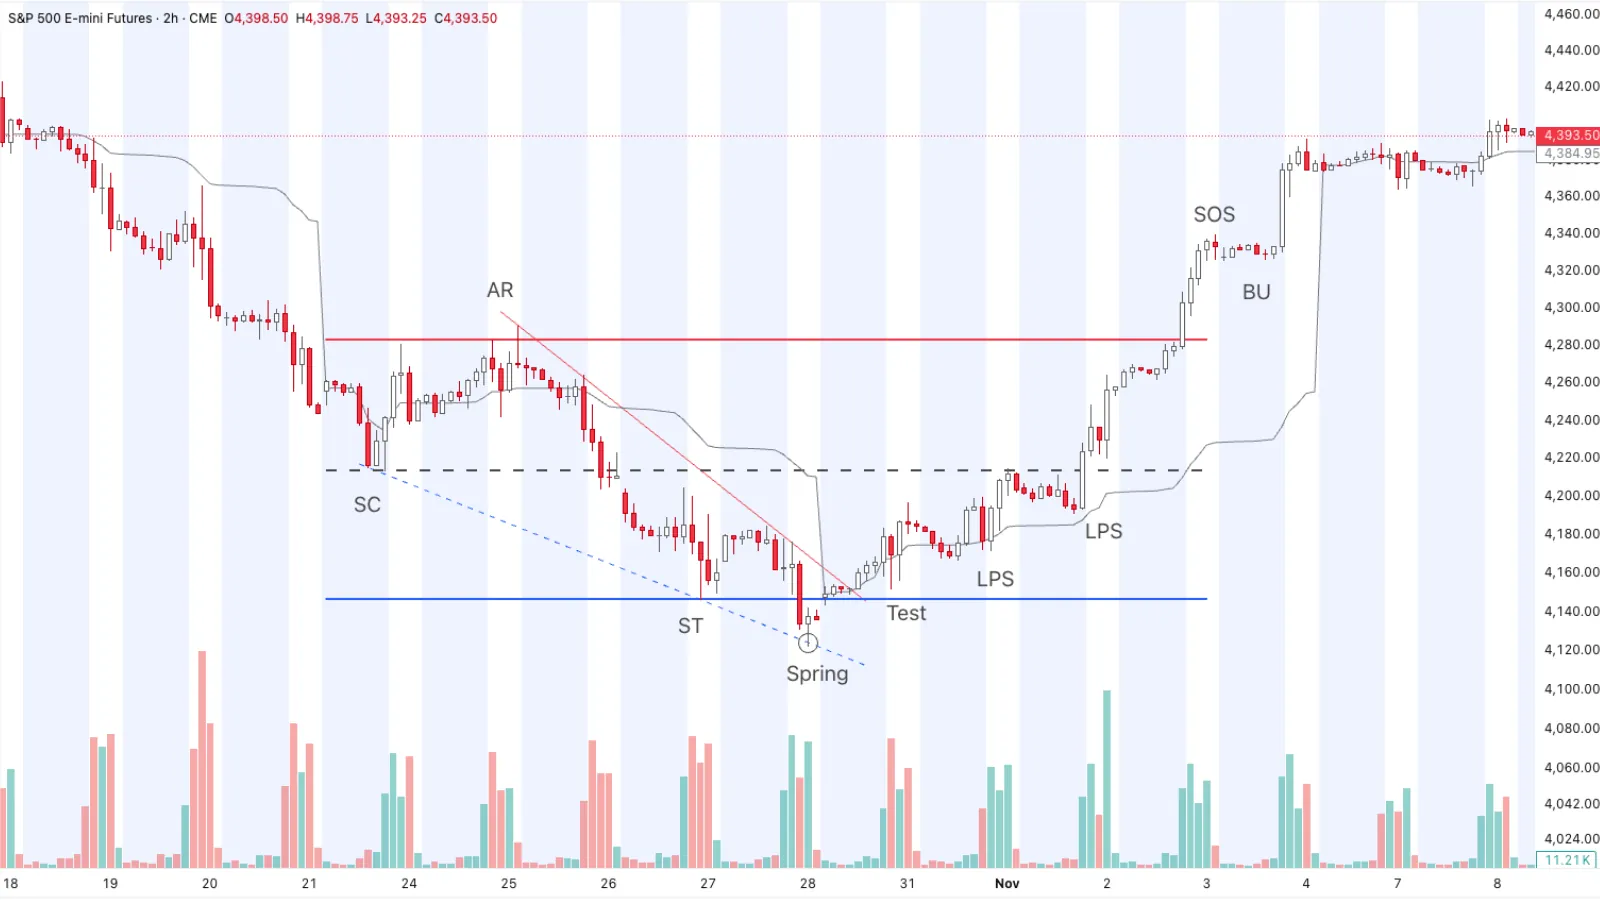 Figure 8: Accumulation structure in a falling wedge pattern on SP500
- Price goes within a falling wedge created by two converging lines including: a reversed demand line and a forward supply line.
- Price is compressed in the wedge, with red volume accounting for the majority. At the end of the wedge and when it breaks out upward out of the wedge, green volume only then appears.
- LPS are created with small volume showing an absence of supply.
- The VWAP line acts like a support line at LPS positions, suggesting opening a buy position (the VWAP indicator will be mentioned in later parts).
Variation Type 3: Advanced Absorption
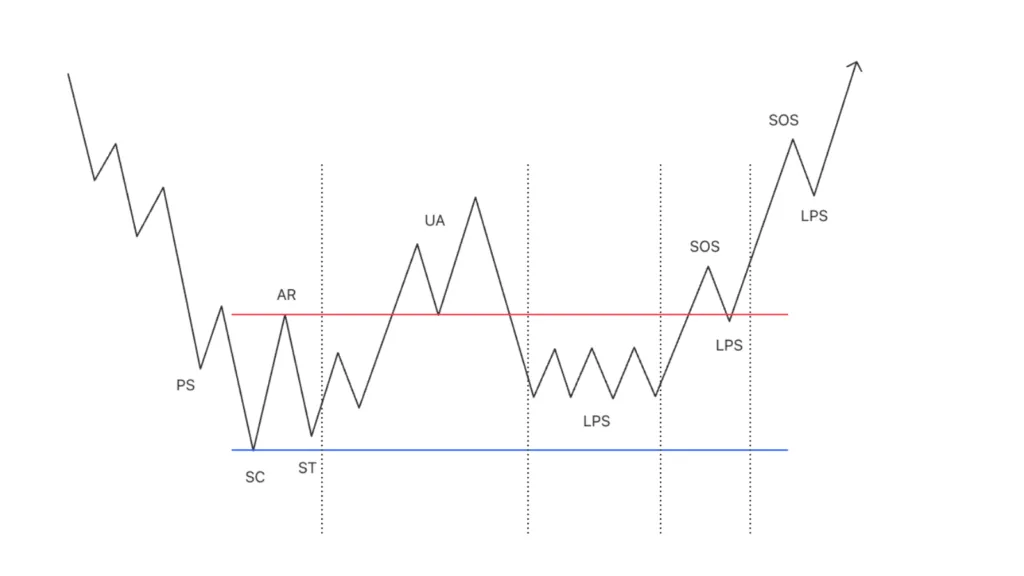 Figure 9: Accumulation structure in an advanced absorption pattern
This pattern has a rather flowery name: Advanced Absorption pattern (Absorption at higher level Trading Range). This can be considered a double-bottom pattern — a familiar reversal pattern.
Characteristics:
- Price still respects the TR drawn from SC & AR; however, demand shows strength pushing UA higher than usual.
- At UA there may be a small local distribution structure.
- Price from UA turns back into the TR to absorb all the supply in here without reaching the lower edge.
Example of an advanced absorption accumulation pattern on the NZD/USD pair:
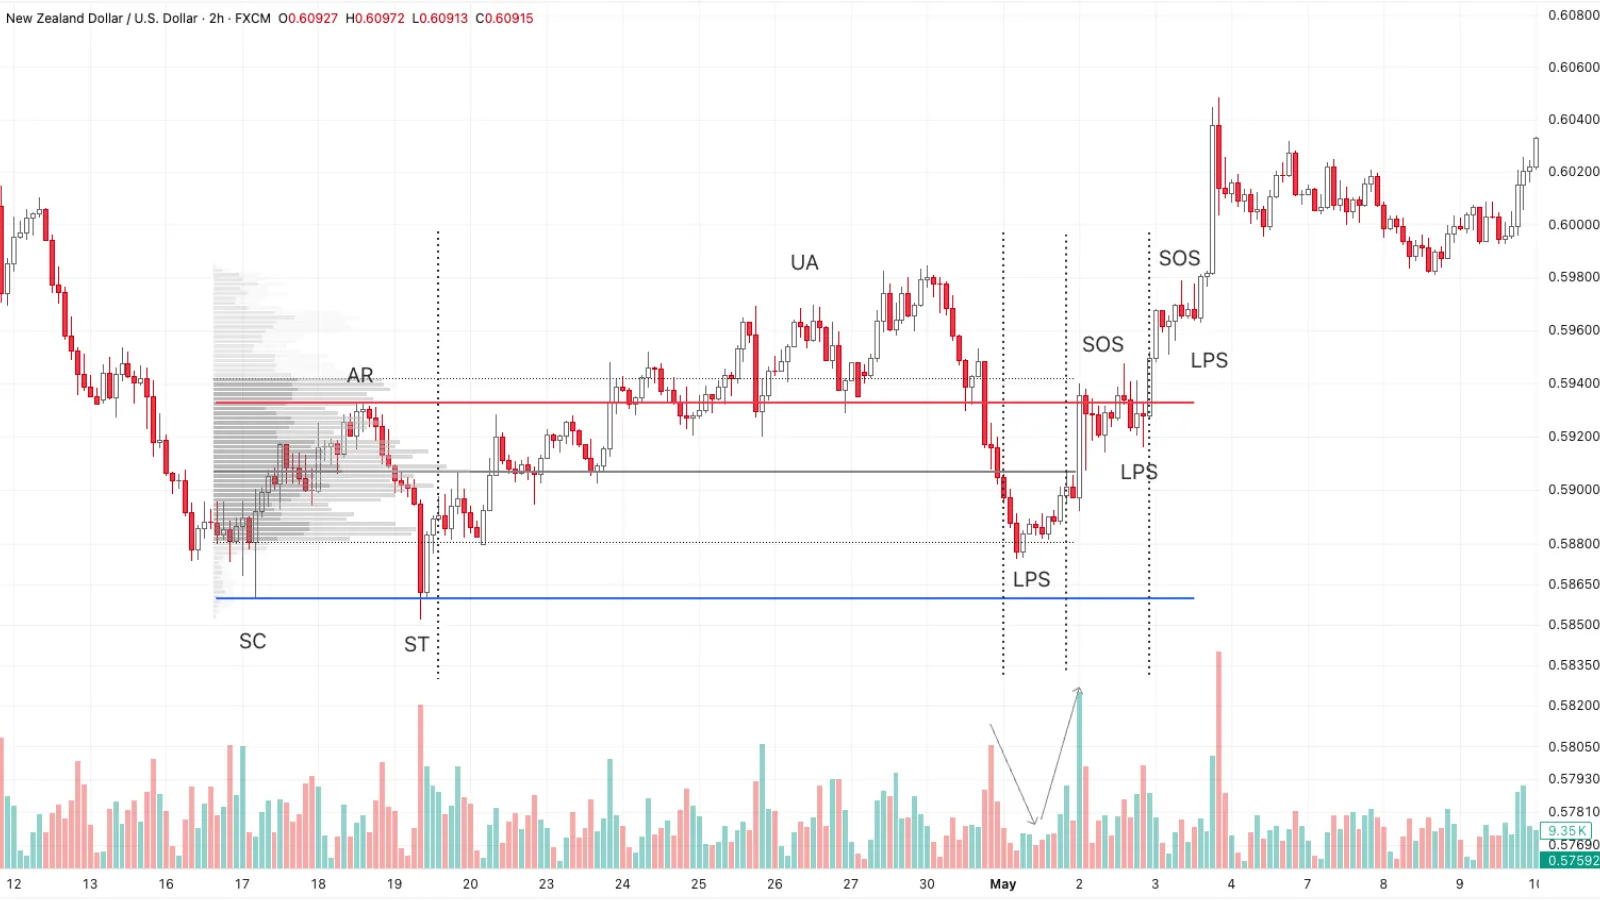 Figure 10: Advanced absorption accumulation structure NZD/USD
- We see volume from SC to ST increases, showing supply is still plentiful. However, afterwards price does not continue to fall but rises to the upper edge, showing that volume at ST is mostly the hidden demand of the CO that absorbed all the supply there.
- At the top of the local structure in the UA area, shortening of thrust appears and demand volume gradually decreases, signaling price stops rising (Law of Effort versus Result).
- Price falls back into the TR with high volume, then gradually decreases but does not touch the lower edge.
- Here, price does not break through the VAL area of Volume Profile but turns back.
- Determine this is a potential LPS in Phase C because price rises again with increasing volume, breaking through the POC of Volume Profile.
- A safe entry point is the LPS after a strong rising candle.
Variation Type 4: Accumulation with Strength
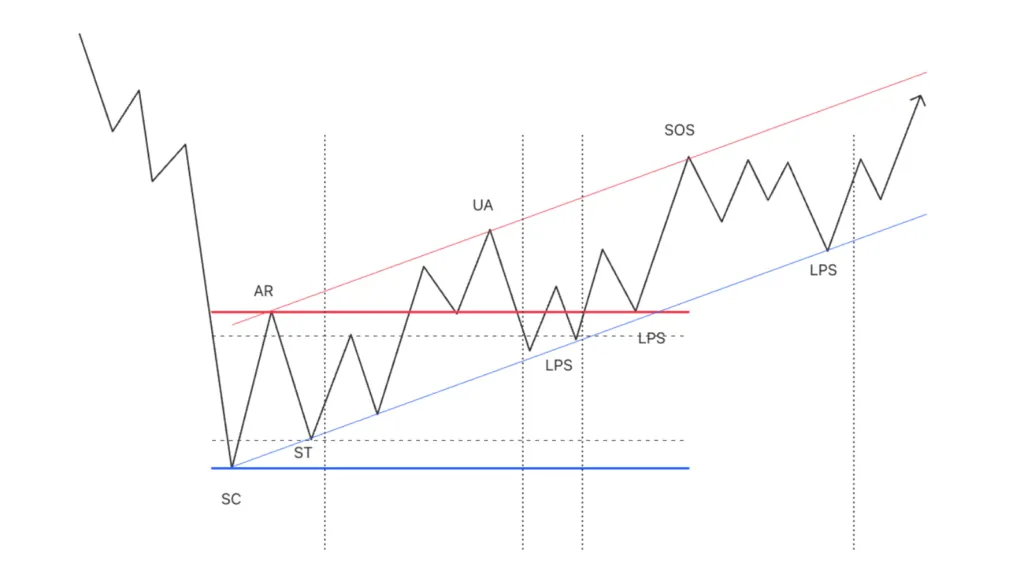 Figure 11: Accumulation structure with outstanding strength
This is the Extra Strength Trading Range pattern; price lies in a rising price channel (or bull flag), even stronger than the advanced absorption pattern. Characteristics:
- After a sharp decline phase and a long candle wick at SC, price recovers and goes up creating higher highs and higher lows.
- A rising price channel forms right from the beginning.
- Absorption occurs in the intersection area between the price channel and the TR.
Example of an accumulation structure showing strength in XAU/USD:
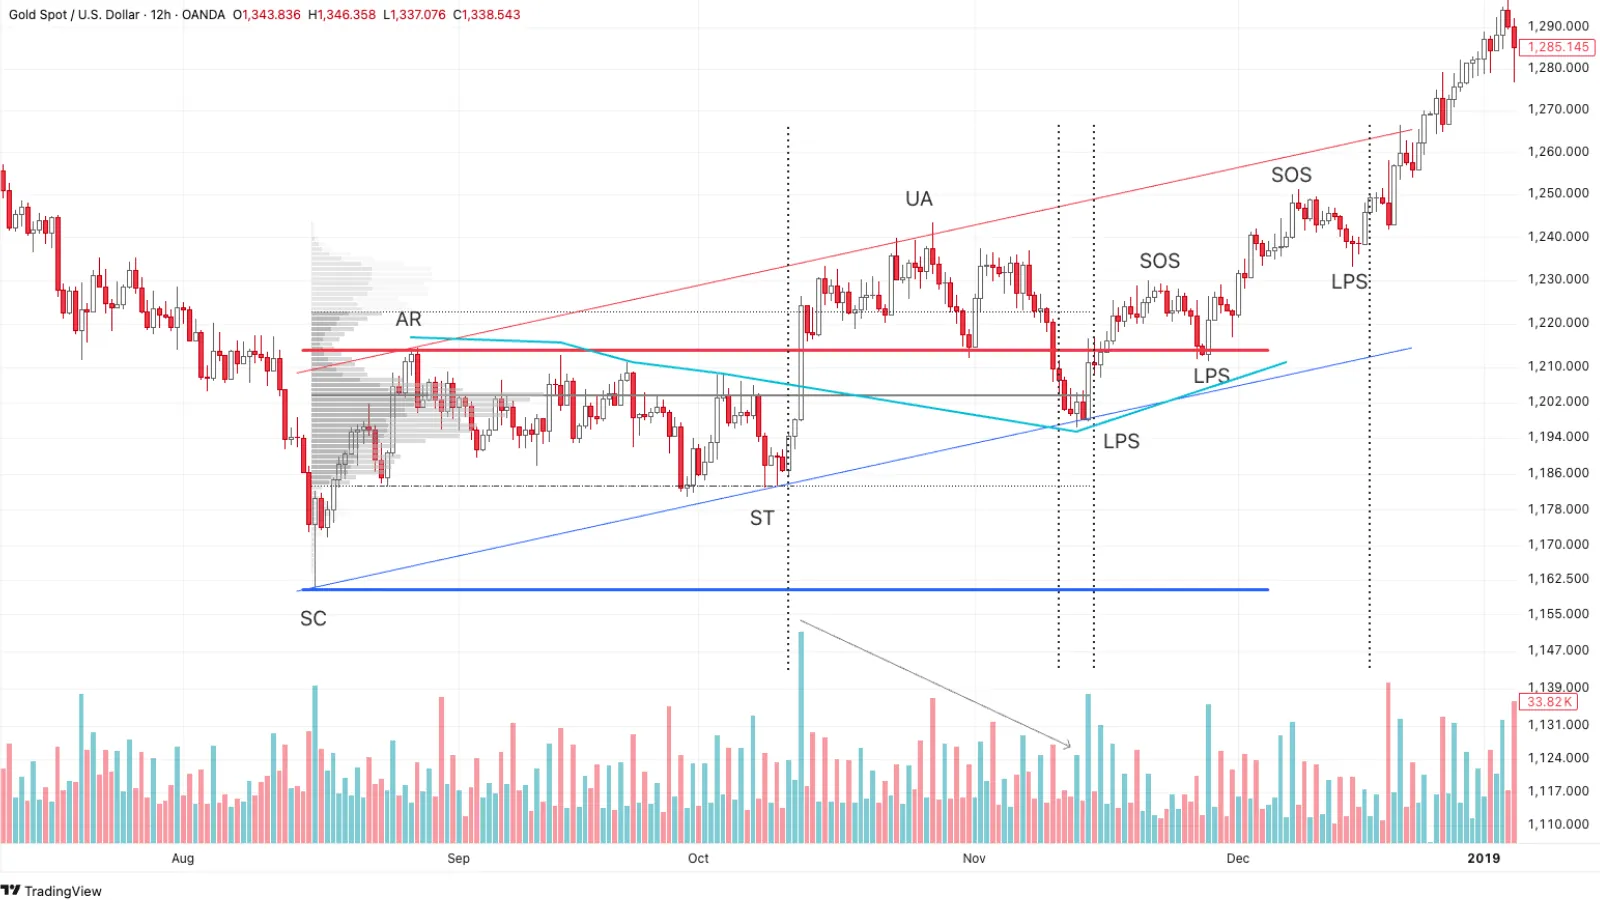 Figure 12: Accumulation structure with strength XAU/USD
- After there is a strong demand supporting price at SC, gold price goes within a rising price channel instead of a sideways range, showing that buyers are in control.
- The rising price channel is determined from the three points SC, ST, AR.
- At the moment price from UA enters back into the TR and touches the demand line, this is the intersection area between the TR and the price channel. Observing that volume decreases in this area, it may be a potential LPS in Phase C.
- At the LPS, it is also the confluence between the Volume Profile POC and the demand line. We can draw the Creek here.
- A strong rising candle afterwards rises above the POC with high volume; however, price stops at the upper edge line of the TR, making investors hesitate and not dare to enter an order.
- A suitable entry point is the second LPS when price returns to test the upper edge with low volume.
Variation 5: Rounding Bottom pattern
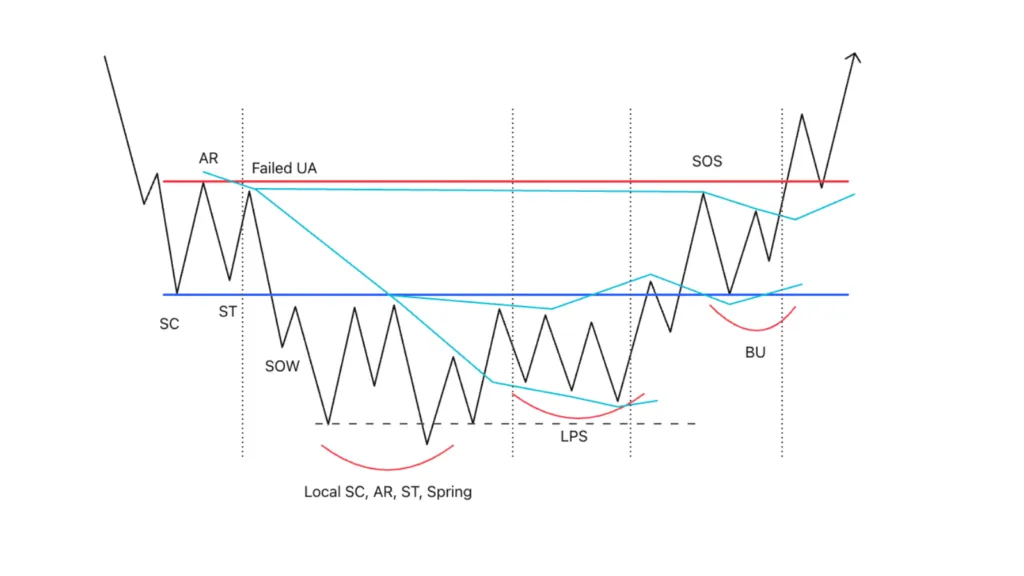 Figure 13: Rounding bottom accumulation structure
This pattern is also called the U shape, saucer, round disc pattern, rounding bottom pattern…
Characteristics are similar to the shape of an inverse head and shoulders or continuing weakness, but the absorption of supply occurs mainly in the local structure below the main TR.
This variation is not frequently encountered and is easily confused with an inverse head and shoulders.
Example of a rounding bottom accumulation pattern on the XAU/USD pair:
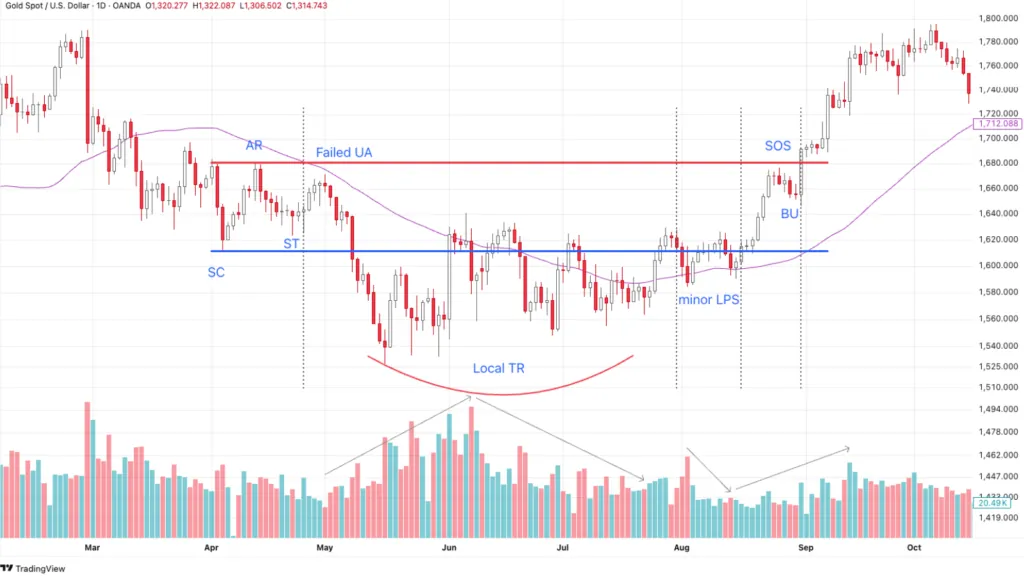 Figure 14: Rounding bottom variation XAU/USD
- Price does not hold within the TR but falls to create a local TR below with gradually increasing volume showing supply is dominating.
- However, volume gradually decreases toward the end of Phase B, showing signs that supply absorption is taking place in the local structure.
- Potential Phase C has an LPS test with high volume, followed by a test with low volume showing supply depletion. We can open a position at this test phase.
- The SMA50 line is also a support line at the LPS; price pushes back up to the main TR quickly, causing those who have not yet opened a position to miss the order.
Besides the forms above, we also have diagonal Trading Range variations that will be studied separately in later parts.
Note: Do not try to mark all the events and phases of variations. Instead, look for a potential Phase C and observe price action to be flexible in determining bias.
Variations are essentially the joining together of ordinary TR structures. We can completely analyze each local structure individually if we do not recognize which form is developing.
5/5 - (3 votes)
Read structure 10x faster with JUKA
JUKA maps SMC structure — swings, BOS, CHoCH and inducement zones — automatically on any TradingView chart. No more hand-drawing structure for hours.
Get JUKA — $150