Wyckoff Part 7: The Distribution Phase
What is the Wyckoff distribution phase?
Distribution in Wyckoff is the process of transferring inventory from the CO — who holds a large amount of supply during the Accumulation phase — to the public at the top areas of the Distribution phase.
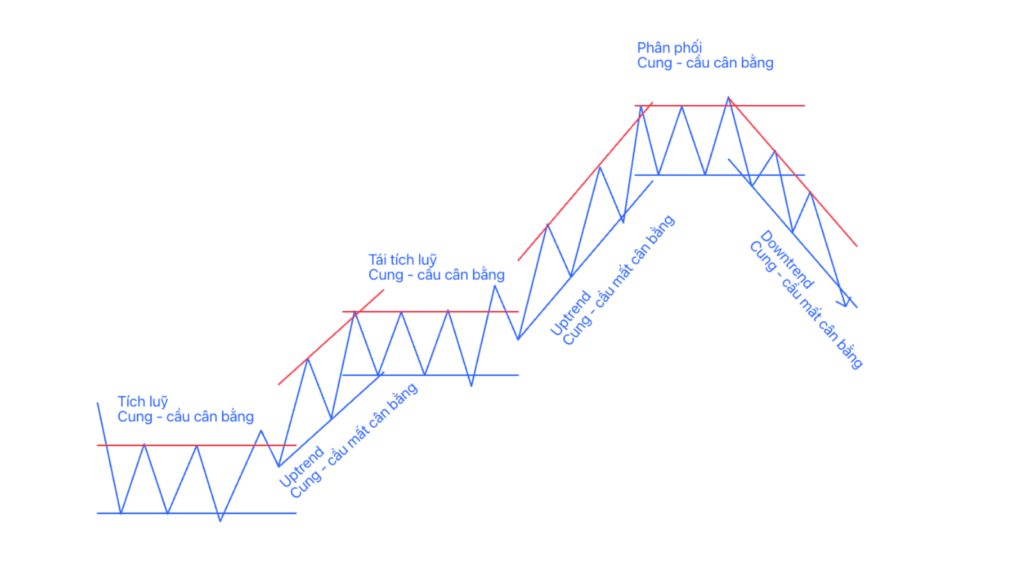 Figure 1: How the distribution phase is formed
The process is as follows:
- At the accumulation phase, the CO has collected enough inventory from the public, and when there is no one left to sell, price rises easily.
- When price is in an uptrend, profit-taking pressure appears and the CO stops to consolidate their position. That is the re-accumulation phase.
- They re-collect the supply being sold by the public, and when there are no sellers left, price rises easily again.
- At some point, price runs far enough to reach its target (according to PnF), which can be seen by overbought conditions. Here, the CO plans to take profit carefully.
- They sell the inventory they hold to the public stealthily at the top areas of the structure. This selling requires great skill so that price does not fall until the CO has distributed all their inventory.
The Wyckoff distribution structure
We studied the uptrend in part 6: The Re-accumulation Phase.
Basically, the beginning of a distribution structure is no different from a Re-accumulation structure; both originate from the stopping of an uptrend.
There are two common forms of distribution structure: distribution with UTAD (Distribution with UTAD) and distribution without UTAD (Distribution without UTAD).
 Figure 2: Distribution with UTAD
 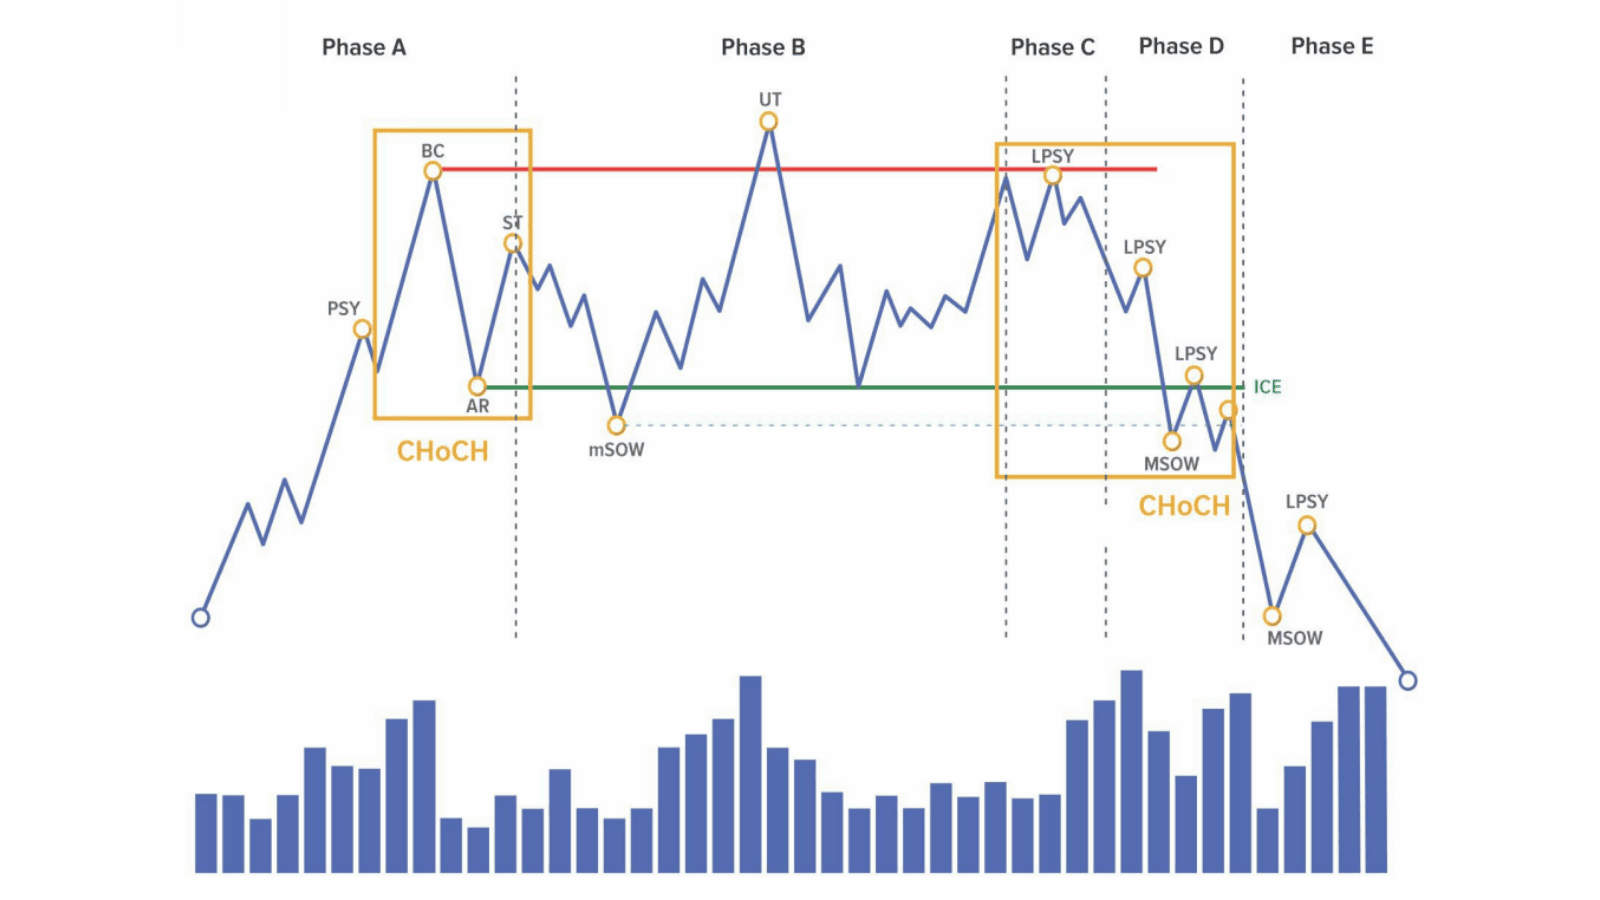 Figure 3: Distribution without a Spring
During the distribution phase, the CO will always try to sell whenever price touches the upper boundary, and stop selling when price returns to the lower boundary (except for SOW).
Even at the lower boundary, the CO will buy to push price up, then sell again when price touches the upper boundary.
Reading the tape based on the law of effort versus result will help us detect the sophisticated selling plans the CO carries out inside the TR.
Phase A: Action stopping the uptrend
When price reaches its PnF target, the uptrend will stop. This is the result of the cause built from the previously accumulated equilibrium zone.
Distribution phase A has events similar to the re-accumulation phase, and is the inverse of accumulation phase A.
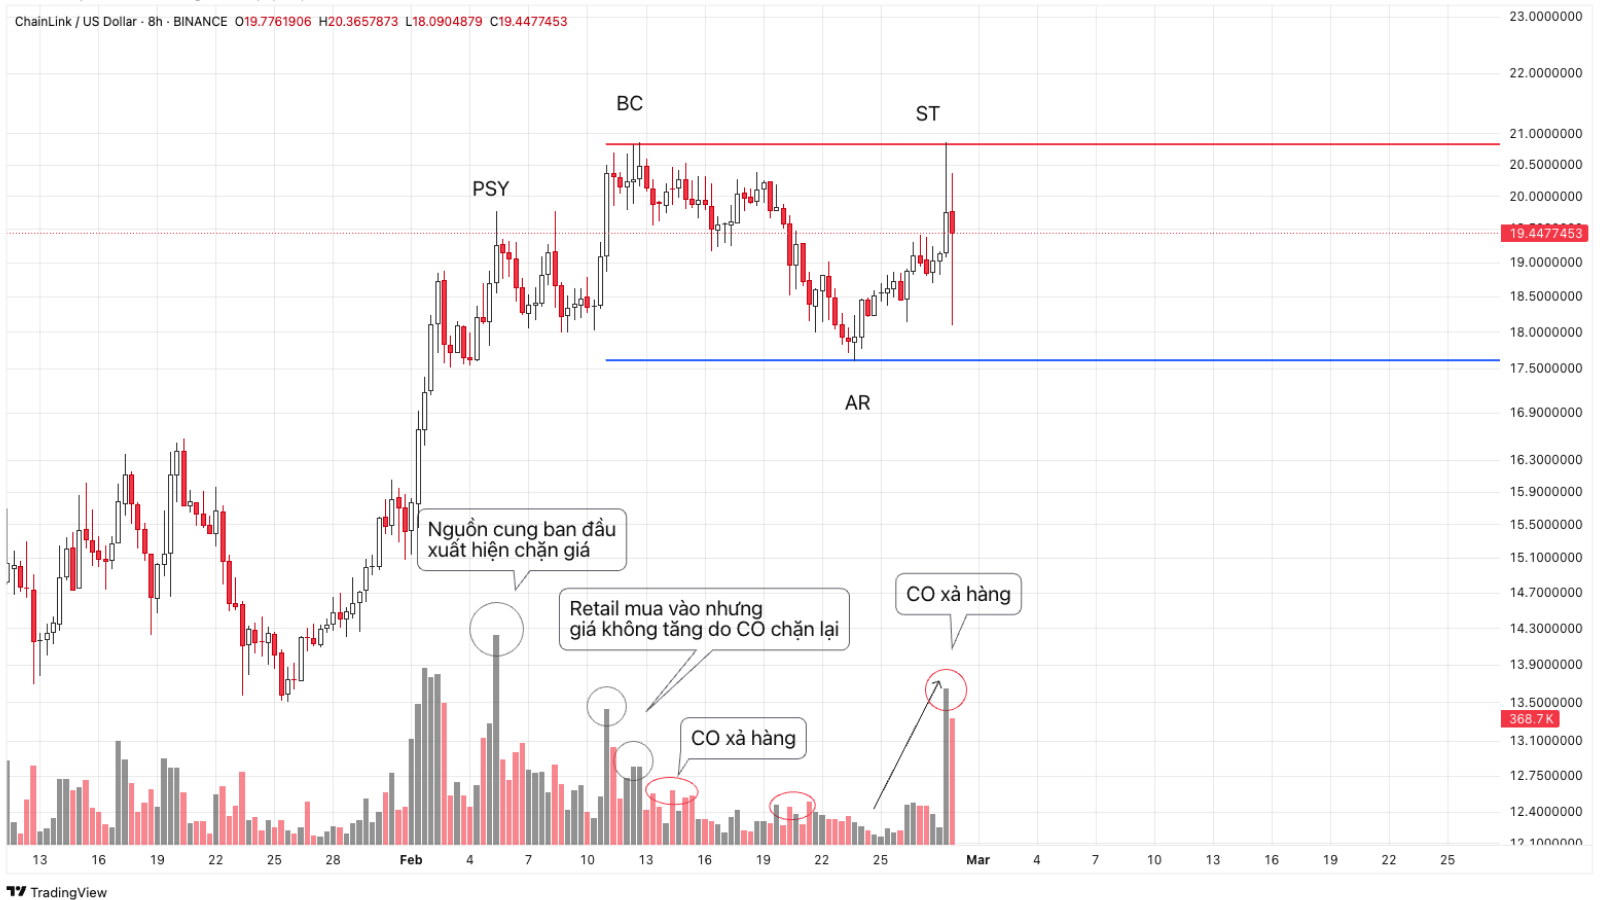 Figure 4: Phase A of the distribution phase
PSY (Preliminary Supply)
At the end of an uptrend, demand mainly comes from buying by the public.
PSY is supply that appears to weaken the upward momentum, only strong enough to stop price from rising in the short term.
PSY has large volume, showing the sellers' effort to block price.
Note that if PSY is strong enough to halt the uptrend, it will become BC.
BC (Buying climax)
Supply at PSY fails to stop price from rising; buying momentum continues, causing price to keep breaking above the PSY high.
Price continues rising until it meets extremely large supply from the CO, halting the rise.
BC can end in two ways:
- A strong explosive rise with large range and very large volume. Consecutive rising candles create excitement for the public to buy in.
- If at PSY supply already absorbed most of the upward momentum, then at SC volume may be small accompanied by small candle range, showing buyer exhaustion.
BC will be even easier to detect if it is positioned outside the along-trend/reversed rising trendline.
AR (Automatic reaction)
After the uptrend is mostly absorbed by the CO at BC, price corrects down sharply, suddenly and clearly.
This shows the CO's active distribution. The inventory they absorbed throughout the previous accumulation process will be sold in large quantities here.
The change of behavior from BC down to AR is notable and easily visible to the naked eye on the chart.
That is the first CHoB.
The lowest low of AR is the price level at which the selling of the previous inventory stopped; demand appeared here and pushed price up, marking the future support low.
ST (Secondary test)
ST is a recovery rally back around the BC high with the purpose of retesting demand from the public.
This change of behavior from falling to rising is the second CHoB.
At the ST high, reversal candles appear with large volume and it remains at a high average level when falling.
If this rally stops around the BC price level and falls back afterward, this is the third CHoB.
3 CHoBs = CHoCH, price officially changes character from an uptrend to trendless (sideways).
This means price is standing at a crossroads: a distribution or a re-accumulation formation.
A Trading Range drawn parallel through SC and AR represents the range in which price will fluctuate in the following period.
Phase B: Building a cause
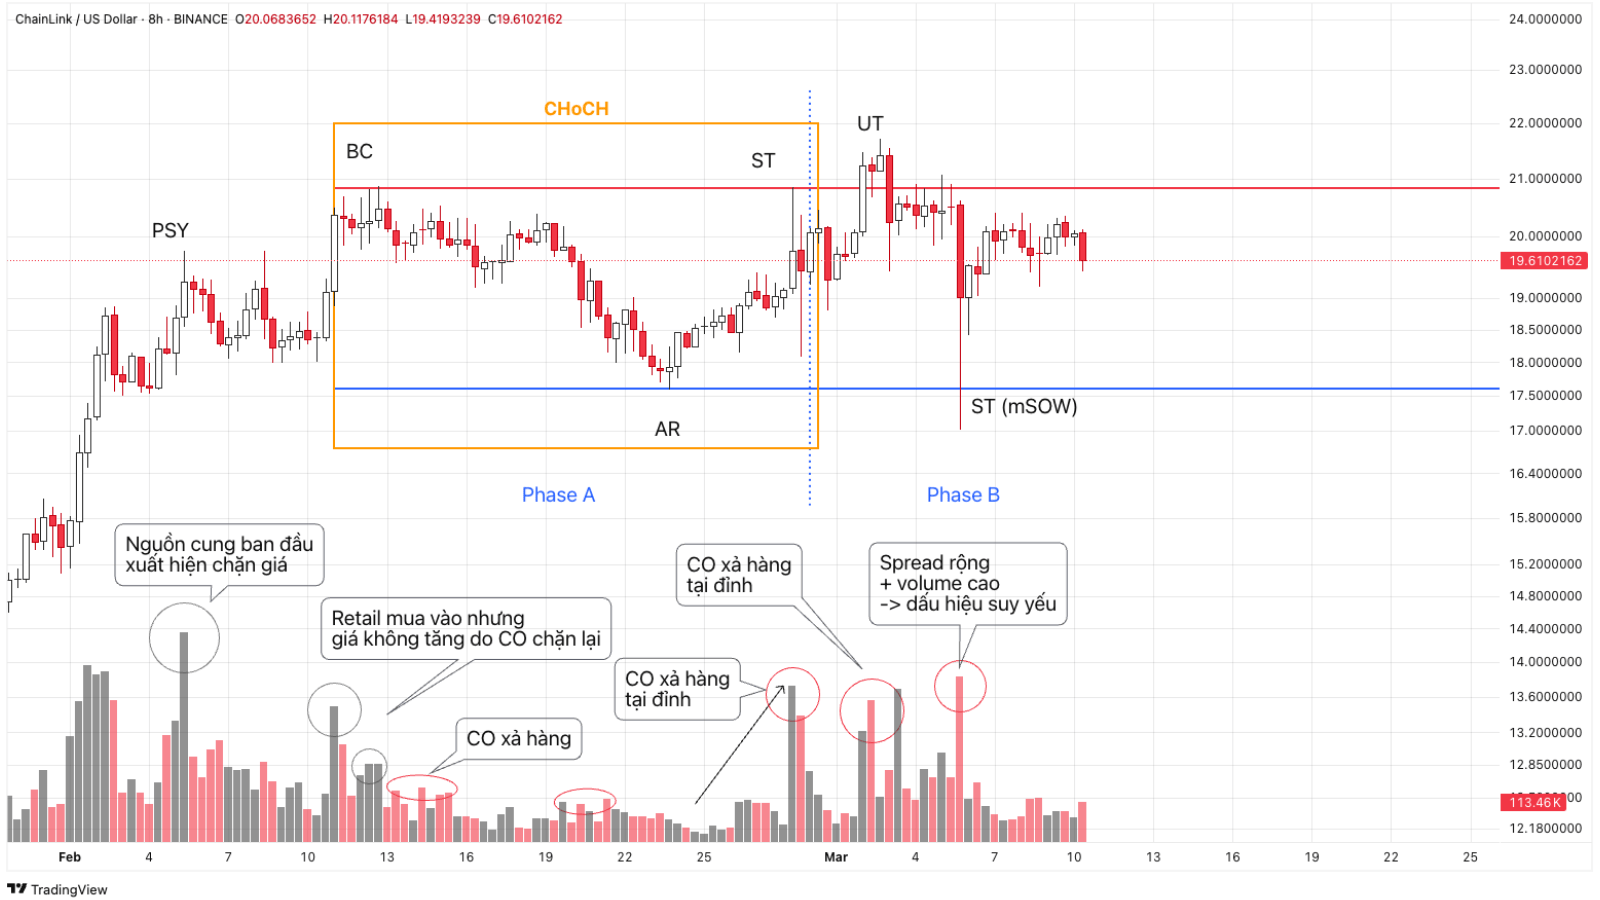 Figure 5: Phase B of the distribution structure
In phase B, price fluctuates within the TR drawn from BC and AR to build a cause.
Distribution phase B is similar to the accumulation phase; price will test the upper and lower boundaries to test demand.
The ST sessions in phase B will repeat; these are rallies rising from near the support line to the resistance line.
Phase B of the distribution process has characteristics similar to the accumulation phase, except that clues appear showing the supply-demand balance shifting toward supply.
UT (Upthrust): Bull trap
UT is a more extended form of ST; the UT event is when price makes a false break up through the upper boundary of the TR.
Price rises above the old BC high to attract retail buying, then the CO sells actively, making price quickly fall and leaving them unable to react.
Around UT, volume will be large because the CO is "stealthily distributing"; volume continues to stay high until price returns to the lower boundary of the TR.
mSOW (minor Sign of Weakness)
After an ST or UT, price falls sharply and pierces the lower boundary of the TR accompanied by wide range and high volume.
This is the mSOW sign of weakness. If the mSOW event appears early in phase B, it proves supply is dominating demand (supply > demand).
Phase C: Test
Phase C is the final testing phase before the markdown phase begins.
When the high is tested successfully, price begins to fall continuously and strongly with loose (fast) movement.
The final Test action is the main focus of phase C.
Phase C may have a UTAD or an LPSY, depending on the market's supply and the CO's intent.
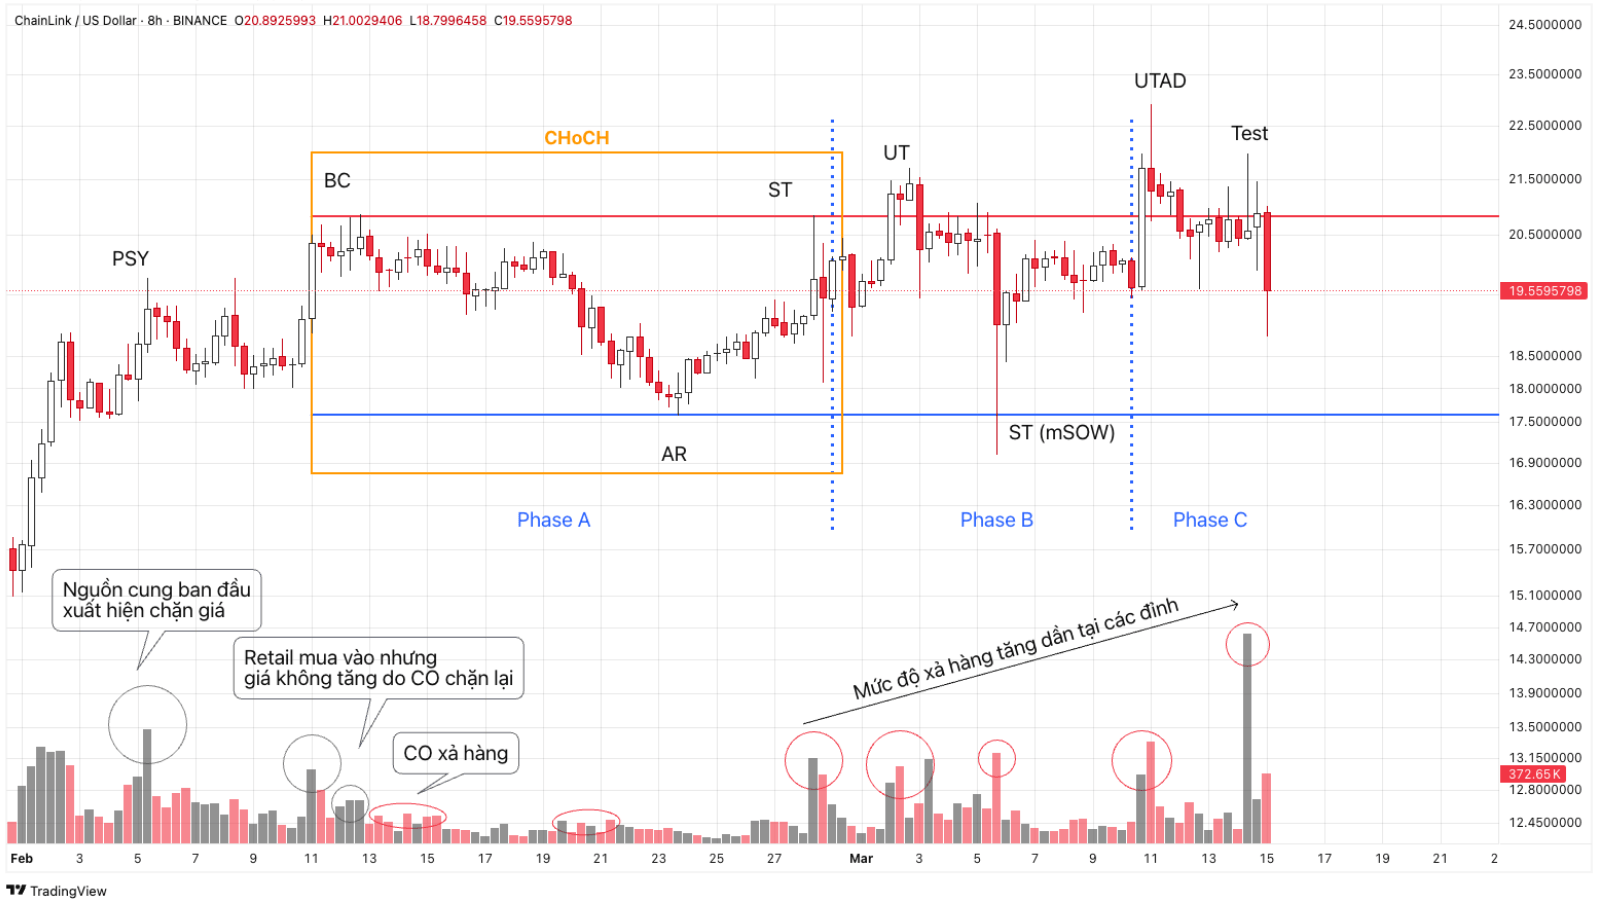 Figure 6: Phase C of the distribution structure
UTAD (Upthrust after distribution)
UTAD is a test in the form of a false break up to the highest high of phases A and B (the opposite of the Spring in accumulation).
UTAD is typically characterized by a strong increase in price range and high buying volume, pushing price to surge and break the high.
This is a bull trap that triggers the public's buying psychology. Afterward, price range gradually narrows, showing buyer exhaustion.
Killing two birds with one stone, UTAD causes the following two groups to get their stop losses hit:
- Short sellers at the resistance boundary.
- After the break, price falls back into the TR, triggering the stop losses of those who bought the breakout before.
UTAD allows the CO to distribute inventory at the highest prices into the hands of the public.
After UTAD is a UTAD test session, which is a suitable place to open a sell position with a stop loss placed above UTAD.
LPSY in phase C (Last point of Supply)
In the case where price does not rise above the high to create a UTAD, price will create an LPSY.
This is price action attempting to rally up to the boundary but failing.
The LPSY event is characterized by the rally from the low area appearing weak with narrow price range, overlapping, and gradually decreasing buying volume.
Weak buying shows that demand has weakened after the CO's distribution rounds at the previous STs.
After a UTAD or LPSY, buyers are exhausted and price is ready for a sharp, fast decline.
This is a notable change of behavior (the first CHoB).
Phase D: Downtrend inside the TR
After testing in phase C shows the weaknesses of demand, supply begins to gradually increase as we move to phase D.
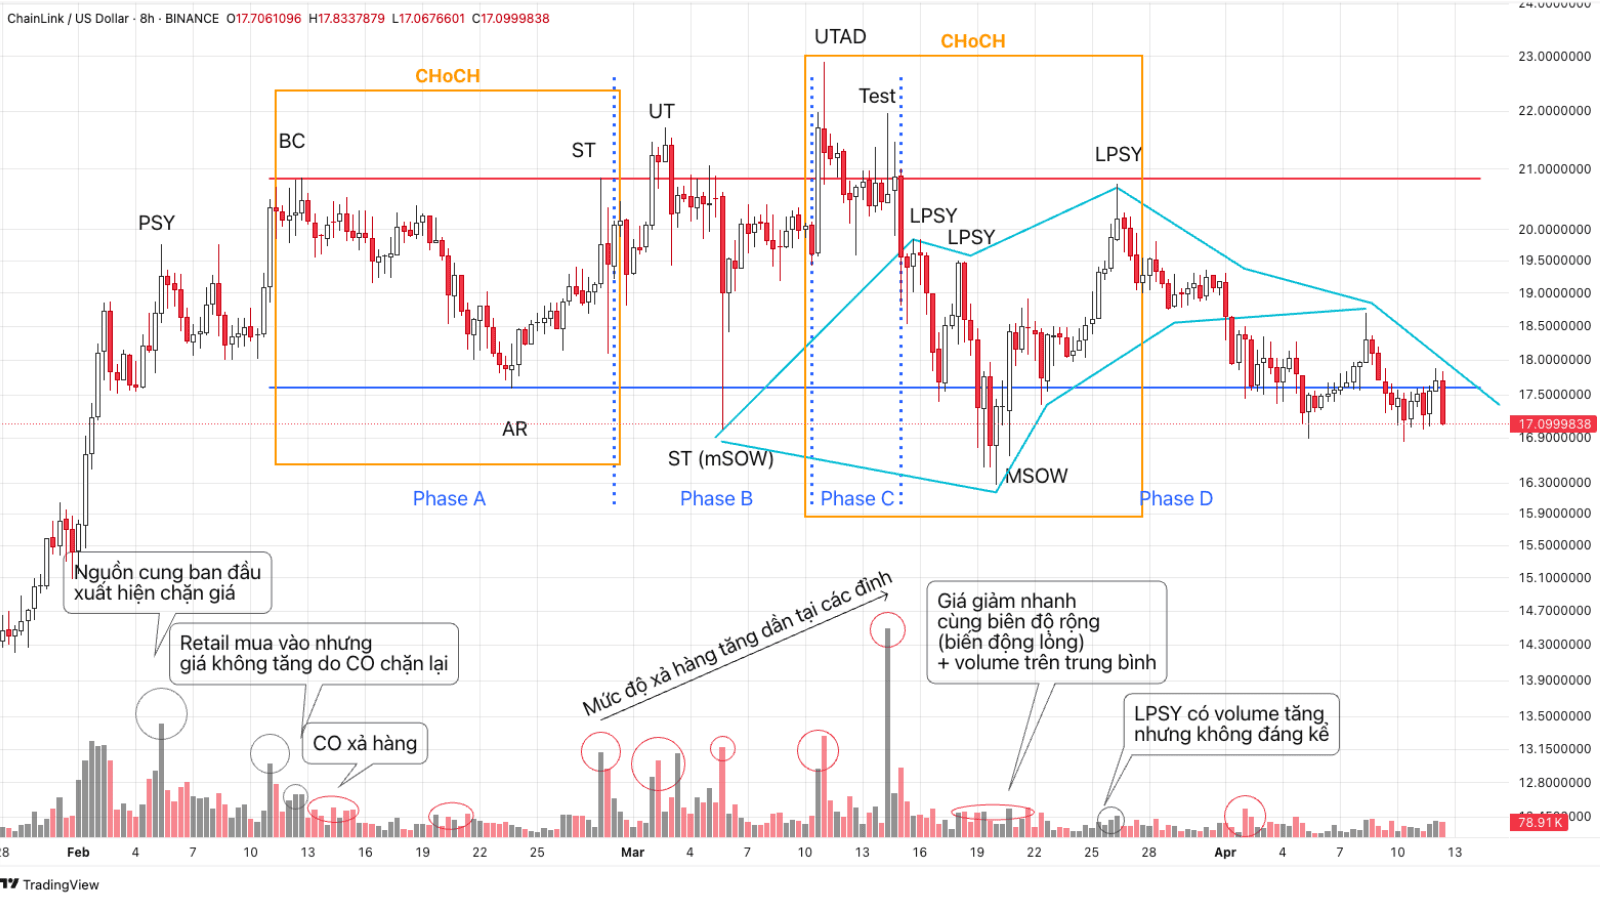 Figure 7: Phase D of the distribution structure
MSOW (Minor Sign of Weakness): Major sign of weakness
MSOW is the event where price falls easily to the lower boundary of the TR accompanied by large volume and an increasingly large movement range, while the recovery rallies (LPSY) have small volume.
The Ice is a metaphor similar to The Creek in the accumulation phase.
The ice sheet symbolizes demand acting as a support line, drawn by connecting the lows of the swings inside the TR together.
Price punching through the ice symbolizes The Ice changing from demand to supply. Price easily moves loosely and falls steadily below The Ice.
MSOW or mSOW is easily confused with a Spring in the Re-distribution phase because it all lies below the demand line of the TR.
Following the ice break is a light recovery returning to the surface of the ice sheet. This is the second CHoB.
LPSY in phase D
LPSY is a recovery rally that returns but fails because it meets final supply pressure at The Ice.
The ice sheet at this point changes from demand to supply and becomes hard resistance.
This may be the CO's final distribution round before the real Downtrend begins.
Price no longer has momentum to return to the upper resistance zone; volume at LPSY decreases accompanied by narrow, overlapping range, showing buyers are exhausted.
After retesting The Ice, price continues the downtrend with loose movement (falling strongly & quickly) and gradually increasing volume.
This is the third CHoB.
3 CHoBs = CHoCH, price officially changes character from sideways to a downtrend.
Phase E: Downtrend outside the TR
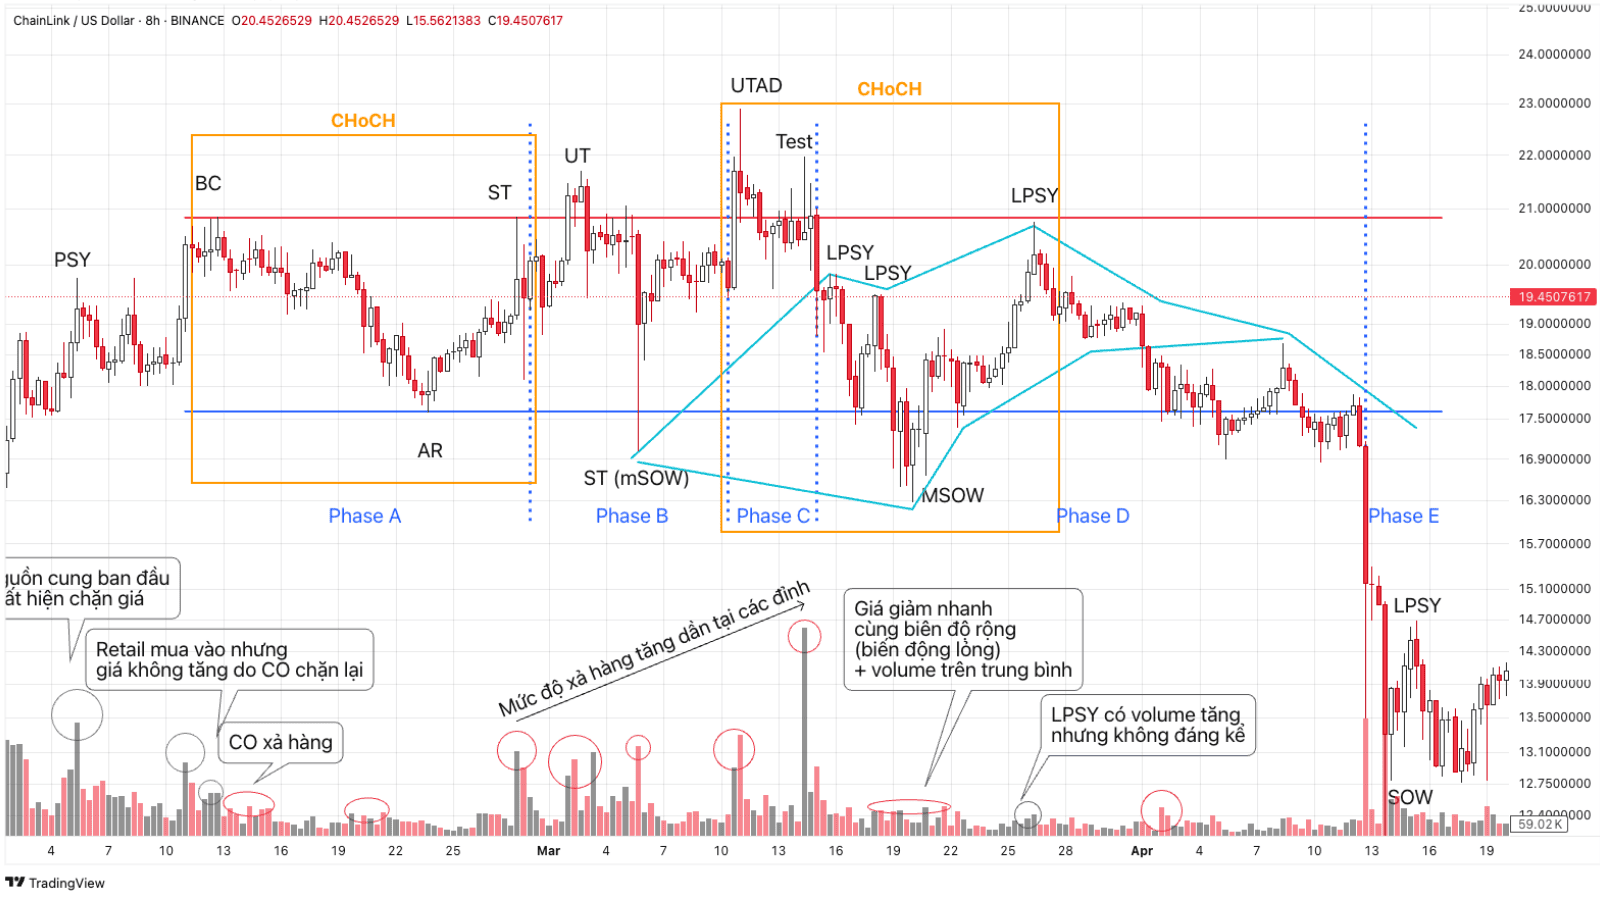 Figure 8: Phase E of the distribution structure
Price has now left the TR and supply completely controls the market.
Phase E begins from the moment price moves beyond the lowest low of MSOW.
Afterward, consecutive SOWs (large volume) and LPSYs (small volume) are created in phase E, creating lower highs and lower lows. From these highs and lows we can draw a falling trend channel.
Price continues to fall until it reaches its price target or oversold conditions appear.
Signs of a distribution structure
Distribution and Re-accumulation are two phases with many similarities.
Some signs to recognize the distribution phase (for reference):
- SOW with large decreasing volume and small recovery volume is an important characteristic of the Distribution phase.
- If a lowest low appears in the early stage of the TR and higher lows (HL) appear afterward inside the TR, it is highly likely that a Re-accumulation phase is being formed.
- In the Distribution phase, selling volume rises during down waves. And when comparing down waves with each other, selling volume together with range tends to grow larger and larger after making a high.
- In addition, large selling volumes appear around highs at resistance areas, showing a large presence of supply.
- If the sign of absorption in the accumulation phase is gradually decreasing volume, conversely, the sign of distribution is shown through gradually increasing volume.
The CO's goal is to sell as much inventory as possible but without making price fall. But it will make the uptrend slow down.
Pay attention to how price quickly falls back to the support line. This signal shows there is no buying demand obstructing price and the CO is distributing inventory.
Building a strategy and examples:
- Phases |A| & |B| are a strategy to make decisions to partially exit positions at the BC, ST and UT highs.
- Phases |C| & |D| are a strategy to exit the remaining positions because the CO's selling is mostly complete and they have left the market. The CO no longer has motivation to support the stock price from falling.
- Phases |C|, |D| and |E| are where we will set up sell positions to prepare for a large and rapid decline.
Example of a distribution structure with UTAD — MU stock
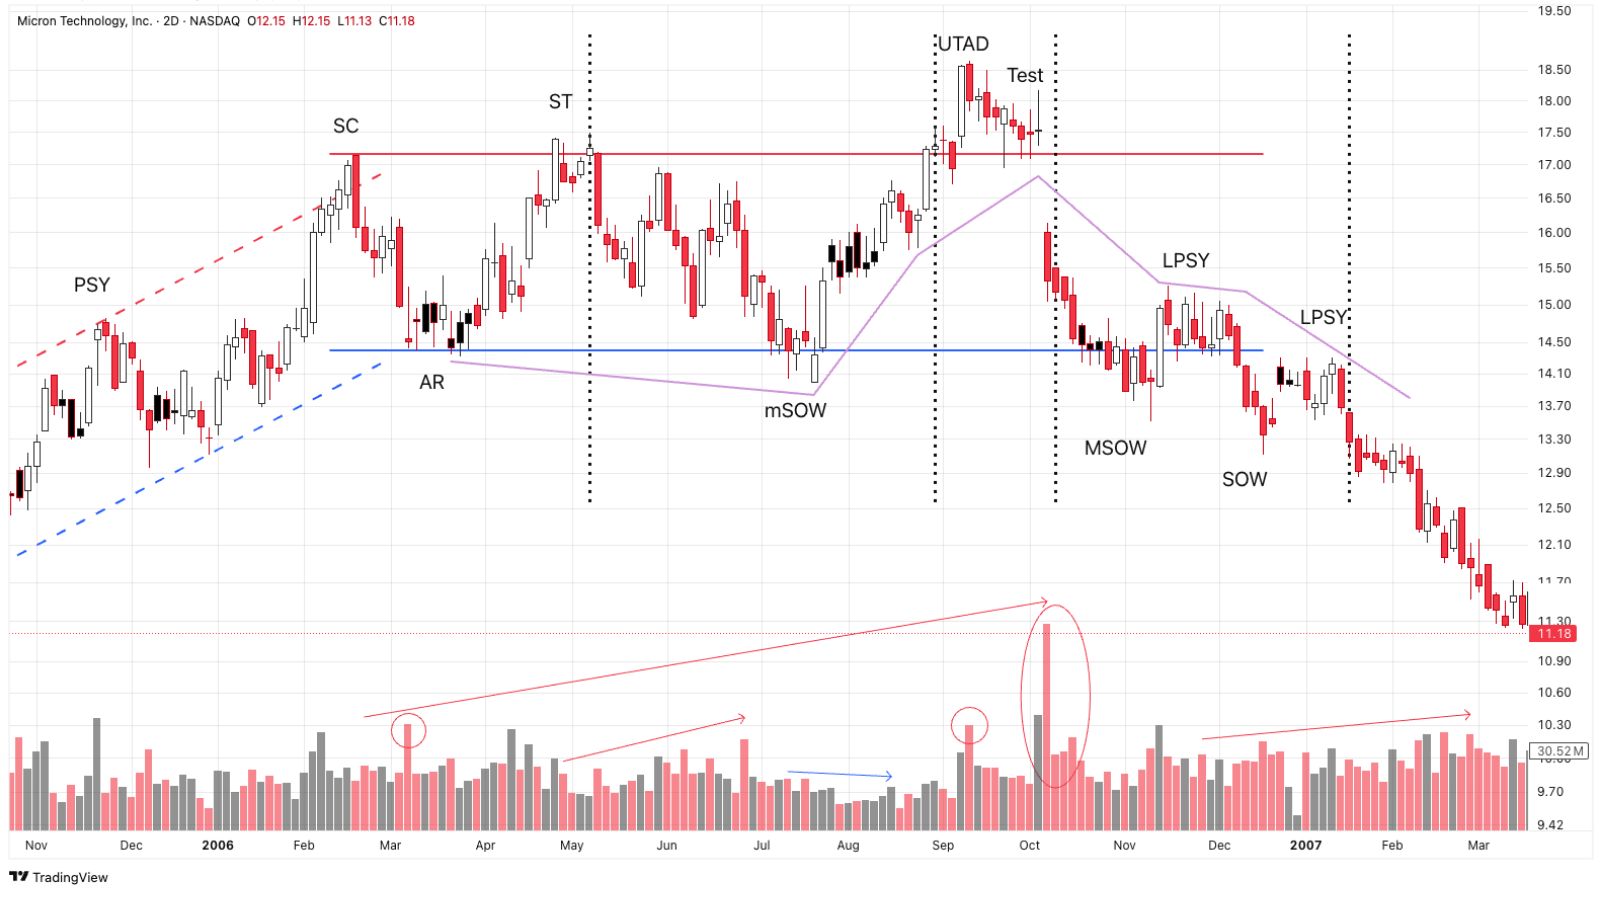 Figure 9: Distribution structure with UTAD in MU stock
- Observe price moving outside the reversed price channel; this is SC and price stops the uptrend and turns sideways.
- The decline from SC down to AR and from phase A ST down to mSOW has increasing volume, proving strong distribution by the CO.
- The lack of clear thrust in the recovery rally from mSOW up to UTAD, shown by decreasing buying volume.
- In phase C, the CO distributed a large amount of supply in hand with the largest volume column in the entire TR.
- When price punches down through The Ice, demand has turned into supply and price easily continues falling afterward with selling volume dominating most of the time.
- LPSYs are suitable positions to open sell positions for Wyckoff analysts.
Example of a distribution structure without UTAD — ISRG stock
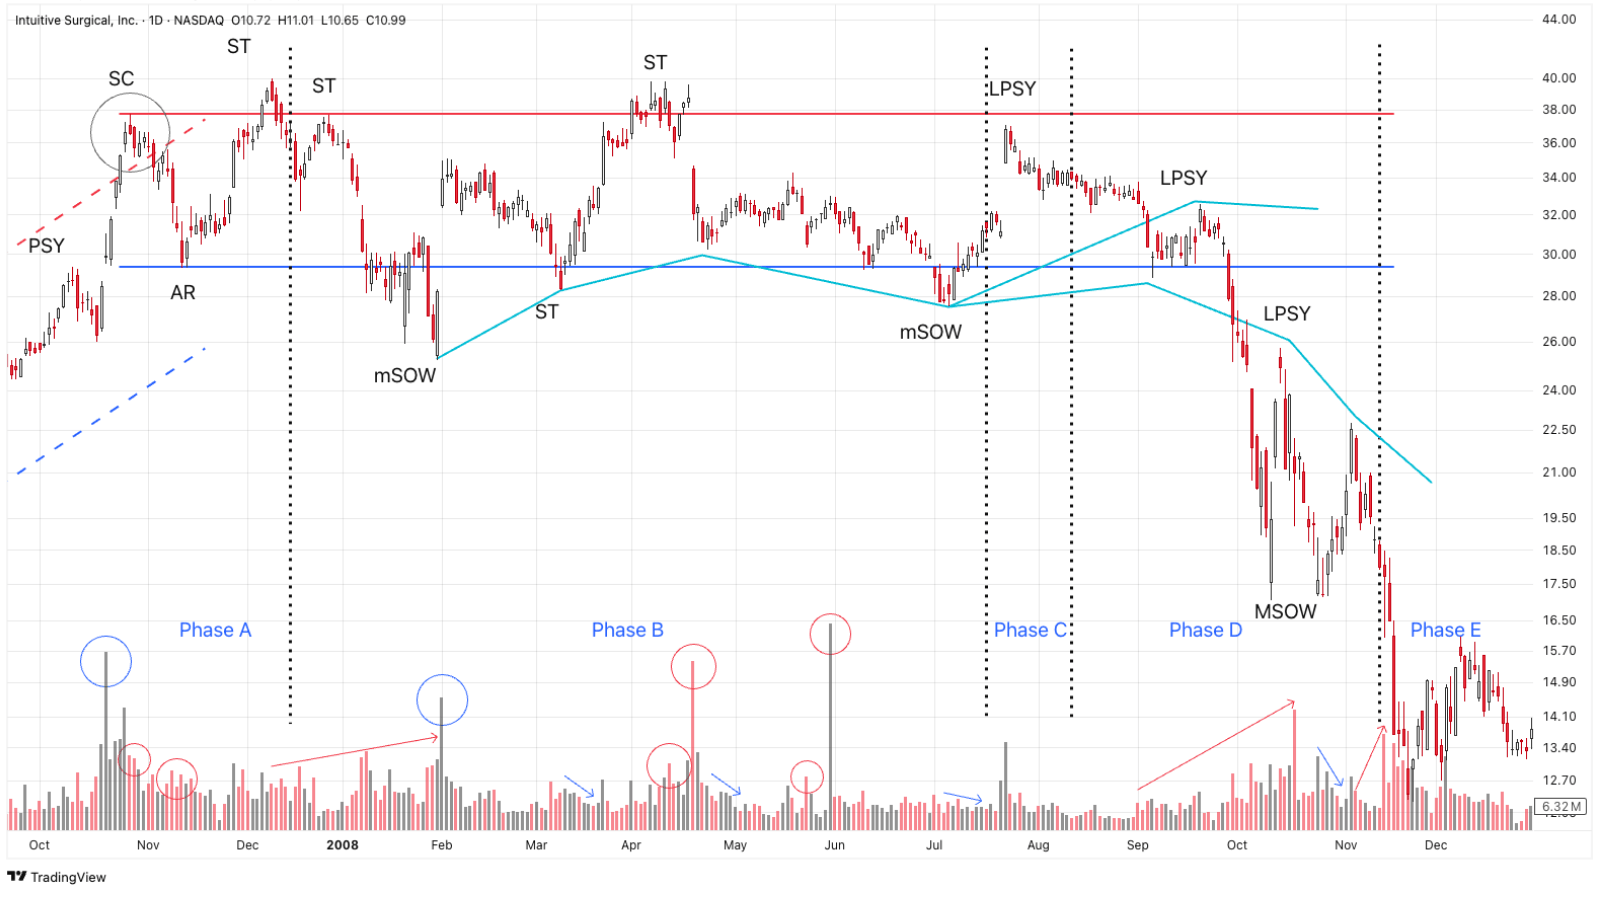 Figure 10: Distribution structure without UTAD in ISRG stock
- Price exceeds the reversed rising price channel at the SC position, signaling the uptrend stopping and turning sideways.
- At the upper boundary positions of the TR, high volume shows strong supply.
- Rallies that exceed resistance but immediately reverse sharply downward with volume remaining high show the CO's distribution.
- Rallies up from lows have decreasing volume, proving buying demand is very weak.
- At the phase C LPSY position, price rises strongly with high volume creating a gap, causing some inexperienced analysts to think phase B mSOW is a Spring event of a re-accumulation structure. We can even draw a Creek line from the ST high through phase C.
- However, the subsequent upward effort is gone when price falls back and breaks through The Ice. If our bias before that was bullish, here we must change it to bearish.
- The LPSY position retesting The Ice is a suitable place to open a short sell position.
Besides the two conventional distribution structures (Conventional Distribution Trading Range), we have a few other shapes. Please read on in part 8.
5/5 - (1 vote)
Read structure 10x faster with JUKA
JUKA maps SMC structure — swings, BOS, CHoCH and inducement zones — automatically on any TradingView chart. No more hand-drawing structure for hours.
Get JUKA — $150