Wyckoff Part 9: The Re-Distribution Phase and Its Patterns
What is the Wyckoff re-distribution phase?
Re-distribution in Wyckoff is the phase where price pauses its decline to consolidate the sellers' strength, followed by a new downtrend.
Re-distribution is formed inside a downtrend, and can appear many times.
With the re-distribution phase, the CO:
- Places sell positions at the top area during TR formation to take profit.
- Closes sell positions (or buys back) at the bottom area of the TR to prevent price from falling deeper.
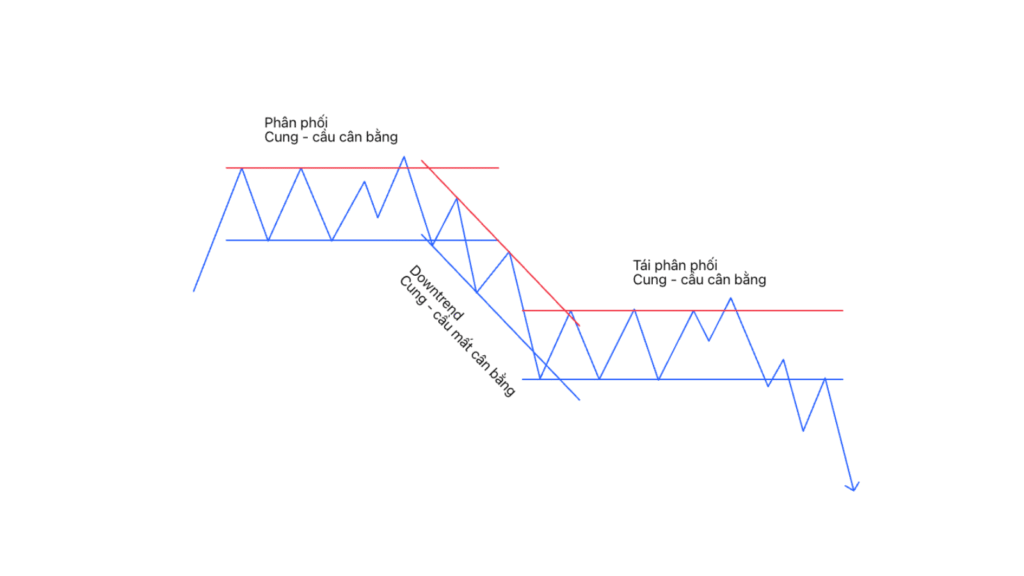 Figure 1: The formation of re-distribution
When the price target of the distribution process has not yet been reached, a re-distribution structure is formed to add new selling pressure to push price to continue falling to the target.
Analyzing a downtrend
When the distribution phase is complete, a large amount of supply is in the hands of the public with no price support from the CO, and price will fall rapidly.
That is precisely an excess of supply and a shortage of buying power.
Visually, a downtrend is unfriendly and harder to trade than an uptrend due to strong, sudden and rather chaotic volatility.
A downtrend lies inside a falling price channel.
Characteristics of a falling trend channel:
- The supply line connecting two highs with large volume acts as a resistance line, where supply is present and pushes price to lower levels each time it is touched.
- The demand line is drawn parallel to the supply line through a low lying between the two highs.
- When price falls out of the demand line it shows oversold, a sign of exhaustion and may stop the Downtrend phase (not a buy signal).
- This stopping event can form a re-distribution or accumulation phase; using Wyckoff analysis will help detect which scenario will occur.
- Using a reversed price channel is even more useful when oversold phenomena occur.
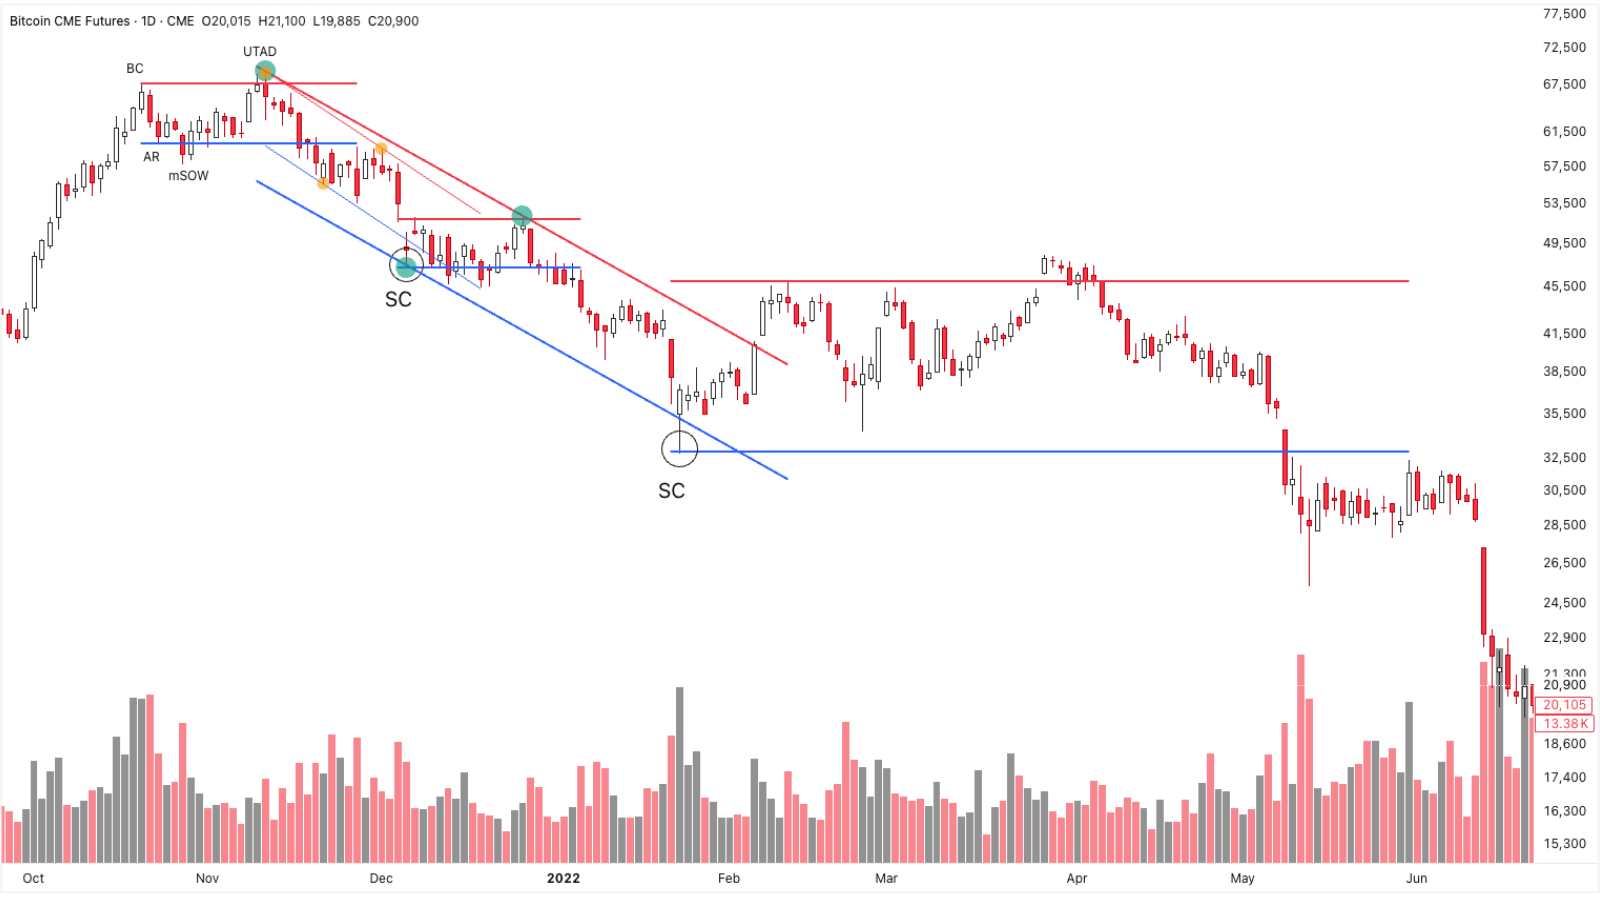 Figure 2: Bitcoin downtrend at the end of 2022
The chart in figure 2 shows the downtrend of $BTC:
- Oversold conditions appear when price breaks down out of the demand line. A small re-distribution structure is formed afterward.
- After the distribution phase, price falls and enters a falling trend channel (thin lines). This price channel is created by three orange points.
- Price continues falling after the re-distribution phase. We identify a large falling price channel (thick lines), created by three blue points.
- Oversold conditions appear when price breaks down out of the demand line. A larger re-distribution structure is formed afterward.
The re-distribution structure (Redistribution)
The Re-distribution structure has a beginning similar to Accumulation, but its formation process and result are similar to the Distribution structure.
Re-distribution has two conventional forms with phases and events as follows:
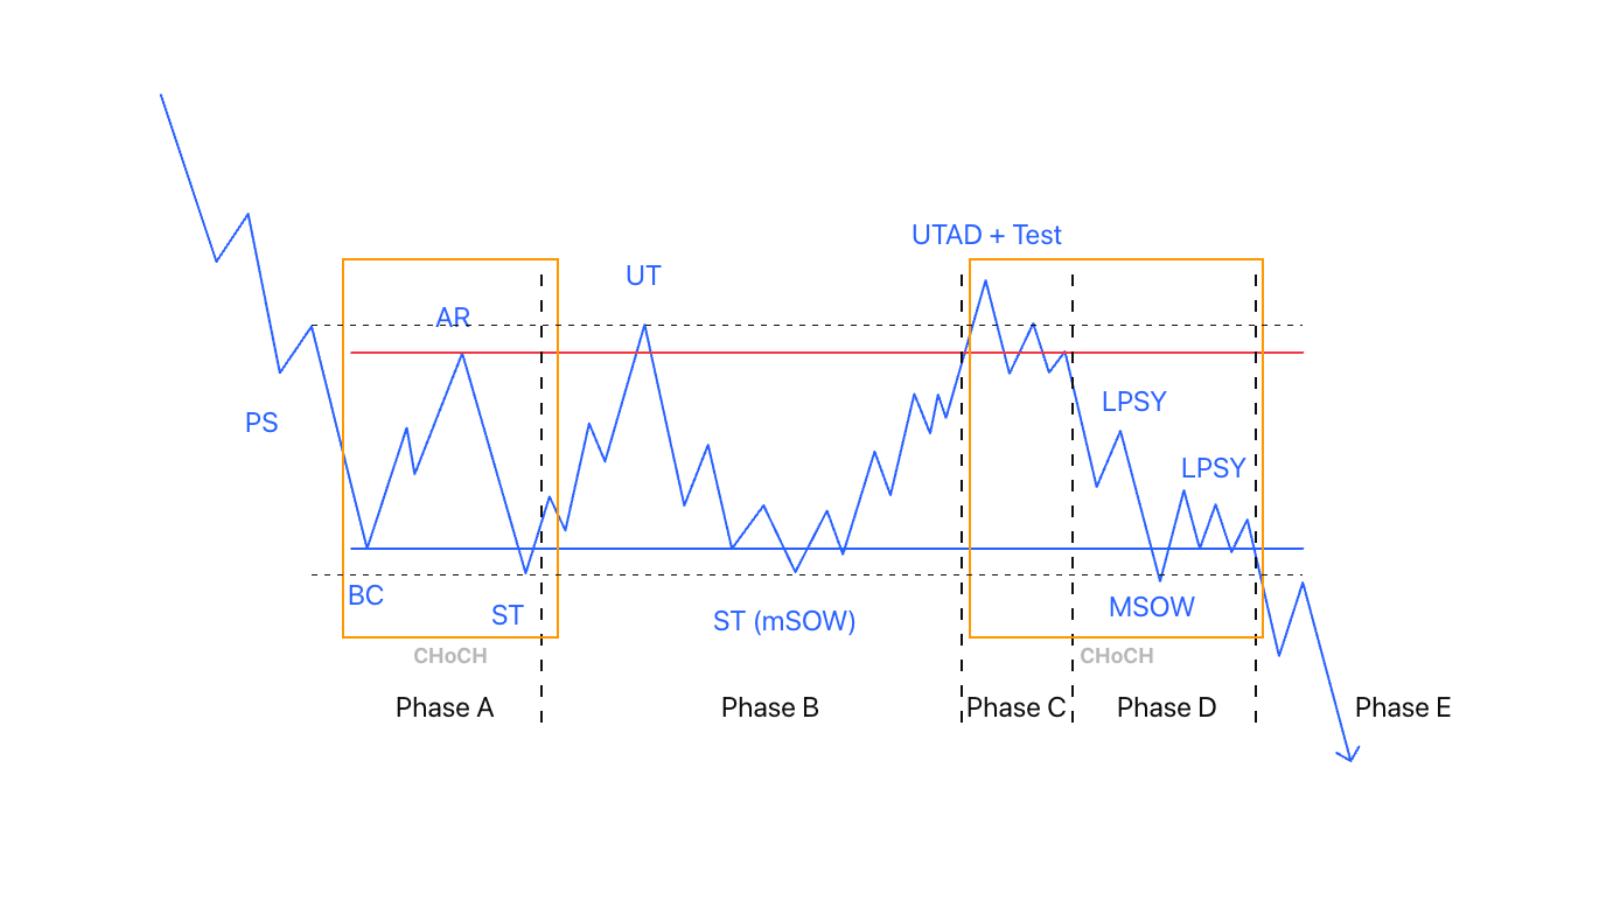 Figure 3: Re-distribution with UTAD
 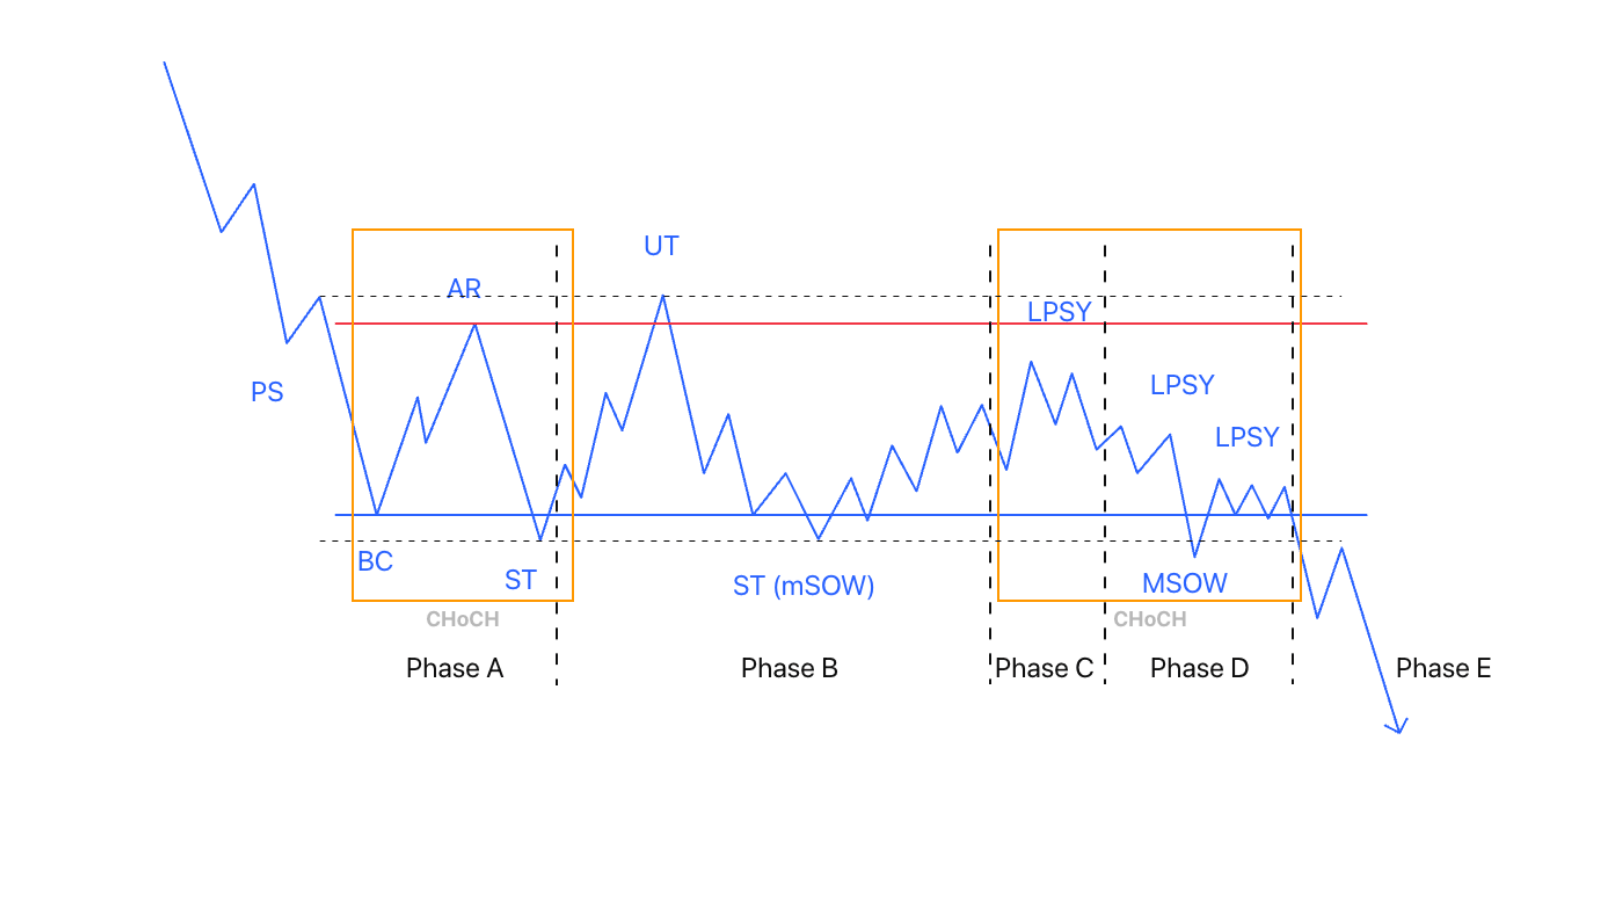 Figure 4: Re-distribution without UTAD
The phases and events of the Re-distribution phase take place similarly to the Distribution phase. The difference is that Re-distribution is started by a downtrend, while Distribution is started by an uptrend.
Phase A: Stopping the downtrend
Re-distribution phase A is similar to Accumulation phase A because before it is a long downtrend, consisting of the events:
PS (Preliminary Support)
This is temporary buying that weakens the previous declining momentum.
Trading volume at PS is usually high and price may exceed downward out of the demand line of the falling trend channel.
SC (Selling Climax)
At the time the public rushes to panic-sell due to negative news, the CO stops selling; they even buy in to temporarily absorb supply from the public.
Weakened supply causes price to stop falling and bottom-fishing demand appears, causing price to rise and create a notable change of behavior (the first CHoB).
Trading volume at SC can be higher or lower than PS depending on the remaining supply.
SC will have higher reliability if price lies below the demand line and candle wicks appear.
AR (Automatic Rally)
Price rallies up to AR; here the CO appears and continues distributing, causing price to fall back (the second CHoB).
ST in phase A: Secondary test
The CO distributes and pushes price down to the lower boundary of SC to retest this area; here the CO stops selling, making it hard for price to fall further.
Demand appears, buying in to protect the previous buy position at SC, causing price to rise, creating the phase A ST event (the third CHoB).
3 CHoBs = CHoCH → Price officially moves into a sideways phase and ends phase A of the re-distribution process.
Phase B: Building a cause
Starting from phase B, price has properties similar to the Distribution phase.
UT (Upthrust): Bull trap
The UT event consists of tests of supply at the upper boundary of the TR.
The CO pushes price to break through the upper boundary, creating excitement for the public to buy in, then the CO distributes to shake these people out.
mSOW (Minor Sign of Weakness)
Continuous tests of the lower boundary of the TR (phase B STs).
The public is gradually weakening through the ST rounds; when price falls deeper than the low of the TR it is a sign of weakness — this is the mSOW event (or ST as mSOW).
Observe mSOW to compare with previous STs whether there is weak upward price movement, i.e. a lack of buyer interest.
Phase C: Test
Similar to distribution, the UTAD event is the action where the CO tries to coordinate price to exceed the highest high of phase A and phase B.
A perfect trap for the public to FOMO-buy here.
UTAD is the position where the CO can sell their inventory at the best price.
The CO's distribution action at UTAD also tests whether public demand is still strong.
In the case where price cannot rise above the high, we call that LPSY.
After the UTAD/LPSY event, buyers run out of money to buy or are no longer interested, because most of the supply is in their hands.
The path of least resistance for price now is down; the CO continues selling the rest of their inventory, causing price to begin falling and enter phase D.
This is the first CHoB.
Phase D: Decline inside the TR
MSOW (Major Sign of Weakness)
Demand has been exhausted in phase C, supply > demand → Price quickly falls to the lower boundary easily (Ease of Movement), breaking through The Ice line to create a Major SOW.
When price lies below The Ice, price easily falls because it encounters little obstruction.
LPSY in phase D
Price is at a position lower than the TR bottom area; remaining demand from the public tries to buy the dip to protect their positions, causing price to recover back to LPSY. This is the second CHoB.
This recovery pressure is very weak, shown by small volume.
At this point the CO can comfortably sell the remaining inventory they hold without fear of anyone supporting price; price continues falling into phase E.
This is the third CHoB.
3 CHoBs = CHoCH → Price changes character from sideways to a downtrend.
Phase E: Downtrend outside the TR
When the CO has handed over all their inventory, most of the supply is in the hands of the public. The CO is holding cash and of course they do not buy to support price.
Sellers overwhelm buyers; everyone scrambles to sell, creating chaos, clearly visible through price bars with wide range, gaps, and erratic volume.
In phase E, lower SOWs (lows) and LPSYs (highs) form a falling trend channel.
Throughout the Re-distribution process, trading volume will be large and gradually increase, as in Distribution.
Re-distribution structure patterns
Redistribution has many shapes and variations and on different timeframes.
They are often complex, leading to limited predictability.
As in previous articles, the advice is that we should only focus on the two main patterns of the structure: Re-distribution with UTAD and Re-distribution without UTAD.
Variant patterns are only for reference purposes.
Below are the commonly seen Redistribution Schematic shapes:
Re-distribution structure with UTAD
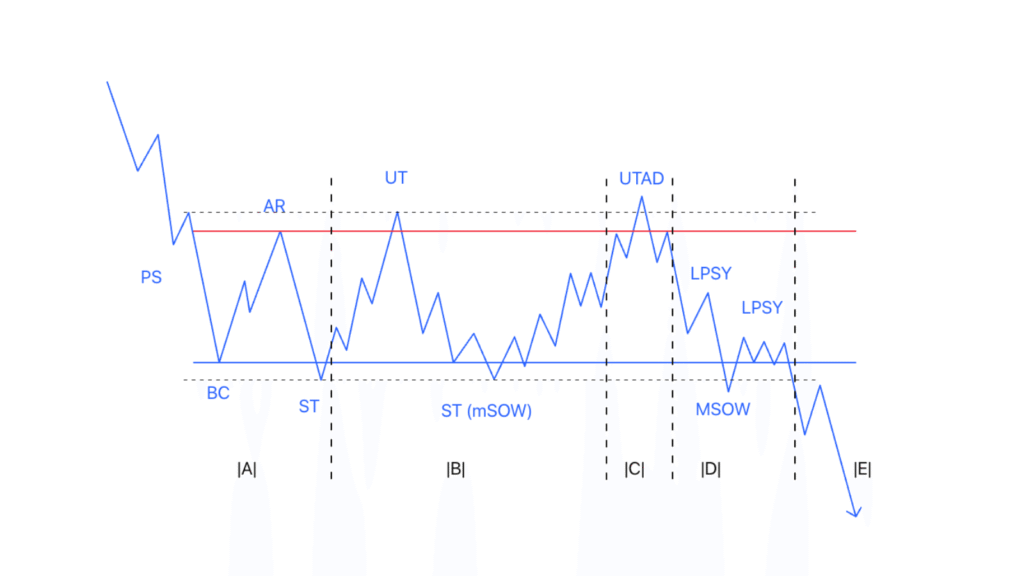 Figure 5: Re-distribution structure with UTAD
This is a conventional Re-distribution pattern, easy to recognize. The mSOW position is easily confused with a Spring in the Accumulation pattern.
💡 Tip: You can use Volume Profile to take profit in case you opened a buy position at a Spring but still suspect it is mSOW (to be presented in the Volume Profile article).
Example of a conventional distribution pattern with UTAD in Cardano:
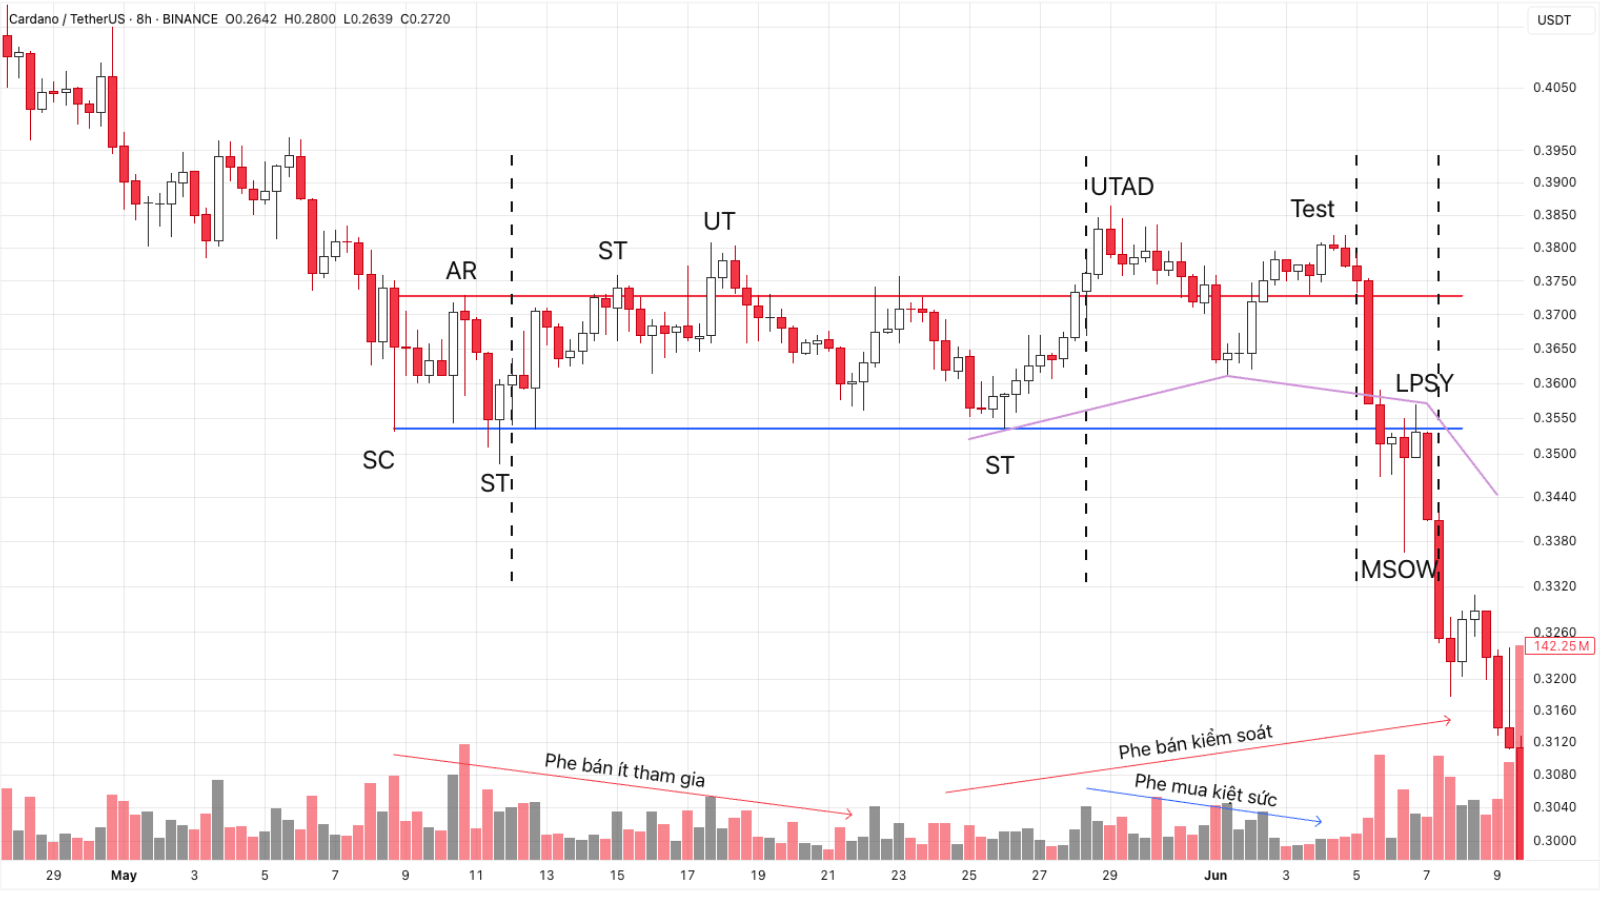 Figure 6: Re-distribution structure with UTAD in the ADA/USDT pair
- From phase A to phase B, trading volume decreases, showing the CO has no interest in participating.
- Price exceeds the upper boundary three times in phase B but pulls its wick back down, showing active selling pressure pushing down.
- In phase C, price is pushed up beyond the upper boundary of the TR. Observe that volume at the Test is much smaller than volume at UTAD, showing buyers are exhausted.
- Moving to phase D, price falls with gradually increasing volume, showing sellers dominating.
- Suitable entry points lie in the LPSY area.
Re-distribution structure without UTAD
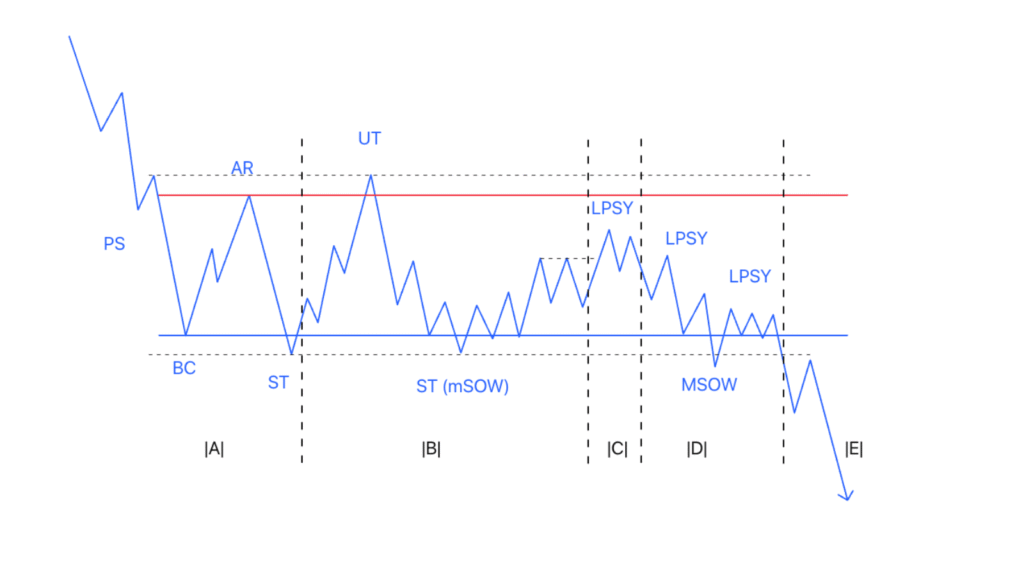 Figure 7: Re-distribution structure without UTAD
This is also an easy-to-recognize Re-distribution shape when price lies neatly inside a Trading Range.
A commonly seen characteristic of this model is that demand quickly becomes exhausted at the phase C position, causing price to be unable to rise above the upper boundary of the TR.
Example of a re-distribution pattern without UTAD in the NZD/USD forex pair:
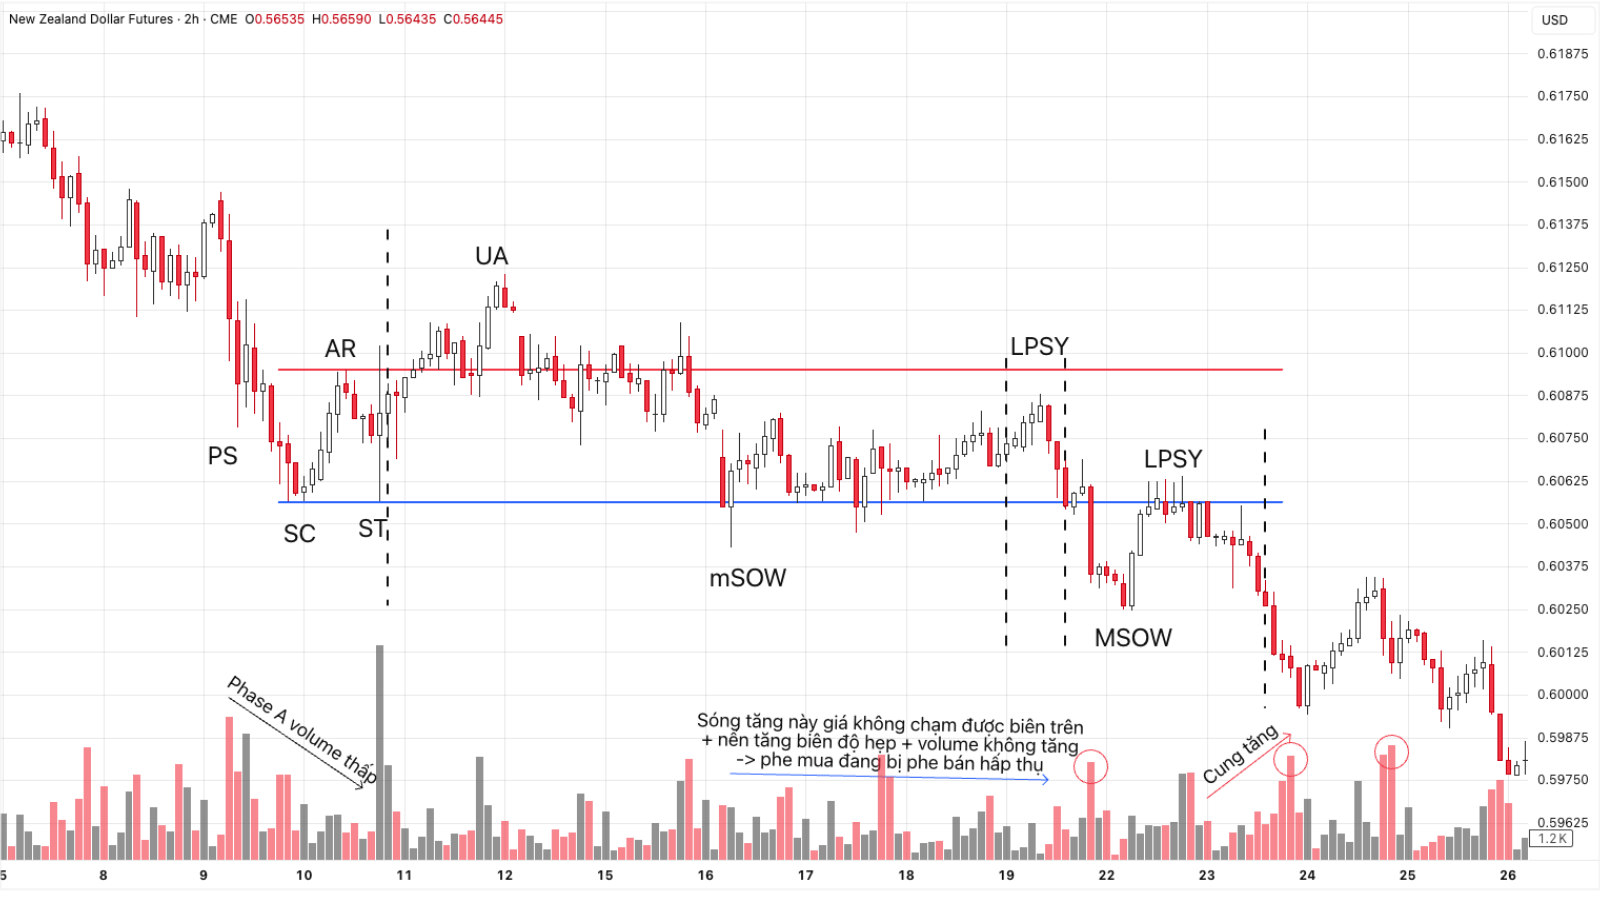 Figure 8: Re-distribution structure without UTAD in the NZD/USD pair
- In phase A, volume decreases from PS, SC to AR, showing CHoCH momentum is not high → Temporarily the bias leans toward Re-distribution.
- After that, volume at ST spikes suddenly, pushing price beyond the upper boundary creating an Upthrust Action event. However, the three rising candles creating the UA have gradually decreasing volume, followed by a denying red candle accompanied by a gap, showing sellers appear and dominate.
- Price falls to the lower boundary to test (ST), then the recovery wave pushes up weakly (narrow range) with slightly decreasing volume. After that it quickly falls beyond the lower boundary on high volume → So we predict that ST is mSOW and the recovery wave up is phase C LPSY.
- A rally up to phase D LPSY appears with many wicks rejecting a return into the TR; the sell entry point is the red SBar candle afterward.
Form 3: Re-distribution showing weakness
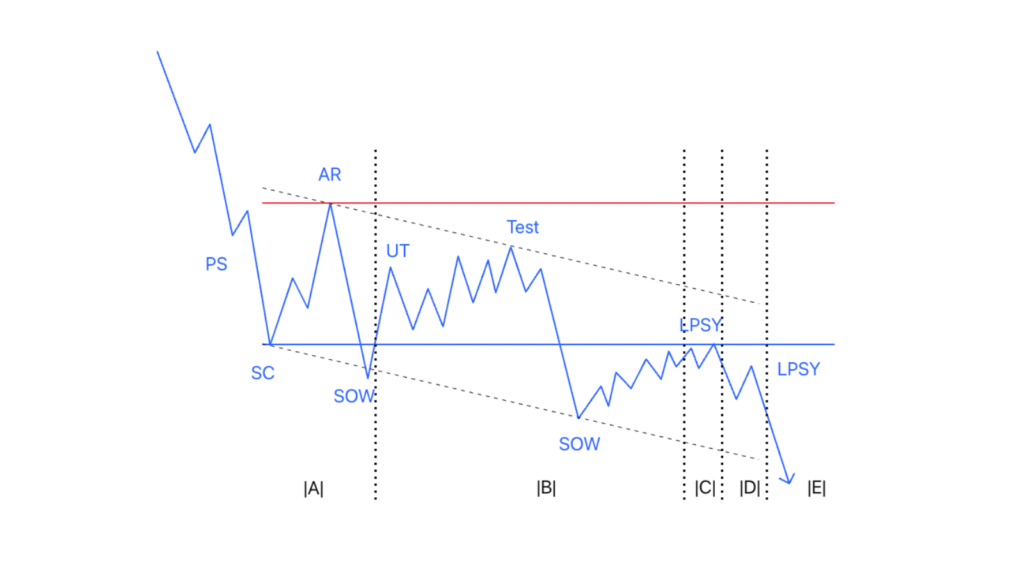 Figure 9: Re-distribution pattern showing weakness
This structure shows weakness, when price cannot return to the high created before but continuously creates lower highs and lower lows; the TR can be drawn horizontally or sloping.
Example of a weak re-distribution pattern in Ethereum on the H1 timeframe:
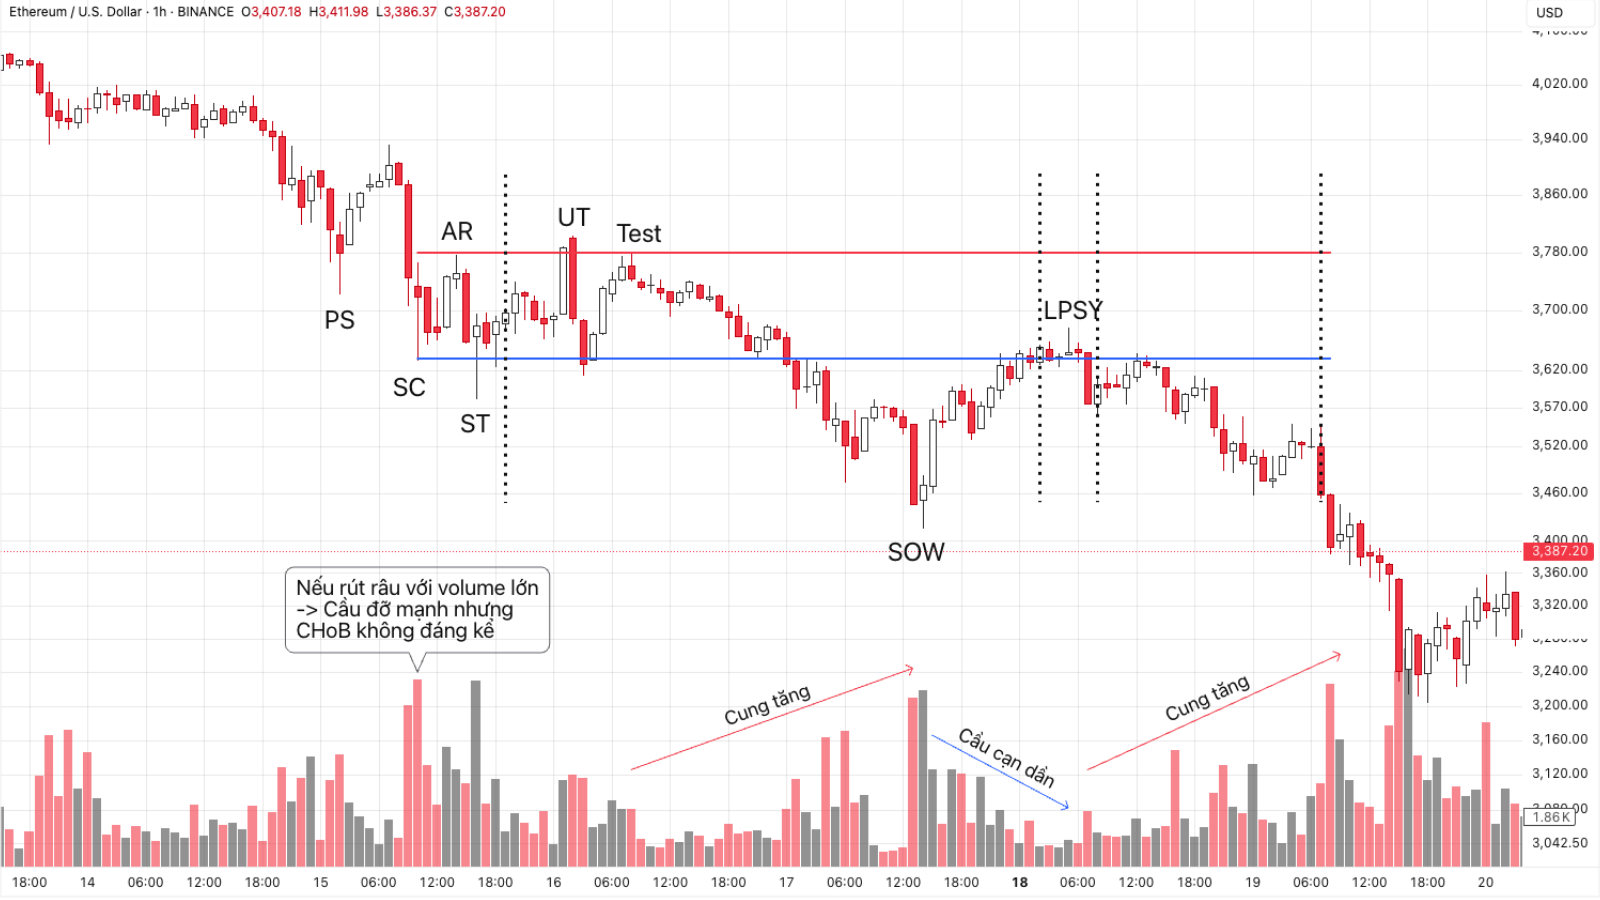 Figure 10: Weak re-distribution structure ETH/USDT
- At the start of the structure we see fairly strong demand supporting price, but the result is not large.
- Price gradually falls in phase B until it breaks through the lower boundary of the TR and goes deep below, when volume increases strongly on red candles → Supply increases.
- Price recovers to the upper boundary with decreasing volume → Demand is weakening.
- Price easily falls further afterward with strongly increasing volume. The suitable point to open a sell position is at the Sbar candle after LPSY.
Form 4: Re-distribution after a recovery
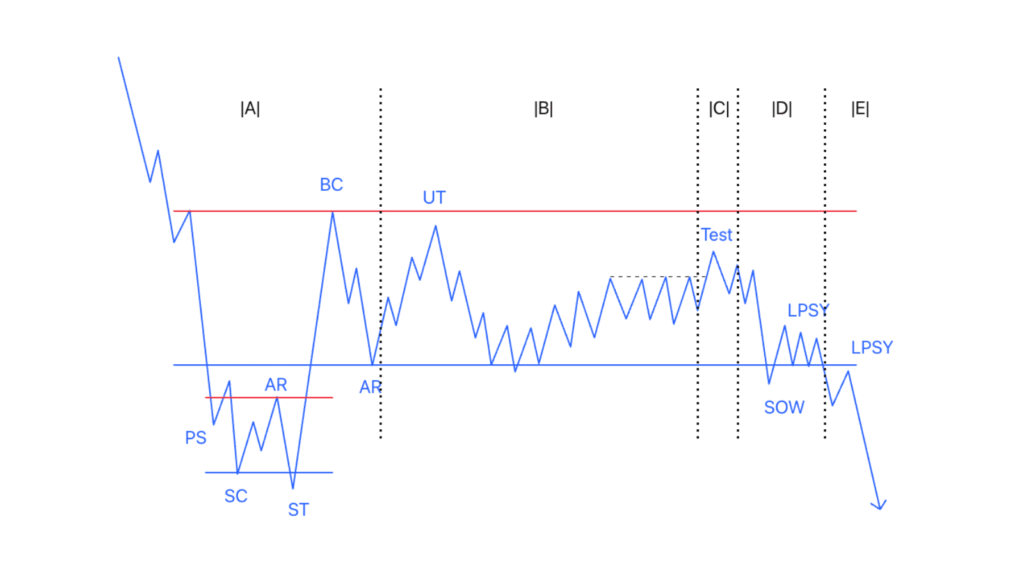 Figure 11: Re-distribution structure after a recovery
This model clearly shows buyer strength in the early stage of phase A.
The CO feels there is no strong demand, so they do not carry out distribution at low prices. Instead they let price rise to a high resistance zone above and then carry out a distribution plan up there.
In essence, this form of re-distribution structure is a combination of a small accumulation structure and a larger distribution structure.
Example of a re-distribution after recovery pattern in the NASDAQ 100 index:
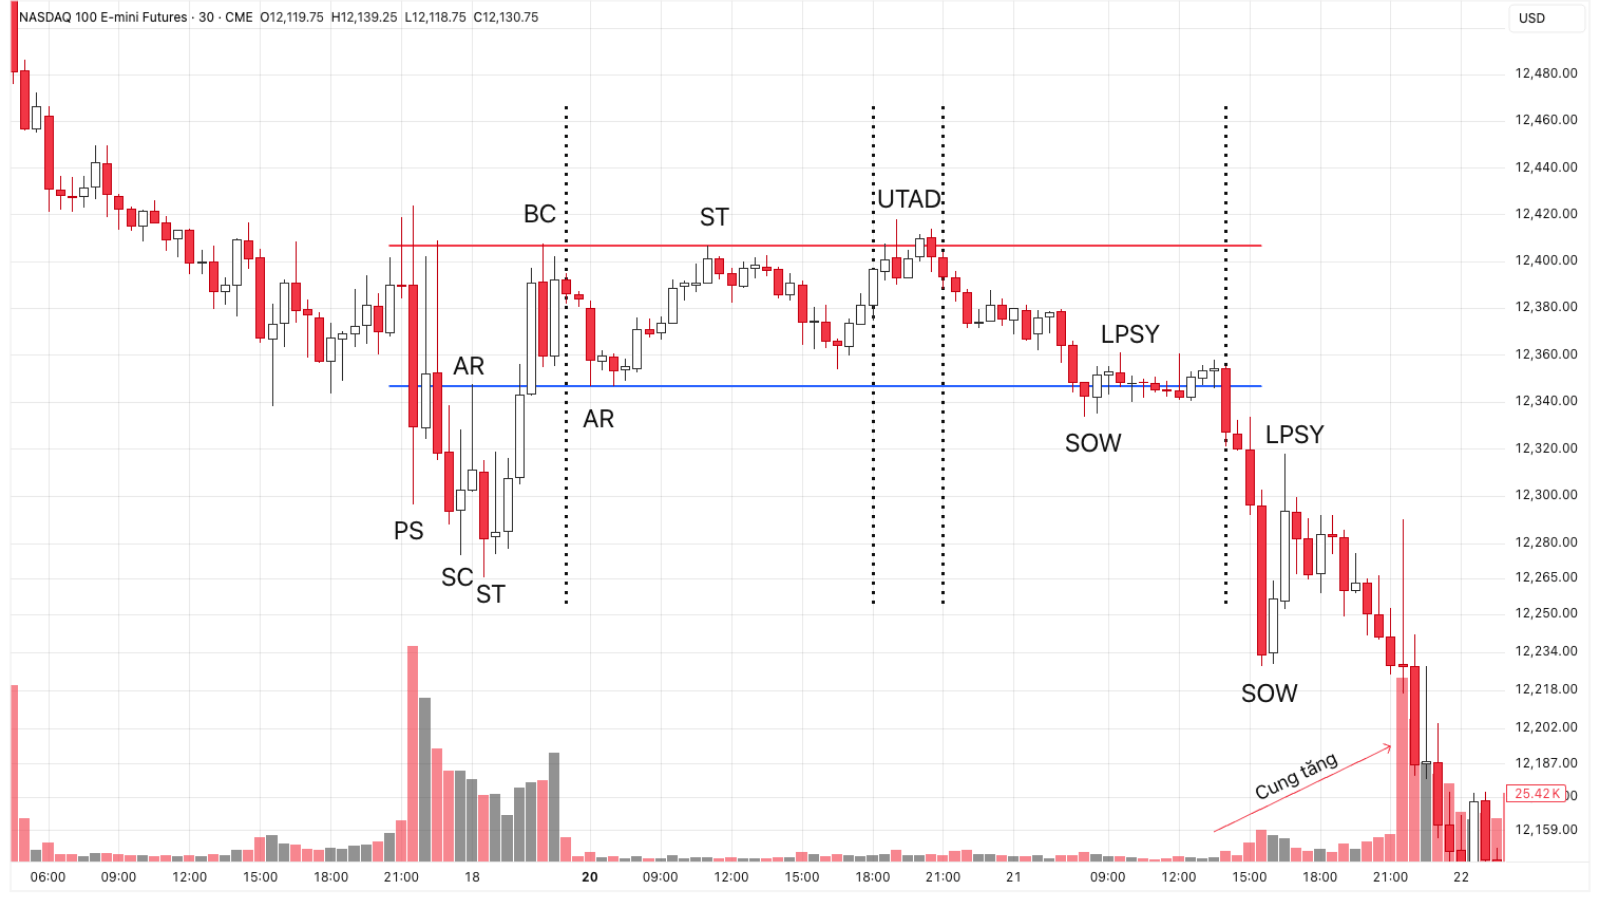 Figure 12: Re-distribution structure after a recovery
- Volume in phase A is high, showing strong demand and a large third CHoB result; the CO on the selling side is forced to let price rise to the liquidity zone above to distribute inventory.
- A distribution structure is skillfully carried out by the CO here with all events.
Signs of Re-distribution
The Re-distribution phase is easily confused with the Accumulation phase. Avoiding buying in the early stage will help a lot.
mSOW is easily confused with a Spring, and UTAD is easily confused with SOS.
Wyckoff analysts will rely on the mindset: control of supply will change from the COs at the start of the downtrend, but afterward will gradually transfer to the public throughout the TR formation process.
Some identifying signs:
- The CO increases the scale of selling at highs during TR formation, leading to volume potentially rising higher each time price touches the highs.
- Sometimes rallies are often fast and strongly volatile to remove weak short sellers, while declines are often less volatile in phases A and B.
- If price has formed a Hypodermic distribution structure (pine tree or needle) at the top, it is very likely the CO has not finished distributing all their inventory. Therefore the first TR after a Hypodermic is very likely to be re-distribution, an important opportunity for the CO to sell the rest of their inventory.
- When lying inside a falling price channel, the re-distribution phase tends to approach the supply line at the end of the TR and fall sharply afterward.
Comparison with Accumulation:
- Compared with collecting inventory in the accumulation phase, the re-distribution phase will cause difficulty for the CO due to a shortage of buyers when they sell.
- The accumulation phase usually ends gently with the appearance of a new uptrend. While the re-distribution phase usually begins and ends with clearly large volatility.
- When price kills the Creek line, we change the bias to bearish and redraw The Ice line.
5/5 - (2 votes)
Read structure 10x faster with JUKA
JUKA maps SMC structure — swings, BOS, CHoCH and inducement zones — automatically on any TradingView chart. No more hand-drawing structure for hours.
Get JUKA — $150